

Книги по МРТ КТ на английском языке / Functional Neuroimaging in Child Psychiatry Ernst 1 ed 2000
.pdf114M. F. Casanova, D. Buxhoeveden and G. S. Sohal
inhibit their direct neighbors (lateral inhibition), which serves to enhance the localization of function for a particular column unit. A column may also activate immediate neighbors or columns that are farther away. The combination of these individual units creates larger units of function that can be detected by physiologic or metabolic activities. A column may send connections to other areas that are distributed throughout the cortex. Columns receive excitatory input from the thalamus and callossal connections from the other hemisphere as well. Global activation of hundreds of columns is possible by vast arrays of excitatory interconnections. Columnar organization of function has been documented throughout the sensory and association areas (Mountcastle, 1997). Work in recent years has allowed precise descriptions of the working of neurons within a single cell column (Favorov and Kelly, 1994a,b).
Anatomically, the single cell minicolumn can be identiWed by both the vertical array of neuronal bodies and the dendritic clusters that weave through the center of them. The outer edge of cell columns is the space utilized by the long-distance axonal Wbers. Dendrites from large pyramidal cells of layerV form clusters that ascend through layer IV. These are joined in the supragranular layers of cortex by apical dendrites from layers III and II. Each dendritic bundle is the center of a module of pyramidal cells; they arise in the same area where the cell bodies are located and weave through them. The horizontal distance between these cell columns is said to range from 20 to 80-m and the average modules are 30-m in diameter. Importantly, these dendrite clusters appear early in ontogenesis as the cortical plate is forming, and before it receives aVerent axonal input. They are found in many mammal brains in every cortical area so far studied.
Embryologic studies demonstrate that cell columns have a strong genetic basis. The earliest cell columns arise as ontogenetic units from the ventricular zone, which is the area that gives rise to what will become the mature neurons of the cortex. They start out as discrete units even before they climb up the glial scaVolding into the cortex (Rakic, 1978). The surface area of the neocortex is determined by the number of ontogenetic units, which, in turn, is based on the number of symmetric cell divisions of progenitor cells in the neural epithelium before migration occurs (Rakic, 1988a,b). An extra cycle of cell division would have the eVect of roughly doubling the area of neocortex. Therefore, expansion of the neocortex in evolution may be a consequence of mutational changes in the number of symmetric divisions in regional zones of the epithelium (Rakic et al., 1991); alterations in development during this phase have serious consequences for brain development.
An expanding cortex against a rigid cranium provides a
mechanical need for folding and consequent gyriWcation (see below). The process providing uniformed guidance to this striking feature of the primate brain is not known. Recent research suggests that it is the result of intrinsic cortical factors (Armstrong et al., 1991). Elements like maintenance of columnar length and laminar thickness (Smart and McSherry, 1986a,b), ratio of subplate to cortical thickness (Kostovic and Rakic, 1990), and sizes of axonal bundles lying within gyri (Goldman and Galkin, 1978) have been proposed as causal factors.
GyriWcation is not equally distributed between the hemispheres. The sylvian Wssure is apparent at 14 weeks of gestation, followed successively by the rolandic (24 weeks) and the calcarine (26 weeks) Wssures. Gyrations are present throughout the hemispheres by 32 weeks of gestation (Friede, 1989). The amount of folding accrued to gyriWcation follows a rostro-caudal gradient and varies in relation to the amount of space occupied by the supragranular layers compared with the lower ones (Armstrong et al., 1991). One can usually estimate maturity by counting the number of convolutions crossed by a line joining the frontal and occipital poles above the insula and adding 21 weeks (Friede, 1989). The resultant number is a reliable guide to maturity despite low birth weight or the presence of edema (Pryse-Davies and Beard, 1973).
Embryogenesis
Development of the human central nervous system (CNS) begins around 3 weeks after formation of the zygote. It is then that the embryo takes the form of a Xattened disk. Initially the disk is bilaminar and consists of two cell layers, the epiblast and the hypoblast. Proliferation and migration of the epiblast ultimately leads to the formation of the trilaminar embryonic disk and the completion of gastrulation. The three layers derived from the epiblast are: the embryonic mesoderm formed from the migrated epiblast cells, the ectoderm formed from the original epiblast cell layer, and the endoderm formed from epiblast cells replacing the original hypoblast cell layer. These three layers will give rise to all subsequent body structures. SpeciWcally, the ectoderm will give rise to the nervous system.
The next important step in nervous system development involves the formation of a solid notochord, which runs in the midline of the trilaminar disk in the cranial to caudal axis. Slightly earlier in development, a structure known as the primitive streak appears along the longitudinal midline of the embryonic disk. Mesoderm cells migrate through this streak to form a tube called the notochordal process. This structure undergoes several transformations and ulti-
Brain development and evolution |
115 |
|
|
(a)
(b)
(c )
Fig. 7.1. Conversion of the neural plate into neural tube. The lateral edges of the Xat neural plate (a) begin to rise (b) and eventually meet to form the neural tube (c).
mately becomes a solid cylinder residing in the mesoderm. The solid cylinder is called the notochord.
Formation of the nervous system is brought about by the process of induction. Induction involves one tissue inXuencing the development fate of another, by direct or indirect contact, through the release of inducing substances. Mesoderm induces the overlying ectoderm to become the neuroectoderm. After induction, the neuroectoderm is called the neural plate. The neural plate is a Xat structure that is broad in the cranial portion and narrow in the caudal portion of the embryo.
The neural plate is transformed into neural tube by the process of neurulation (Fig. 7.1). Neurulation involves changes in cell shapes and is dependent on forces intrinsic to the neuroepithelial cells as well as those exerted by the surrounding cells (Schoenwolf and Smith, 1990). A depression called the neural groove develops in the middle of the neural plate and the lateral edges of the neural plate begin to elevate. The lateral edges are called the neural folds and these continue to elevate and eventually meet in the dorsal midline. The closure of the neural tube Wrst occurs at about the mid level of the embryo and then proceeds simultaneously in the cranial and caudal directions. Failure of neural tube closure or secondary reopening of the neural tube results in neural tube defects, the severity of which varies
Fig. 7.2. Three layers become identiWable in the wall of the
maturing neural tube.
with the length of involvement of the neural tube and the region involved (Campbell et al., 1986; Campbell and Sohal, 1990).
As a result of neurulation the surface ectoderm is separated from the neural plate, the cells located between the surface ectoderm and neural plate are separated (these are called neural crest cells), and the neural plate is converted into neural tube. The surface ectoderm gives rise to the skin. The neural crest cells contribute to the formation of the peripheral nervous system and a wide variety of nonneural structures throughout the body (Le Douarin, 1982). Specialized regions of the ectoderm called placodes also contribute to the formation of the peripheral nervous system. The neural tube cells give rise to the CNS. However, this is not the exclusive fate of these cells. Recent studies have shown that some neural tube cells migrate and contribute to the formation of structures developing outside the CNS, both neural and non-neural structures (Sharma et al., 1995; Sohal et al., 1996, 1998a,b, 1999; Bockman and Sohal, 1998).
Initially, the neural tube is composed of a single layer of epithelial cells. As the neural tube matures, three distinct layers become apparent (Fig. 7.2). The layer adjacent to the neural canal is called the ventricular layer. Cellular proliferation occurs in the ventricular layer. After proliferation, the maturing neurons and glial cells begin to migrate away from the ventricular layer and gather in the mantle layer, which in the mature nervous system forms the gray matter. The processes of neurons in the mantle layer form the marginal layer, which becomes the white matter of the mature CNS.
As the neural tube thickens, two regions of increased density of cells become distinct in the wall of the neural tube (Fig. 7.3). These regions are separated by a longitudinal groove called the sulcus limitans. This is present in the spinal cord and the brainstem and it divides the wall of the

116 M. F. Casanova, D. Buxhoeveden and G. S. Sohal
Fig. 7.3. Basic organization of the developing neural tube of the
spinal cord and brainstem.
neural tube into dorsal and ventral portions. The dorsal portion is called the alar plate which gives rise to sensory cells and represents the future sites of aVerent structures. The ventral portion is called the basal plate, derivatives of which are motor structures. The dorsal midline of the neural tube is called the roof plate and the ventral midline is called the Xoor plate (Fig. 7.3). This organization is present in the spinal cord and the brainstem and absent in the telencephalon. The roof plate and the Xoor plate do not provide neurons for the developing nervous system. Although the functional signiWcance of the roof plate is not yet established, the Xoor plate plays an important role in morphogenesis. The Xoor plate is induced by the underlying notochord and both structures provide signals for the diVerentiation of speciWc types of neuron; the Xoor plate attracts nerve Wbers that cross the midline (Placzek et al., 1990; Hirano et al., 1991; Yamada et al., 1991).
The pattern of development of the rostral neural tube is diVerent from that of the caudal portion, which forms the spinal cord. Three swellings become apparent in the rostral potion of the neural tube, which will form the brain and the brainstem (Fig. 7.4). These dilated regions are called primary vesicles: the forebrain or presencephalon, the midbrain or mesencephalon, and the hindbrain or rhombencephalon. The forebrain vesicle subdivides to form the
Fig. 7.4. Formation of the primary and secondary vesicles in the rostral neural tube.
Fig. 7.5. A series of Xexures occur in the rostral neural tube.
telencephalon and diencephalon. The midbrain vesicle does not divide. The hindbrain vesicle subdivides to form the metencephalon and myelencephalon. These Wve vesicles are called secondary vesicles.
The rostral portion of the embryo bends at several places and these foldings are called Xexures (Fig. 7.5). The Wrst Xexures formed are the cervical and the cephalic. The cervical Xexure is located at the junction of the hindbrain with

Brain development and evolution |
117 |
|
|
Fig. 7.6. Adult structures and the ventricular system are derived from the embryonic neural tube.
the spinal cord. The cephalic Xexure is located between the forebrain and midbrain. Later, the cervical Xexure straightens out. The persistence of the cephalic Xexure results in the longitudinal axis of the forebrain being at 90° to that of the brainstem and the spinal cord. A third Xexure, the pontine Xexure, forms later and is located in the dorsal portion of the hindbrain. As a result of this Xexure, the dorsal portion of pons and rostral medulla is Xattened and the dorsal structures end up in a more lateral position.
DiVerent portions of the neural tube give rise to diVerent structures; the Xuid-Wlled cavities become the ventricular system (Fig. 7.6). The telencephalon forms the cerebral cortex and the basal ganglia and the cavity develops into lateral ventricles. The diencephalon forms the thalamus, epithalamus, subthalamus, and hypothalamus and contains the third ventricle. The mesencephalic vesicle forms the midbrain and the cerebral aqueduct. The metencephalon diVerentiates into pons and cerebellum and the myelencephalon forms the medulla. The cavities in the metencephalon and myelencephalon become the fourth ventricle. The neural tube caudal to the myelencephalon develops into the spinal cord and its cavity becomes the central canal. The cerebrospinal Xuid (CSF) moves through
the ventricular system. It is produced by the choroid plexus in the ventricles and eventually absorbed into the venous system.
The size and the shapes of the various portions of the mature nervous system result from a variety of developmental processes such as cellular proliferation, cellular migration, and cell death, and also from the constraints imposed by the surrounding non-neural tissues.
Cellular proliferation
The cell division in the neural tube takes place in the ventricular zone. The rate of cell division is not uniform throughout the rostrocaudal extent of the neural tube. In general, the rate of cell division is greater in those portions of the neural tube that will eventually form large structures. The time a cell stops dividing is called its ªcell birthdayº, which corresponds with the time of the Wnal DNA synthesis. Cell birthday is important in determining the Wnal destination and the fate of a cell. The diVerential cellular proliferation and growth results in a number of structures in the mature brain resembling the letter C. The cerebral

118M. F. Casanova, D. Buxhoeveden and G. S. Sohal
hemispheres, the lateral ventricles, caudate nucleus, cingulate gyrus, parahippocampal gyrus and fornix are C- shaped structures. As the telencephalic vesicle undergoes sequential and diVerential proliferation and growth, the C- shaped conWguration of the hemisphere emerges. Similarly, the associated round cavity of the vesicle also becomes C-shaped. As a result, the four major lobes containing portions of the ventricular system appear. The frontal lobe with the anterior horn of the lateral ventricle, the parietal lobe containing the body of the ventricle, the occipital lobe with the posterior horn, and the temporal lobe containing the inferior horn.
DiVerential growth patterns of the surrounding tissues also impact the developing nervous system. The gyri and sulci of the brain result from the growth of soft neural tissue conWned within the hard tissue of the skull. Segmentation of the spinal cord occurs as a result of the adjacent mesoderm, which becomes segmented into somites. During early phases, the spinal cord and the vertebral column grow equally in length and, therefore, the spinal cord segments match with the vertebral levels. Later, the vertebral column outgrows the spinal cord. This results in mismatch between the spinal segments and the vertebral levels seen in the adult. The spinal cord in the adult extends to about the level of the Wrst lumbar vertebra.
Cellular migration
After birth, cells begin to migrate from the ependymal layer to their Wnal destination. It is not clear how cells know where to go. Their migration is aided by specialized cells called radial glial cells, which stretch the entire width of the neural tube. Cellular migration is a very important developmental event because where a particular cell ends up will dictate its function. For example, if a cell migrates into the ventral horn of the spinal cord, it will become a motor neuron. If it migrates into the dorsal horn, it will be involved in processing sensory information.
One region where cellular migration has been extensively studied is the cerebral cortex. As cells begin to migrate from the ventricular zone, which occurs around 13 weeks in humans, they form an intermediate zone. The cells in the intermediate zone begin to diVerentiate and form the cortical plate. From the cortical plate, cells migrate into diVerent layers of the cortex. This migration is dependent on the cell birthday. For example, cells born early migrate least and end up in the deepest layers of the cortex. Similarly, cells born later migrate past the earlier born ones, migrate longer distances, and occupy the more superWcial layers of the cortex. Thus, cortical migration occurs in an inside-out fashion.
Cell death
After migration, neurons face the issue of survival or death. The young neurons diVerentiate, that is, they develop processes and organelles and form synaptic connections. An integral part of the development of the nervous system is the loss of large numbers of diVerentiated neurons (Oppenheim, 1991), which occurs during both periods of cell genesis and establishment of synaptic connections. Half to two thirds of the neurons and glial cells that are born during fetal development will die during the Wrst decade of life. A type of organized cellular suicide, called cell death or apoptosis, governs this neural destruction. Reasons for the initial overproduction of cells and for the widespread cellular death remain a mystery. Among a variety of ideas put forward to explain the purpose of cell death, the most popular view is that it serves to match the size of the target with its innervation pool. This would imply that the targets are too small to support survival of all associated neurons. The target is believed to provide trophic factors necessary for the survival of neurons. Small targets with lesser amounts of trophic factors will, therefore, create a competitive situation for survival. It is believed that those neurons which were unable to obtain adequate amounts of trophic factors will die. There is experimental evidence in support and against this view (Sohal, 1992). A number of trophic factors, such as the nerve growth factor, ciliary neurotrophic factor, brain-derived neurotrophic factor, and neurotrophins, have been shown to rescue neurons from death. Cell death also aVects the neurons of the proliferative zones of the developing brain (ventricular and subventricular zones). Because these neurons have not yet migrated, their cell death may result from errors in cell division or diVerentiation.
Both extrinsic (e.g., changes in local environment) and intrinsic cellular conditions can induce cell death. In addition to the determining factors mentioned above, the huge extent of neuronal overproduction and neuronal death has to involve serendipity. Chance events in neuronal development, just as in genetic variation (chance mutations and recombinations), are likely to play an important role in interindividual anatomic, physiologic and behavioral diVerences (evident in monozygotic twins), and, in a larger perspective, in evolution.
Brain growth
The immature cortical plate is apparent by 10.5 weeks of gestation and precedes the appearance of the fetal subplate at 13.5±15 weeks of gestation. This subplate has more
Brain development and evolution |
119 |
|
|
value |
120 |
|
|
|
|
|
|
|
100 |
|
|
|
|
|
|
|
|
adult |
80 |
|
|
|
|
|
|
|
average |
60 |
|
|
|
|
|
Cerebrum |
|
|
|
|
|
|
Neocortex |
|||
40 |
|
Human |
|
|
|
|||
Percent |
|
brain |
|
|
|
White matter |
||
20 |
|
|
|
|
|
|
|
|
|
0 |
|
1 |
3 |
6 |
9 |
12 |
15 |
|
3 |
6 |
||||||
|
9 |
|
|
|
|
|
||
|
Prenatal (months) |
|
|
|
Postnatal (years) |
|
||
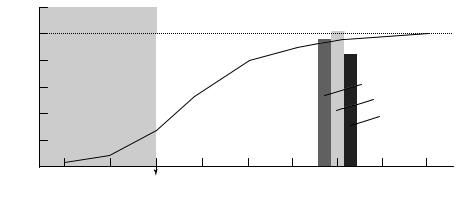
Fig. 7.7. The growth of the human brain presented from two perspectives. For both perspectives, brain weight or volume is expressed as a percentage of the mean adult volume or weight (ordinate: 1g5 1cm3). The Wrst perspective is that of the full proWle of brain growth, based upon brain weights obtained at autopsy (curve). This is expressed as a continuous change with growth continuing through the fetal months and the Wrst 15 years of postnatal life. (Adapted from Lemire et al., 1975.) The second perspective is based upon volumetric analyses of magnetic resonance images of the cerebrum, the neocortex, and the cerebral central white matter taken from a crosssectional analysis in the school-age child. The mean volumes for males plus females (15 males and 15 females) over an age range of 6 to 11 years (mean age 9 years) are plotted as histograms at the average age. At school age, the overall cycle of growth is approximately 95% of the corresponding adult volume. By contrast with adults, the neocortex is a relatively greater while the cerebral central white matter is a relatively smaller percentage of the corresponding adult values. (From Caviness, V. S., Kennedy, D. N., Bates, J. F., and Makris, N. (1997). The developing human brain: a morphometric proWle. In Developmental Neuroimaging: Mapping the Development of the Brain and Behavior, eds. R. W. Thatcher, G. Reid Lyon, J. Rumsey and N. Krasnegor, pp. 3±14. San Diego, CA: Academic Press. Reprinted with kind permission of the publisher.)
mature neurons and undergoes intensive diVerentiation between 17 and 25 weeks. At that point, intensive dendritic diVerentiation of the cortical plate simultaneously occurs with the invasion of the thalamocortical Wbers of the cortical plate at 26±34 weeks, during which synapses accumulate within the cortical plate. At 27 weeks, pyramidal neurons in the future layers III and V of the cortical plate show a rapid increase in length of basal dendrites as a result of an increase in the number of bifurcations and the growth of terminal segments. In the rhesus monkey, the next rapid phase of synaptogenesis begins at 2 months before birth and ends approximately 2 months postnatally. This process of overproduction and pruning back is a consistent motif in the CNS and is very clearly demonstrated by observing the kinetics of synaptogenesis in the primary visual cortex, where synapses reach a density of about 90 synapses per 100-m by the third postnatal month. Between the ages of 2.6 and 5 years, the pruning rate peaks with a 40% loss in the density of synaptic contacts. Premature stimulation did not aVect the rate of this process and these processes, in fact, proceed in relation to the time of conception and not in relation to birth. Visual experience matures the synapses through strengthening, eliminating, or modifying existing synapses, but the growth or volume will no longer increase.
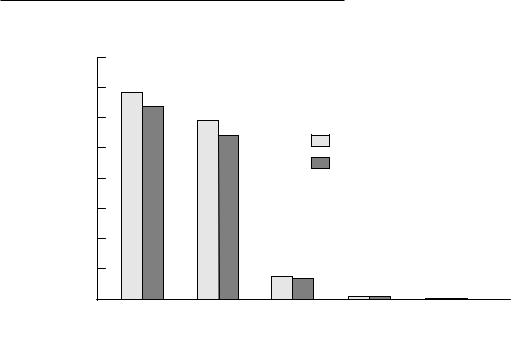
The brain develops at a roughly sigmoidal rate over a span of about 15 years (Fig. 7.7). The brain undergoes maximal growth during fetal and early postnatal life, enlarging from approximately 100g at 20 weeks of gestation to 400g at 40 weeks. The growth rate peaks perinatally at approximately 6% of the adult weight/month. There is a rapid increase in brain volume until 2 years of age and then a gradual increase until 12 years. At 18 months, brain weight is 800g, or about 60% of adult weight, and at 3 years it is 1100g or about 80% of adult weight. The brain has attained 95% maximal weight at 9 years of age and reaches an average of 1312ml at normal adult weight. Of this volume, 86% is cerebral hemispheres, 11% is cerebellum, 2% brainstem, and only 1% ventricular system (Fig. 7.8). The cerebrum is 90% of total brain volume and has a ratio of total gray matter to central white matter of 3:2. Males have a 9% larger brain volume than females (Giedd et al., 1997). When adjusted for cerebral volume, the caudate is larger in females and the globus pallidus is larger in males (Giedd et al., 1997).
Hamano et al. (1990) conducted a study of 32 neurologically normal children, seven children with mental retardation alone and 15 children with mental retardation and motor disturbance. In the neurologically normal children, head circumference and total brain volume increased from
120 M. F. Casanova, D. Buxhoeveden and G. S. Sohal
|
1600 |
|
|
|
|
|
|
1400 |
* |
|
|
|
|
|
1200 |
|
* |
|
|
|
(cc) |
1000 |
|
|
|
Male (n = 15) |
|
|
|
|
|
|
||
|
|
|
|
Female (n = 15) |
|
|
Volumes |
|
|
|
|
|
|
800 |
|
|
|
|
|
|
600 |
|
|
|
|
|
|
|
|
|
|
|
|
|
|
400 |
|
|
|
|
|
|
200 |
|
|
* |
|
|
|
|
|
|
|
|
|
|
0 |
Brain |
CER |
CBL |
BST |
VNT |
|
|
Brain regions
Fig. 7.8. Volumes of principal brain regions of the male and female school-age child. CER, cerebrum; CBL, cerebellum; BST, brainstem; and VNT, ventricular system. *SigniWcant (p #0.05). (From Caviness, V. S., Kennedy, D. N., Bates, J. F., and Makris, N. (1997). The developing human brain: a morphometric proWle. In Developmental Neuroimaging: Mapping the Development of the Brain and Behavior, eds. R. W. Thatcher, G. Reid Lyon, J. Rumsey and N. Krasnegor, pp. 3±14. San Diego, CA: Academic Press. Reprinted with kind permission of the publisher.)
723ml to 1407ml as a function of age. Actual intracranial brain volume was determined by three-dimensional computed tomographic (CT) scans. Mental retardation alone was not denoted by total brain volume. However, in 10 out of 15 children with mental retardation and motor deWcit, brain volume was under 2 SD (standard deviations) of the average for the neurologically normal children. Interestingly, only 7 of those 15 had an averaged cerebral volume (combined volume of cerebellum, midbrain, pons, and medulla) 2 SD smaller than that of the neurologically normal children. While head circumference was directly correlated with brain volume in normal children, in many children with mental retardation, head circumference was larger than indicated for their brain volume. This may have been a result of the thickening of the cranium that occurs with cerebral atrophy, and it indicates that head circumference may be insuYcient in determining brain development in terms of volume.
Reiss et al., (1996) similarly found that total cerebral volume was the signiWcant predictor in the variance of volumes of all constituent tissue and CSF variables. In this study, 79 children of normal IQ using standard cognitive testing (60 female and 19 male) were analyzed by magnetic resonance imaging (MRI). This study further elucidated a pattern of decreased ratio of gray to white matter with increased age, regardless of gender. This pattern of
increased white matter persisted throughout childhood. Their results further indicated that there was an increase in prefrontal white matter volume with increasing age in addition to the age-related changes of the total white matter. The Reiss study (1996) found no signiWcant gender- by-hemisphere-associated symmetry diVerences. However, consistent with other studies, modest but statistically signiWcant asymmetries revealed a rightward prominence of cortical and subcortical gray matter and a leftward prominence of ventricular and nonventricular CSF relative to whole brain volumes. A 7±10% greater cerebral volume in male compared to female brains has been reported in many studies, mostly contributed by increased volume of neocortex (males average greater than 700ml and females average about 680ml) and central white matter (males averaging about 460ml and females averaging 420ml). Although Reiss et al. (1996) determined that IQ is positively correlated with total cerebral volume in children, especially with the volume of cortical gray matter in the prefrontal region (prefrontal gray matter volume predicted almost 20% of the variance in IQ) and subcortical gray matter (gray matter volume predicted 15% of the variance in IQ), there was no gender associated statistical diVerences in mean ("SD) full scale IQ scores (113"15 for females and 105"17 for males).
Chugani et al. (1987) observed neurofunctional develop-
Brain development and evolution |
121 |
|
|
ment in terms of metabolism. Twenty nine children were studied with respect to developmental changes in local cerebral metabolic rates for glucose (1CMRG1u). In neonates younger than 5 weeks 1CMRG1u was highest in sensorimotor cortex, thalamus, brainstem, and the cerebellar vermis; and at 3 months, 1CMRG1u was increased in temporal, parietal, and occipital cortices, basal ganglia, and cerebellar cortex. Actual values of 1CMRG1u for various gray matter regions were low at birth, rapidly rose to reach adult values by 2 years and continued to rise until 3 or 4 years, were maintained until 9 years, then declined back to adult rates by the latter part of the second decade. The highest increases occurred in cerebral cortical structures; lesser increases were seen in subcortical structures and in the cerebellum. This timeline, of course, matches that describing the process of overproduction and subsequent elimination of excessive neurons, synapses, and dendritic spines known to occur in the developing brain.
Development of cortical gyri and sulci
The cortical surface of the adult human brain consists of a complex, yet relatively consistent, pattern of gyri and sulci. This pattern is the result of a cortical folding process that begins in the Wfth gestational month (Richman et al., 1975; Worthen et al., 1986). According to Smart and McSherry (1986a,b), the Xoors of sulci are relatively Wxed in relation to the deep surface of the cortex and to each other during the folding process. They state that gyri are formed by expansion of intersulcal tissue.
There has been debate over whether cortical folding occurs as a result of intracortical events or because of compression of the cortex by neighboring structures (Jacobson, 1991). In 1950, Barron demonstrated that cortical folding results primarily from intracortical events: after surgically isolating the developing cerebral cortex of sheep from subcortical structures in utero, the normal pattern of cortical folding was still observed. Richman et al. (1975) also have supported the idea of an intracortical mechanism. They further propose that cerebral convolutions result from mechanical stresses produced by the faster growth of the three outer cortical layers with respect to the three inner layers.
DiVerential growth rates can explain the buckling of the cortex but does not account for the relatively Wxed positions of sulci and gyri. Jacobson (1991) postulates that the geometry of dendrite growth and Wber trajectory determine the positions of sulci and gyri. This hypothesis is based on the fact that neuronal genesis and migration are completed by the Wfth gestational month and cortical folding occurs simultaneously with the growth of the den-
drites of cortical neurons (Richman et al., 1975; Jacobson, 1991).
Although the exact mechanism of cortical folding has not been elucidated, the sequential development of sulci and gyri has been well documented by several authors. Primary sulci, for example the calcarine sulcus on the medial hemispheric surface (Dorovini-Zis and Dolman, 1977; Worthen et al., 1986) are visible at 20±24 gestational weeks. The lateral sulcus appears earlier but results from gross evagination and rotation of the brain rather than from convolution of the cortical surface (Richman et al., 1975).
Secondary sulci Wrst appear at 26±28 weeks. Between 28 and 30 weeks, a growth spurt occurs with the formation of many new gyri and sulci (Dorovini-Zis and Dolman, 1977; Friede, 1989). Few convolutions develop between 30 and 40 weeks (Dorovini-Zis and Dolman, 1977). By the eighth gestational month, the precentral and postcentral gyri are prominent and all primary and secondary sulci are present (Noback and Demarest, 1981) (Table 7.1). The emergence of tertiary sulci occurs during the last two gestational months (Smith, 1974; Dorovini-Zis and Dolman, 1977; Noback and Demarest, 1981;Worthen et al. 1986; Jacobson, 1991). In the Wrst 6 months after birth, the number of tertiary convolutions increases dramatically, and the convolutional pattern reaches adult complexity at about 2 years of age (Smith, 1974). Tertiary sulcation may continue throughout life (Noback and Demarest, 1981).
Primary sulci are relatively invariant while secondary sulci show some variability even between identical twins (Noback and Demarest, 1981; Jacobson, 1991). Primary sulci include the calcarine, parieto-occipital, central, hippocampal, and cingulate sulci (Smith, 1974; Richman et al., 1975; Jacobson, 1991). Temporal and frontal sulci, as well as the precentral, postcentral, and intraparietal sulci, are considered secondary sulci (Smith, 1974; Jacobson, 1991). Individual authors diVer slightly on the classiWcation of sulci, but all generally adhere to this scheme.
Myelinogenesis
Myelinogenesis, the development of myelin sheaths in the Wbers of the nervous system, occurs gradually and at varying rates. Flechsig (1876) proposed that nerve tracts become myelinated in the order in which they become functional, and this idea is now widely accepted and supported. Myelinogenesis commences in the fourth gestational month (Lucas Keene and Hewer, 1931; Langworthy, 1933; Smith, 1974; Friede, 1989). Spinal nerve myelination is completed in the second or third year of life (Langworthy, 1933) but the process of myelination continues in the brain

122M. F. Casanova, D. Buxhoeveden and G. S. Sohal
Table 7.1. Gestational age for the appearance of sulci
|
|
Time of appearance (weeks) |
|
|
|
|
|
|
|
|
Smith |
Dorovini-Zis and |
Friede |
Noback and |
|
(1974) |
Dolman (1977) |
(1989) |
Demarest (1981) |
|
|
|
|
|
Calcarine |
24 |
22 |
24±26 |
20 |
Parieto-occipital |
24 |
22 |
|
20 |
Central |
24 |
24 |
24±26 |
20 |
Hippocampal |
24 |
|
|
|
Cingulate |
24 |
24 |
|
|
Superior temporal |
28 |
28 |
26 |
|
Superior frontal |
33 |
|
|
|
Precentral |
33 |
|
26 |
32 |
Postcentral |
33 |
24 |
26 |
32 |
Middle temporal |
33 |
|
|
|
Middle frontal |
37 |
|
|
|
Inferior temporal |
37 |
|
|
|
Intraparietal |
37 |
|
|
|
|
|
|
|
|
|
|
|
|
|
and spinal cord until puberty (Langworthy, 1933; Friede, 1989).
Myelin sheaths Wrst appear in the ventral roots of the spinal cord; this is soon followed by myelination of the dorsal roots and ventral commisure (Langworthy, 1933; Smith, 1974; Friede, 1989). The myelination process is markedly accelerated at 22±24 weeks (Lucas Keen and Hewer, 1931). By the sixth month of gestation, all cranial nerves except I (olfactory) and II (optic) show some myelination. The cuneate and spinocerebellar tracts and the descending pathways have begun myelinating by the sixth to seventh gestational months (Langworthy, 1933; Smith, 1974). Myelination in the 7-month fetus is limited to the medulla and midbrain (Langworthy, 1933).
The 8-month fetus shows little progress in myelination over the 7-month fetus, except for some myelination of the corpus striatum (Langworthy, 1933). Birth speeds the myelination process considerably (Lucas Keene and Hewer, 1931; Langworthy, 1933). At term, the optic nerve and tracts, internal capsule, medial and lateral lemnisci, ascending pathways, and thalamus all show some myelination (Lucas Keene and Hewer, 1931; Langworthy, 1933; Smith, 1974; Nelson et al., 1993). During the Wrst 6 months after birth, myelination increases rapidly in the primary projection zones. Some long association Wbers and a few short association Wbers are myelinated (Smith, 1974). Myelination of the cerebral hemispheres commences gradually during the Wrst 2 years of life (Friede, 1989). Yakovlev and Lecours (1967) state that hemispheric
myelination Wrst appears in the prepyriform cortex, subiculum of Ammon's horn, and septum pellucidum. Figure 7.9 is a generalized schedule of myelination given by Yakovlev and Lecours (1967).
MRI allows for visualization of myelogenesis and recapitulation of previous histological studies. The long T1 and T2 relaxation times of the immature brain make it necessary to use adjusted pulse sequences with a long time to repetition (TR) in order to obtain suYcient tissue contrast (van der Knaap and Valk, 1990). The technique allows the process of myelination in regions of interest to be examined. The total myelination of the brain from neonates to adulthood has been studied by three-dimensional estimations of volumes using MRI (Iwasaki et al., 1997). The results of the study suggest that the volume of the cerebral white matter increases more slowly than the total volume for the cerebral hemispheres (Iwasaki et al., 1997) (Fig. 7.10).
Neurotransmitters and hormones
During brain development, neurons are dependent on external factors for guidance and survival. These factors include biochemical inXuences such as neurotransmitters (e.g., dopamine, serotonin, acetylcholine) and steroid hormones. The mechanisms involved are complex and require appropriate spatiotemporal relationships and feedback loops. Some of these mechanisms act at a local level, while
Brain development and evolution |
123 |
|
|
(a) |
(b) |
Fig. 7.9.(a) Approximate onset of myelination in various parts of the nervous system as observed by light micrsocopy. (b) Approximate times at which myelination of the structures shown in (a) has progressed to 50% completion as observed by light microscopy. The ordinates depicts crown±heel (CH) length and the abscissae approximate ages. (Reprinted from Lemire, R., Loeser, J., Leech, R. and Alvord, E. (1975). Normal and Abnormal Development of the Human Nervous System. Harper Row, publishers, with permission.)
others result in more widespread eVects. An example of regional interactions is the eVect of glia on neurotransmitters through the production of glial-derived neurotrophic factors. Glial receptors have been involved in the development of several neurotransmitter systems, most notably the serotonergic system. In turn (depending on the target and fetal time period), the development of the neuropil, the myelination of axons, and decreases in the branching of neurites can be stimulated by neurotransmitters such as serotonin (Emerit et al., 1992). It is suggested that the earlier neurotransmitter-speciWc cells appear (e.g., cells speciWc for gamma-aminobutyric acid (GABA) before cortical plate formation), the more important is their role in organizing the cerebral cortex. Global factors such as these
neurochemical inXuences have similarly evoked long cascades of eVects that overXow into adulthood and inXuence ingrained behavioral responses. For example, although cortical development may proceed diVerently in the two sexes, levels of estrogens and androgens during brain development may be primary in determining future sexual orientation. The diVerential expression of gonadal steroid hormones during early critical periods of brain development has been linked to diVerences between the sexes in brain morphology, which are believed to be responsible for a number of behavioral diVerences. It has been shown in rats that sex diVerences in circulating androgens early after birth are responsible for sex diVerences in programmed cell death. Similarly, stress hormones (i.e., glucocorticoid