

Книги по МРТ КТ на английском языке / Functional Neuroimaging in Child Psychiatry Ernst 1 ed 2000
.pdf4 |
P. Herscovitch and M. Ernst |
|
|
|
|
Site of |
|||
|
|
annihilation |
|
||
Detector |
|
|
|
Detector |
|
Annihilation photon pathway |
|||||
|
|
|
|||
|
|
|
|||
Coincidence
circuit
Volume in which annihilation events are detected
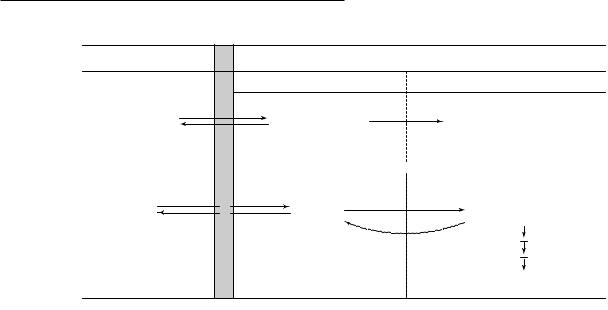
Fig. 1.1. The two high-energy photons resulting from a positron emission and annihilation are detected by two radiation detectors that are connected by an electronic coincidence circuit. A decay event is recorded as a coincidence line between the detectors only when both photons are detected almost simultaneously. A very short time window for photon arrival, typically 5±20ns, called the coincidence resolving time, is allowed for registration of a coincidence event. This coincidence requirement localizes the site of the annihilation to the volume of space between the detectors.
detectors that are arrayed around the body (or head). Because of the special nature of the positron and the techniques used for image reconstruction, it is possible to obtain absolute radioactivity measurements from these images (Daube-Witherspoon and Herscovitch, 1996).
Formation of the PET image
Certain radioactive atoms, such as oxygen-15 (15O) or Xuorine-18 (18F), decay by the emission of a positron from the nucleus. Positrons are the ªantimatterº particles to electrons; they have the same mass as electrons but are positively charged. After emission from the nucleus, positrons travel a variable distance in tissue, up to a few millimeters, losing kinetic energy. When almost at rest, they interact with atomic electrons, resulting in the ªannihilationº of both particles. Their combined mass is converted into two high-energy (511 keV each) photons that travel in opposite directions from the annihilation site at the speed of light. Detection of these photon pairs is used to measure both the location and the amount of radioactivity in the Weld of view of the scanner. The two annihilation photons are detected by two opposing radiation detectors connected by an electronic coincidence circuit (Fig. 1.1). This circuit records a decay event only when both detectors sense the almost simultaneous arrival of both photons (the time window for coincidence detection is typically 5±20ns). The site of the decay event is, therefore, localized to the volume of space between the two detectors, although there is no information about the depth or location of the radioactive source within the volume between the two detectors.
In practice, several rings, each consisting of many radiation detectors, are used. Opposing detector pairs in each
ring are connected by coincidence circuits. With each decay event, the two resulting annihilation photons are detected as a coincidence line; as a result, the number of coincidence lines sensed by any detector pair is proportional to the amount of radioactivity between them. A computer records the coincidence events from each ring. Tomographic images of the underlying distribution of radioactivity are then reconstructed with the same mathematical technique, referred to as Wltered back-pro- jection, that is used in conventional X-ray computed tomography (CT) (HoVman and Phelps, 1986). In addition to Wltered back-projection, there are other approaches to image reconstruction. These require considerably more computational time and are used much less frequently.
The intensity of each point or pixel in the reconstructed PET image is proportional to the concentration of radioactivity at the corresponding location in the brain. For the calibration of the scanner to obtain absolute radioactivity measurements, a cylinder Wlled with a uniform solution of radioactivity is imaged. The radioactivity concentration of the solution is then measured with a calibrated well counter, and the scanner calibration factor is calculated to convert PET image counts (in units of cts/s per pixel) to units of radioactivity concentration (e.g., nCi/ml).
Limitations in image quality and quanti®cation
A variety of physical eVects, such as attenuation, deadtime losses, scatter, and random coincidences, aVect the PET image and are corrected for as part of the image reconstruction process. Other factors such as image noise and spatial resolution also aVect image quality and are important considerations in the design and interpretation of PET studies (HoVman and Phelps, 1986; Karp et al., 1991; Daube-Witherspoon and Herscovitch, 1996).
Attenuation correction
A key step in image reconstruction is correction for the absorption or attenuation of annihilation photons that occurs through their interactions with tissue (Bailey, 1998). This substantially decreases the number of coincidence counts detected. Although the amount of attenuation can be estimated using an assumed value for the attenuating properties of tissue, actual measurements are more accurate. Before the administration of the radiotracer, a separate ªtransmission scanº is performed with a source of positronemitting radioactivity positioned between the subject's head and the detector rings. The outside source, Wlled with germanium-68/gallium-68 (68Ge/68Ga) radioactivity, is a ring or a rod that is rotated around the body. A similar measurement is made with nothing in the scanner Weld of view. The ratio of the two measurements gives the amount
Functional brain imaging with PET/SPECT |
5 |
|
|
of attenuation between each detector pair and is used in the image reconstruction process to correct for attenuation.
To respond to the demands of some protocols in which there is a long delay between radiotracer administration and subsequent emission scanning, techniques have been devised to calculate the attenuation correction using a transmission scan obtained after radiotracer administration, that is, with positron-emitting radioactivity still in the body (Carson et al., 1988). This approach is particularly useful when using (18F)-labeled deoxyglucose (FDG) to measure regional cerebral glucose metabolism (rCMRGlu; see below).
Image noise
The PET image has inherent statistical noise because of the random nature of radioactive decay. The disintegration rate of a radioactive sample undergoes moment-to-moment variation. The resultant uncertainty in measuring the amount of radioactivity decreases as the number of counts recorded increases. Similarly, the statistical reliability of a PET measurement depends on the number of counts. The situation is more complex, however, because the value of radioactivity in any small brain region is obtained from an image reconstructed from multiple views or projections of the radioactivity distribution throughout the entire brain slice. Therefore, the noise in any individual brain region is aVected by noise in other brain regions and tends to be greater (Budinger et al., 1978). Excessive noise gives the PET image a grainy, ªsalt and pepperº appearance and decreases the ability to quantitate radioactivity accurately.
Image noise depends upon the number of counts collected, which in turn depends upon scanner sensitivity, the duration of the scan, and the concentration of radioactivity in the Weld of view. Scanner sensitivity (measured in units of (counts/s)/(-Ci/ml)), is determined by its design features, such as the nature and arrangement of the radiation detectors. For example, the sensitivity is inversely proportional to the diameter of the detector rings. Although increasing scan duration increases counts, this is frequently not possible, either because of the short half-life of the radiotracer or because it would not be compatible with the tracer-kinetic mathematical model that is used. Administering more radioactivity increases counts, but this approach is limited by radiation safety considerations and also by the inability of tomographs to operate accurately at high count rates, that is by count rate performance.
Deadtime losses and random coincidences
Deadtime loss is the decreasing ability of a scanner to register counts as the count rate increases because of the time required by the physical processes involved in handling each count. Deadtime loss originates from limitations of the electronic circuitry used to process information from the detectors and from the recovery time of the detectors themselves. Deadtime causes a reduction in measured coincidences as radioactivity increases in the Weld of view of the scanner. This reduction can be predicted for a given count rate and a correction factor can be applied. This correction, no matter how accurate, does not compensate for the loss in statistical accuracy of the image that occurs because fewer counts were actually collected.
Random coincidences also limit count rate performance. These occur when two photons from two diVerent positron annihilations are sensed by a detector pair within the coincidence resolving time; as a result, a false or random coincidence count is collected. The fraction of total coincidences recorded that are random increases linearly with radioactivity. Random coincidences add noisy background to the image. Although corrections can be made that subtract an estimate of these false counts, the contribution to the image noise persists (HoVman et al., 1981). Therefore, for any given tomograph, the amount of radioactivity administered must be carefully selected to balance the competing eVects of improved counting statistics with the ªdiminishing returnsº resulting from deadtime and random coincidences.
Scatter
Another source of background noise in the PET image is scatter. Scatter occurs when an annihilation photon traveling in tissue is deXected in a collision with an electron and its direction changes. This results in incorrect positioning of the coincidence line. Not only is information lost from the aVected coincidence line but also a noisy background level is added to the image. This leads to an overestimation of radioactivity, especially in areas containing relatively less radioactivity, e.g., regions with low blood Xow or metabolism. The amount of scatter in an image is a function of the distribution of radioactivity, the anatomy of the tissue scattering the photons, and the design of the scanner. It is necessary to correct for scatter because it can contribute up to 20% of the counts in an image. Methods have been developed to correct for scatter that vary in their complexity and eVectiveness (Bergstrom et al., 1983; HoVman and Phelps, 1986).
Count rate performance refers to the level of radioactivity that can be accurately measured with a PET scanner. It is limited by deadtime loss and by random coincidences.
Spatial resolution
A critical issue in interpreting PET (and SPECT) images is the concept of image resolution. Image resolution is the

6P. Herscovitch and M. Ernst
minimum distance by which two points of radioactivity must be separated to be perceived independently in the reconstructed image. Limited resolution, which is visually apparent as blurring of the image, has a major eVect on the ability to quantify radioactivity accurately, especially in small structures (see below).
In PET, image resolution depends upon the accurate localization of positron-emitting nuclei. This is limited by the physics of positron annihilation and by detector design. Annihilation photons are produced only after the positron has traveled up to several millimeters from the nucleus. This limits the accuracy of localizing the nucleus. The distance the positron travels (positron range) varies and depends on the speciWc radionuclide and tissue density; it averages 1.2mm for 18F, 2.1mm for 11C. In addition, the angle between the two annihilation photons deviates slightly from 180°, causing a slight misplacement of the coincidence line (noncolinearity of the annihilation photons). These eVects result in a 1±3mm resolution loss (Phelps and HoVman, 1976) and are larger when the detectors are farther apart, as in a body scanner compared with a head scanner. Detector size and shape determine how accurately the position of each coincidence line is recorded; smaller detectors provide better resolution.
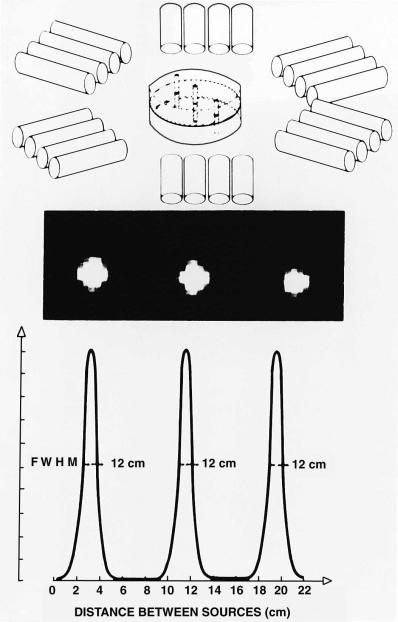
Resolution is measured by imaging a thin line source of positron-emitting radioactivity (Fig. 1.2). Because of limited resolution, the radioactivity in the source appears blurred or spread out over a large area; resolution is deWned by the amount of spreading. The resolution of current scanners is about 4±5mm in the image plane (de Grado et al., 1994; Wienhard et al., 1994).
PET Instrumentation
A PET system consists of many components (HoVman and Phelps, 1986; Council on ScientiWc AVairs, 1988; Koeppe and Hutchins, 1992). Several rings of radiation detectors are mounted in a gantry. Each detector consists of a small scintillation crystal that gives oV light when the energy of an annihilation photon is deposited in it. The detector is coupled to a photomultiplier tube that converts the light pulse to an electrical signal which is fed into the coincidence circuitry. Scanners have numerous rings, each containing up to several hundred detectors (de Grado et al., 1994; Wienhard et al., 1994), with a tomographic slice provided by each ring. In addition, ªcross-slicesº halfway between the detector rings are derived from coincidences between detectors in adjacent rings. Therefore, 47 contiguous slices can be obtained simultaneously by a 24-ring system. To date, the most sophisticated scanners have 32 rings, which permit the acquisition of 63 slices. A dedicated computer is used to control the scanning process, collect
the coincidence count information, and reconstruct and display the images.
During the scan, the subject lies on a special table that is Wtted with a head holder to restrain head movement. The gantry has low-powered lasers that project lines onto the subject's head and aid in positioning. Some gantries can be tilted from the vertical to obtain slices in speciWc planes, for example parallel to the canthomeatal line.
A relatively recent, major advance in scanner design permits coincidence counts to be collected by opposing detectors that do not have to be in the same or adjacent rings (Spinks et al., 1992; de Grado et al., 1994; Bailey et al., 1998). Because more coincidence lines are collected by this three-dimensional (3D) imaging approach, scanner sensitivity is substantially increased. This improves image quality or, alternatively, permits the same number of image counts to be obtained with less administered radioactivity. These factors are a great beneWt in pediatric imaging, in which radiation exposure is a particular consideration. The disadvantages of 3D acquisition are an increase in the amount of scatter and contribution from radioactivity outside the Weld of view (i.e., from other parts of the body) to the counts seen by the detector rings. This can be more of a problem when scanning small pediatric subjects because the rest of the body is closer to the gantry than it is in adults.
Positron-emitting radiotracers
The second requirement for PET is a radiotracer of physiologic interest that is labeled with a positron-emitting radionuclide. A radiotracer can be a naturally occurring compound in which one of the atoms is replaced with its radioactive counterpart or it can be a labeled analog which behaves in vivo similarly to the natural substance. It can also be a synthetic substance, such as a radiolabeled drug, that interacts with a speciWc biologic system.
The positron-emitting nuclides most commonly used to label PET radiotracers are 15O, 13N, 11C, and 18F with half-lives of 2.05, 10.0, 20.3, and 109.8min, respectively. (The half-life is the time required for radioactivity to decay to one-half of its original value.) The chemical nature of 15O, 13N, and 11C is identical to that of their nonradioactive counterparts, which are basic constituents of living matter as well as of most drugs. Consequently, they can be incorporated into radiotracers with the same in vivo behavior as the corresponding nonradioactive compound. Fluorine-18 is used to substitute for hydrogen or hydroxyl groups to synthesize analogs with characteristics similar to those of the unsubstituted compound. Drugs that would normally contain Xuorine can be synthesized as their 18F-labeled counterparts. Relatively large
Functional brain imaging with PET/SPECT |
7 |
|
|
Fig. 1.2. DeWnition and measurement of the resolution of a PET scanner. Thin line sources of positron-emitting radioactivity perpendicular to the image plane are scanned (upper panel). Because of resolution limitations, the radioactivity in each source appears blurred or spread over a larger area (middle panel). Scanner resolution is deWned by the amount of spreading that occurs. A plot of the image intensity along a line through the center of the images (lower panel) shows that this spreading approximates a bell-shaped or Gaussian curve. The width of this curve at one-half of its maximum height (termed the full width at half maximum, FWHM) is the measure of resolution. Here the resolution is 1.2cm. Another interpretation of the FWHM is that it is the minimum distance by which two points of radioactivity must be separated to be independently perceived in the reconstructed image. (From Ter-Pogossian et al. 1975, with permission.)

8 |
P. Herscovitch and M. Ernst |
|
|
Table 1.1. Representative PET radiotracers
Physiologic process or system |
Radiotracer |
|||
|
|
|||
Cerebral blood Xow |
H 15O |
|||
|
|
|
2 |
|
|
|
|
[15O]-Butanol; [11C]-butanol, [18F]-Xuoromethane |
|
Cerebral blood volume |
C15O; 11CO |
|||
Cerebral energy metabolism |
|
|
||
Oxygen metabolism |
15O |
2 |
||
|
|
|
|
|
Glucose metabolism |
[18F]-Fluorodeoxyglucose; [11C]-deoxyglucose, [11C]-glucose |
|||
Glucose transport |
[11C]-3-O-Methylglucose |
|||
Neuroreceptor systems |
|
|
||
Dopaminergic |
|
|
||
Presynaptic dopamine pool |
[18F]-Fluoro-L-dopa; [18F]-Xuoro-L-m-tyrosine |
|||
Dopamine D receptors |
[11C]-N-Methylspiperone; [11C]-raclopride; [18F]-spiperone; [18F]-N-methylspiperone |
|||
|
|
2 |
|
|
Dopamine D1 receptors |
[11C]-SCH23390 |
|||
Dopamine reuptake sites |
[11C]-Nomifensine; [11C]-cocaine; [18F]-labeled 1-[2-(diphenylmethoxy)ethyl]-4- |
|||
|
|
|
(3-phenyl-2-propenyl)piperazine ([18F]-GBR) |
|
Opiate |
|
|
[11C]-Carfentanil; [11C]-diprenorphine, [18F]-cyclofoxy |
|
Benzodiazepine |
[11C]-Flumazenil |
|||
Serotonergic (5-HT) |
|
|
||
Presynaptic serotonin pool |
[11C]-'-Methyltryptophan |
|||
5-HT |
1A |
receptors |
[11C]-WAY100,635 |
|
|
|
|
|
|
5-HT |
2A |
receptors |
[11C]-MDL100,907; [18F]-altanserin; [18F]-setoperone |
|
|
|
|
|
|
5-HT reuptake sites |
[11C]-McN5652 |
|||
Monoamine oxidase B |
[11C]-Deprenyl |
|||
Amino acid transport, protein synthesis |
[11C]-Methionine; [11C]-leucine; [11C]-tyrosine |
|||
Tissue pH |
|
|
11CO2; [11C]-Dimethadione |
|
Tissue drug kinetics |
[11C]-Phenytoin; [11C]-valproate; [13N]-carmustine (BCNU) |
|||
|
|
|
|
|
|
|
|
|
|
Note: This is a partial listing of radiotracers that have been used to study physiologic processes or systems in the brain with PET. The most commonly used radiotracer methods are those to measure regional cerebral blood Xow and metabolism.
amounts of these radionuclides with short half-lives can be administered to provide good-quality images with acceptable radiation exposure because of their rapid decay. The short half-lives, especially of 15O, permit repeat studies in the same subject in one experimental session because of the rapid physical decay after each administration.
The disadvantage of these short half-lives is that the synthesis of PET radiotracers is demanding. On-site production of radionuclides by means of a cyclotron is required (Wolf and Schlyer, 1993), and rapid techniques must be devised for radiotracer synthesis and quality control. These must yield products that are pure, sterile, and nontoxic. The tracer must have the appropriate properties to permit the desired physiologic measurement to be made (Kilbourn, 1991; Dannals et al., 1993). Important factors include its permeability across the blood±brain
barrier, the formation and fate of any radioactive metabolites, the ability to develop a mathematical model to describe the behavior of the tracer, and, for neuroreceptor ligands, the binding characteristics. Preclinical studies are typically performed, using tissue sampling or autoradiography in small animals and PET studies in large ones. The recent development of PET scanners designed to image small animals (e.g., rat), should facilitate the preclinical assessment of new PET tracers (Cherry et al., 1998). A wide variety of positron-emitting radiopharmaceuticals has been synthesized (Table 1.1) (Fowler and Wolf, 1991).
Radiotracer modeling
A mathematical model is required to calculate the value of the physiologic variable of interest from measurements of
Functional brain imaging with PET/SPECT |
9 |
|
|
radiotracer concentration in brain and blood. The model describes the in vivo behavior of the radiotracer, that is the relationship over time between the amount of tracer delivered to a brain region in its arterial input and the amount of tracer in the region. The use of models allows PET to be a quantitative physiological technique rather than only an imaging modality (Huang and Phelps, 1986; Carson, 1991, 1996). Compartmental models are typically used. It is assumed that there are entities called compartments that have uniform biologic properties and in which the tracer concentration is uniform at any instant in time. The compartments can be physical spaces such as the extravascular space, or biochemical entities such as neu- roreceptor-binding sites. The model is described by one or more equations, that contain measurable terms (i.e., the brain and blood radiotracer concentrations over time) and unknowns such as blood Xow or receptor concentration that are of interest.
Several factors must be considered in developing a model. These include tracer transport across the blood±brain barrier, the behavior of the tracer in brain, the presence of labeled metabolites in blood, the potential for alterations in tracer behavior if there is pathology, and the ability to solve the model accurately for the unknown parameters. Error analysis and model validation are important. Error analysis consists of mathematical simulations to determine the sensitivity of the model to potential sources of measurement error. Validation experiments are usually performed to demonstrate that the method provides reproducible, accurate, and biologically meaningful measurements.
This chapter will describe the PET methods used to measure rCBF and cerebral blood volume (rCBV) and glucose and oxygen metabolism. Measurements of CBF glucose metabolism are widely used as indices of neuronal activity (see below). In addition, SPECT tracer methods for assessing cerebral perfusion will be discussed.
PET radiotracer techniques
Cerebral glucose metabolism
The measurement of rCMRGlu utilizes FDG. The approach is based on the technique used to measure rCMRGlu in laboratory animals with [14C]-deoxyglucose and tissue autoradiography (SokoloV et al., 1977) and adapted for PET by using 18F as the label (Phelps et al., 1979; Reivich et al., 1979; Huang et al., 1980). FDG is a glucose analog in which a hydroxyl group has been replaced with an 18F atom. FDG is transported across the blood±brain barrier and is phosphorylated in tissue, as is glucose, by hexokinase to form FDG 6-phosphate (FDG-6-P). Because of its anomalous struc-
ture, however, FDG-6-P cannot proceed further along the glucose metabolic pathway. Also, there is little dephosphorylation of FDG-6-P back to FDG. As a result of this ªmetabolic trappingº, there is negligible loss of FDG-6-P. This facilitates the calculation of rCMRGlu from measurements of local tissue radioactivity. SokoloV's three-com- partment model applied to FDG consists of plasma FDG in brain capillaries, free FDG in tissue, and FDG-6-P in tissue (Fig. 1.3a). Rate constants describe the movement of tracer between these compartments. An operational equation permits the calculation of rCMRGlu from the tissue radioactivity concentration, the arterial plasma concentration of FDG over time, and the plasma glucose concentration (Fig. 1.3b). The equation also contains the rate constants and a factor termed the lumped constant (LC). The LC corrects for the diVerences between glucose and FDG in blood±brain barrier transport and in phosphorylation. Neither the rate constants nor the LC can be routinely determined for each experimental subject or condition. It was found possible, however, to use standard values that can be determined once in separate groups of normal subjects.
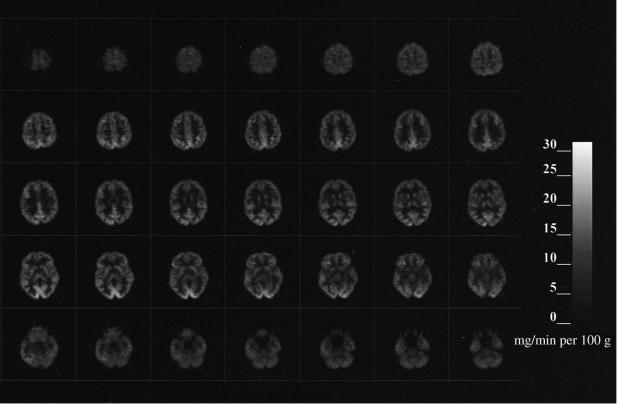
To implement the method, images are obtained starting 30±45min after intravenous injection of 5±10mCi FDG. Blood is sampled to measure the concentrations of glucose and FDG in plasma over time. The operational equation with standard values for the rate constants and LC is used to generate images of rCMRGlu (Fig. 1.4). Typical normal values of rCMRGlu are 6±7 and 2.5±3mg/min per g tissue in gray and white matter, respectively. (Sasaki et al., 1986; Hatazawa et al., 1988; Tyler et al., 1988; Camargo et al., 1992).
Measurements of rCMRGlu with FDG reXect the state of the subject primarily during the Wrst 10±20min after tracer injection (Huang et al., 1981). This means that if a challenge is used, such as cognitive, motor, or pharmacologic activation, it must start slightly before FDG injection and continue for some time. If unwanted subject activity occurs during tracer uptake, such as anxiety or Wdgeting, it will aVect the results particularly if it occurs during the Wrst 10±20min.
The accuracy of using standard values for the rate constants and LC has been the subject of considerable discussion (Cunningham and Cremer, 1985; Baron et al., 1989). Their values may change in the presence of pathology, and the use of incorrect values results in inaccurate rCMRGlu calculations (SokoloV et al., 1977; SokoloV, 1985). Because the terms in the operational equation containing rate constants approach zero with increasing time (see Fig. 1.3b), a delay of 30±45min between FDG injection and PET imaging is used to minimize the error associated with using standard values. There can still be substantial error
10 P. Herscovitch and M. Ernst
(a) |
PLASMA |
|
|
|
|
BRAIN TISSUE |
|
|
|
|
|
|
|
|
|
|
|
|
|
||
|
|
|
|
|
Precursor pool |
|
|
Metabolic products |
||
[ |
14 |
|
|
K1* |
14 |
K3* |
[ |
14 |
|
|
C]-Deoxyglucose |
|
|
[ |
|
C]-Deoxyglucose 6-phosphate |
|||||
|
(Cp*) |
|
|
C]-Deoxyglucose |
|
|
|
|
* |
|
|
|
BRAIN BARRIER |
K2* |
(CE*) |
|
|
|
(CM) |
||
|
|
|
|
|
|
|
|
|||
|
|
|
|
TOTAL TISSUE 14C CONCENTRATION = C * = C * |
+ C * |
|||||
|
|
|
|
|
|
|
i |
E |
M |
|
|
Glucose |
K1 |
|
Glucose |
K3 |
|
Glucose 6-phosphate |
|||
|
(Cp) |
|
± |
|
(CE) |
|
|
|
(CM) |
|
|
K2 |
BLOOD |
|
|
|
|
||||
|
|
|
|
|
|
|
|
|
|
|
|
|
|
|
|
|
|
|
CO2 + H2O |
||
(b) |
|
|
Tissue radioactivity at time T ± Free DG in tissue at time T |
|||||||||
rCMRGlu = |
Plasma glucose |
|
||||||||||
Lumped constant |
|
Total amount of FDG entering tissue |
||||||||||
|
|
|||||||||||
|
|
|
|
|
|
|
|
T |
* |
|
|
|
|
|
|
|
* |
* |
* |
ò |
* |
* |
|
||
|
|
Cp |
|
C (T ) ± k1 exp[±(k2 |
+ k3)T ] |
Cp(t )exp[k2 |
+ k3)t ] dt |
|||||
= |
|
|
|
|
|
0 |
|
|
|
|
||
|
LC |
T |
|
|
T |
|
|
|
|
|||
|
òCp*(t )dt ± exp[±(k2*+ k3*)T ] ò Cp*(t )exp[(k*2 + k*3)t ] dt |
|||||||||||
|
|
|
|
0 |
|
|
|
0 |
|
|
|
|
Fig. 1.3. Measurement of regional cerebral glucose metabolism (rCMRGlu) using deoxyglucose (DG) labeled with 18F (FDG). (a) The SokoloV three-compartment model used to measure rCMRGlu with DG. The compartments consist of DG in the plasma in brain capillaries, DG in brain tissue, and DG 6-phosphate (DG-6-P) in tissue. Rate constants describe the movement of tracer between compartments, two for the bidirectional transport of DG across the blood±brain barrier between plasma and tissue (k1*, k2*), and one for the phosphorylation of DG to DG-6-P (k3*). In the adaptation of this model to PET, FDG is used and a fourth rate constant, k4*, is added to account for the small amount of dephosphorylation of FDG-6-P back to FDG. (From SokoloV, 1977, with permission.) (b) The operational equation of the DG method. The equation in words aids in understanding the model. The terms that are measured are C(T), the tissue radioactivity concentration at time T, typically 30±45min after DG administration; Cp*(t), the plasma DG concentration over time; and Cp, the plasma glucose concentration. The concentration of free DG in tissue at time T is calculated from [Cp* (t)] and the rate constants. The diVerence between the two terms in the numerator is the concentration of DG-6-P that has been formed. The denominator equals the amount of DG delivered to tissue. Therefore, the ratio on the right-hand side is the fractional rate of phosphorylation of DG. Multiplying this ratio by Cp would give the rate of glucose phosphorylation if DG and glucose had the same behavior. Because this is not the case, the lumped constant (LC) is included to account for the diVerence. The adaptation of this equation to PET using FDG is more complex because of the inclusion of a fourth rate constant, k4*.
in the presence of cerebral ischemia or a tumor, however (Wienhard et al., 1985; Nakai et al., 1987; Graham et al., 1989). Several investigators reformulated the operational equation to decrease its sensitivity to the rate constants and have reWned the methods to measure them from sequential PET images (Brooks, 1982; Lammertsma et al., 1987).
The LC is assumed to be uniform and constant throughout brain under normal physiologic conditions, based on theoretical arguments. Originally, the value for the LC in
humans was selected so that the average whole brain CMRGlu measured with FDG would equal that determined by earlier investigators with the more invasive Kety±Schmidt technique (Phelps et al., 1979). It is possible to measure the LC of whole human brain from the ratio of the brain arteriovenous extraction fraction of FDG to that of glucose (Reivich et al., 1985). A recent study (Hasselbalch et al., 1998) in which great care was taken in the methodologic aspects of the measurement obtained a value for the LC in normal subjects of 0.81, higher than the
Functional brain imaging with PET/SPECT |
11 |
|
|
Fig. 1.4. Cerebral glucose metabolic rates. Quantitative images obtained in a normal subject with [18F]-Xuorodeoxyglucose and application of SokoloV's model. Anterior is up and left is to the reader's left. These images start at the level of the superior cortical level (upper left) and proceed down through the brain to the level of the cerebellum. Note the bar scale at the right indicating the correspondence between glucose metabolic rates and gray levels in the image.
values of 0.42±0.52 used in earlier work. The LC does change in pathologic conditions such as acute cerebral ischemia, recent cerebral infarction, and brain tumor (Gjedde et al., 1985; Nakai et al., 1987; Spence et al., 1990; Greenberg et al., 1992). Since calculated rCMRGlu is inversely proportional to the LC (see Fig. 1.3), the use of an incorrect value leads to a corresponding error in the calculation. Consequently, it is necessary to redetermine both the LC and the rate constants to avoid such errors in pathologic conditions where there is a gross abnormality of tissue or an imbalance between glucose supply and demand. This is diYcult and has been rarely done in PET studies.
An alternative approach to measure rCMRGlu uses [11C]- glucose, which is transported and metabolized in the same way as glucose (Blomqvist et al., 1990). As a result, the compartmental model does not require a LC correction factor. A disadvantage is that the labeled metabolites of glucose, such as 11CO2, are not all trapped in tissue and the model must account for their egress. [11C]-Glucose may be
more widely used in the future, especially in pathologic conditions. For example, it has been recently used to measure cerebral glucose transport and metabolism in preterm infants (Powers et al., 1998).
Cerebral blood volume
Measurement of rCBV uses trace amounts of 11CO or C15O administered by inhalation (Grubb et al., 1978; Martin et al., 1987). The tracer binds to hemoglobin and is con®ned to the intravascular space. Local radioactivity in brain is proportional to its red cell content; consequently, rCBV can be calculated from the ratio of the radioactivity in brain to that in peripheral blood. However, the hematocrit is less in brain than in peripheral large vessels owing to the behavior of blood in the brain microvasculature, and the ratio of cerebral hematocrit to peripheral hematocrit (R) must be incorporated into the calculation (Grubb et al., 1978; Lammertsma et al., 1984; Martin et al., 1987). Equation (1.1), or a modi®cation (Videen et al., 1987), is used to calculate rCBV in units of milliliters per 100g

12 P. Herscovitch and M. Ernst
tissue, from the radiotracer concentrations in tissue (Ct) and blood (Cbl):
Ct |
|
rCBV 5 CblR |
(1.1) |
The use of C15O has practical advantages over 11CO (Martin et al., 1987). The 2min half-life of 15O permits other PET studies to be performed with little delay and lowers radiation exposure, and the synthesis is more convenient. Normal values for rCBV are 4±6ml/100g in gray matter and 2±3ml/100g in white matter (Lammertsma et al., 1983; Perlmutter et al., 1987).
In cerebrovascular disease, rCBV reXects vasodilatation in response to decreased cerebral perfusion pressure, as may occur with a narrowed internal carotid artery (Powers, 1991; Heiss and Podreka, 1993). Changes in rCBV can also be seen with elevated intracranial pressure (Grubb et al., 1975). In addition, rCBV data may be required as part of other PET methods (e.g., the measurement of cerebral oxygen metabolism and extraction fraction or some neuroreceptor studies) to correct for radiotracer located in the intravascular space so as to determine the amount of radiotracer that actually enters tissue. Measurement of rCBV has recently been used to determine the vascular response to focal brain activation (Wang et al., 1998).
Cerebral blood ¯ow
Methods to measure rCBF with PET are based on a model developed by Kety to measure rCBF in laboratory animals (Kety, 1951; Landau et al., 1955). The model describes inert tracers that can diVuse freely across the blood±brain barrier. The technique involves infusing a radioactive tracer over a brief time period T, often 1min. Frequent timed blood samples are obtained during the infusion to determine the arterial time±radioactivity curve Ca(t). The animal is then killed. Regional brain radioactivity at the end of the infusion, Ct(T), is measured by quantitative tissue autoradiography. Tissue blood Xow f (units of ml/min per 100g) is calculated from these measurements using Eq. (1.2):
T |
|
Ct(T )5 f E Ca(t)exp[2f/l(T2 t)]dt |
(1.2) |
0 |
|
Where l is the brain±blood partition coeYcient for the tracer deWned as the ratio between the tissue and blood radiotracer concentrations when they are in equilibrium. Its value can be determined from independent experiments or can be calculated as the ratio of the solubilities of the tracer in brain and blood (Kety, 1951; Herscovitch and Raichle, 1985). Equation (1.2) is solved numerically for Xow, using measured values for Ct(T) and Ca(t), and a speciWed value for l.
Kety's method is the basis for methods to measure rCBF with PET. Although there are diVerent approaches, they all involve administering a diVusible, positron-emitting radiotracer, blood sampling to determine the time±activity curve in arterial blood (typically from the radial artery), and the application of a modiWcation of Eq. (1.2) to generate images of rCBF from PET images of radioactivity. The tracer most commonly used is [15O]-water (H215O) administered by intravenous injection. Because of the short halflife of 15O, repeat measurements can be performed within 10±12min.
The steady-state method was the earliest widely used PET method to measure rCBF (Subramanyam et al., 1978; Frackowiak et al., 1980). The subject inhales C15O2 delivered at a Wxed rate. The action of carbonic anhydrase in red blood cells results in transfer of 15O to water and the H215O constantly generated in the lungs circulates throughout the body. A steady state is reached in which radioactivity delivered to brain tissue equals that leaving by decay and by venous washout. The brain distribution of radioactivity remains constant, and a simple equation can be used to calculate rCBF. This method was convenient with the early, single-ring tomographs, since multiple tomographic slices could be obtained by repositioning the patient during C15O2 inhalation. A limitation is the nonlinear relationship between rCBF and tissue radioactivity, which increases the sensitivity of the CBF calculation to errors in measured tissue and blood radioactivity (Lammertsma et al., 1981; Herscovitch and Raichle, 1983; Baron et al., 1989). Because of this, the long period required for CBF measurement, and the development of multislice scanners, the steadystate method has been largely supplanted.
Alternative approaches use bolus intravenous injections of H215O and an adaptation of Kety's equation. Equation (1.2) is not used directly because scanners cannot measure the instantaneous brain radiotracer concentration Ct(T). It has been modiWed in diVerent ways to allow for performance of the scans over many seconds, summing enough counts to obtain satisfactory images. With the PET/autoradiographic approach, H215O is administered by bolus intravenous injection, and a 40 s scan is obtained after the radiotracer arrives in the head (Herscovitch et al., 1983; Raichle et al., 1983). The relationship between tissue counts and rCBF is almost linear and errors in measurement of tissue radioactivity result in approximately equivalent errors in calculated rCBF. Because the PET image obtained with a brief scan (1min or less) closely reXects Xow diVerences in diVerent brain regions, useful information about relative CBF can be obtained without blood sampling. This approach is widely used in functional brain mapping experiments, in which H215O images are used to

Functional brain imaging with PET/SPECT |
13 |
|
|
determine relative rCBF changes during neurobehavioral tasks (Frackowiak and Friston, 1994). Average values for rCBF in normal subjects obtained with either the steadystate method (Leenders et al., 1990) or the PET/autoradiographic method (Herscovitch et al., 1987; Perlmutter et al., 1987) are 40±60ml/min per 100g in gray matter and 20±30 ml/per 100g in white matter.
There are other methods for measuring rCBF based on the Kety model. One approach involves collecting several sequential, brief images after bolus intravenous administration of tracer (Koeppe et al., 1985). Parameter estimation techniques are used to estimate both rCBF and l from the scan and blood radioactivity data. To simplify blood sampling for these H215O rCBF techniques, automated systems have been designed to withdraw arterial blood continuously past a radiation detector (Eriksson et al., 1988).
Methods using H215O assume that it is freely diVusible across the blood±brain barrier. However, there is a modest diVusion limitation, which results in an underestimation of rCBF at higher Xows (Raichle et al., 1983). There are other tracers without a diVusion limitation, such as [11C]- or [15O]-butanol (Herscovitch et al., 1987; Berridge et al., 1991). The diVusion limitation of H215O is accepted, however, because of the tracer's convenience. Also, in conditions with decreased rCBF, tracer diVusion limitation is less important.
Cerebral oxygen metabolism
The regional cerebral metabolic rate of oxygen (rCMRO2), which is more complex to obtain than cerebral glucose metabolism, is not widely used in research in pediatric disorders. It is measured using inhaled 15O2. One method developed in conjunction with the steady-state rCBF technique uses continuous inhalation of 15O2 (Subramanyam et al., 1978; Frackowiak et al., 1980). Another, a companion to the PET/autoradiographic rCBF method, uses a brief inhalation of 15O2 (Mintun et al., 1984). The principles underlying these methods are similar. Approximately 35±40% of the oxygen delivered to the brain is extracted and metabolized (Perlmutter et al., 1987; Leenders et al., 1990). Both methods measure this oxygen extraction fraction (OEF). There are essentially no stores of oxygen in brain, and all extracted oxygen is metabolized. Therefore, rCMRO2 can be determined from the product of OEF and the rate of oxygen delivery to brain, which equals rCBF multiplied by arterial oxygen content. The tracer models describe the fate of the 15O label following 15O2 inhalation. Extracted 15O2 is metabolized to H215O, which is then washed out of brain. The H215O that is produced by brain as well as by the rest of the body recirculates to brain and
diVuses into and out of brain tissue. Another component of the measured radioactivity is intravascular 15O2 that is not extracted by brain. It is necessary to account for this component so that it is not attributed to radioactivity in tissue. Therefore, an independent measurement of rCBV is needed. Both PET methods require three scans to measure regional oxygen extraction fraction (rOEF) and rCMRO2: an rCBF scan, an rCBV scan, and a scan obtained with 15O2.
With the steady-state method, scanning is performed during continuous inhalation of 15O2 and rCBF is measured with continuous inhalation of C15O2 and rCBV with C15O. The rOEF is computed from these scans and from measurements of blood radioactivity (Lammertsma et al., 1983). An alternative method for measuring rOEF and rCMRO2 uses a brief inhalation of 15O2 (Mintun et al., 1984; Videen et al., 1987). A 40 s scan is obtained following 15O2 inhalation, and frequent arterial blood samples are collected for measurements of blood radioactivity. It also involves measurement of rCBF with H215O and the PET/autoradiographic method, and of rCBV with C15O. The method was validated in baboons in a series of experiments that included very reduced rCMRO2 (Mintun et al., 1984; Altman et al., 1991). A diVerent approach has been described to measure rCMRO2 that involves dynamic scanning (i.e., obtaining multiple short scans over time) following only one brief inhalation of 15O2 (Ohta et al., 1992). Average normal values for gray matter rCMRO2 are 2.5±3.5 ml/min per 100g (Perlmutter et al., 1987; Leenders et al., 1990).
Single photon emission computed tomography
Principles
The radionuclides used in SPECT decay by emitting a single photon or gamma ray from their nucleus; radioactivity distribution is estimated by detection of gamma rays. The most commonly used SPECT systems have one or more gamma camera ªheadsº (Devous et al., 1986; George et al., 1991; Holman and Devous, 1992; Masdeu et al., 1994; Devous, 1995). The gamma camera head has a large, relatively thin (e.g., 3/8 in by 12±20 in (0.96cm by 30±50cm) diameter) scintillation crystal of sodium iodide, which gives oV a localized pulse of light when it absorbs a gamma ray. The front of the crystal is covered with a parallel-hole collimator, which is typically made up of lead perforated by an array of small hexagonal holes. The collimator limits the gamma rays that strike the crystal to those traveling along parallel lines perpendicular to the crystal face. An array of photomultiplier tubes and position logic circuits behind