

NUCLEAR POWER PLANTS
.pdfCross-Flow-Induced-Vibrations in Heat Exchanger Tube Bundles: A Review |
85 |
|
4.4 |
|
|
|
|
|
|
|
|
|
|
|
|
4.2 |
|
|
|
|
|
|
|
|
U |
T |
|
|
|
|
|
|
|
|
|
|
|
|
||
|
4.0 |
|
|
|
|
|
|
|
|
|
|
|
|
|
|
|
|
|
|
|
|
|
|
L |
|
|
3.8 |
|
|
|
|
|
|
|
|
|
|
|
|
|
|
|
|
|
|
|
|
|
|
|
|
|
3.6 |
|
|
0.22 |
|
|
|
|
|
|
D |
|
|
3.4 |
|
|
|
|
|
|
|
|
|
||
|
|
|
|
|
|
|
|
|
|
|
|
|
|
3.2 |
0.15 |
|
|
|
|
|
|
|
|
|
|
|
3.0 |
|
|
|
|
|
0.18 |
0.22 |
|
0.20 |
|
|
|
2.8 |
|
|
|
|
|
|
|
|
|
|
|
T |
|
|
|
|
|
|
|
|
|
|
|
|
2.6 |
|
|
|
|
|
|
|
|
|
|
|
|
D |
|
|
|
|
|
|
|
|
|
|
|
|
|
2.4 |
|
|
|
|
|
|
|
|
|
|
|
|
2.2 |
|
|
|
|
|
|
|
|
|
|
|
|
2.0 |
|
0.26 |
|
|
|
|
|
|
|
|
|
|
1.8 |
|
|
|
0.15 |
|
|
0.15 |
|
|
|
|
|
1.6 |
|
0.31 |
|
|
|
|
|
|
|
|
|
|
|
|
|
|
|
|
|
|
|
|
||
|
1.4 |
0.18 |
0.32 |
|
|
|
|
|
|
|
|
|
|
1.2 |
|
|
|
|
|
|
0.10 |
|
|
||
|
|
|
|
|
|
|
|
|
|
|||
|
|
|
|
|
|
|
|
|
|
|
|
|
|
1.0 |
|
|
|
|
|
|
|
|
|
|
|
|
0.8 |
1.2 |
1.6 |
2.0 |
2.4 |
2.8 |
3.2 |
3.6 |
4.0 |
|
4.4 |
4.8 |
L
D
Fig. 6. Strouhal numbers for in-line tube banks (Karaman, 1912).
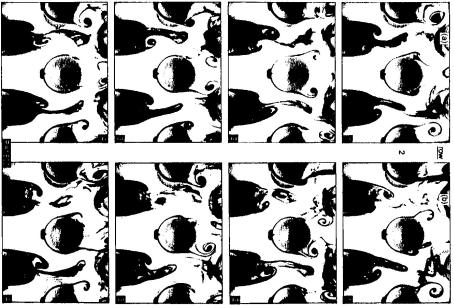
(Oengoren and Ziada, 1992) have investigated the coupling between the acoustic mode and vortex shedding, which may occur near the condition of frequency coincidence. They have investigated the system response both in the absence and in the presence of a splitter plate, installed at the mid-height of the bundle to double the acoustic resonance frequencies and therefore double the Reynolds number at which frequency coincidence occurs. They have also investigated the effect of row number on vortex shedding and have carried out flow visualization in Reynolds number range of ≤ 355000. Figure 7 is a typical example of the mechanism of vortex shedding from the tubes of the first two rows displaying a time series of symmetric and anti-symmetric patterns (Oengoren & Ziada, 1993).
(Liang et al., 2009) has addressed numerically the effect of tube spacing on vortex shedding characteristics of laminar flow past an inline tube arrays. The study employs a six row in-
line tube bank for eight pitch to diameter ( |
) ratios with Navier-Strokes continuity |
equation based unstructured code (validated for the case of flow past two tandem cylinders) (Axisa & Izquierdo, 1992) . A critical spacing range between 3.0 and 3.6 is identified at which mean drag as well as rms lift and drag coefficients for last three cylinders attain maximum values. Also at critical spacing, there is 180o phase difference in the shedding cycle between successive cylinders and the vortices travel a distance twice the tube spacing within one period of shedding.
(Williamson & Govardhan, 2008) have reviewed and summarized the fundamental results and discoveries related to vortex induced vibrations with particular emphasis to vortex dynamics and energy transfer which give rise to the mode of vibrations. The importance of mass and damping and the concept of “critical mass”, “effective elasticity” and the relationship between force and vorticity. With reference to critical mass, it is concluded that
86 |
Nuclear Power Plants |
as the structural mass decreases, so the regime of velocity (non-dimensional) over which there is large amplitude of vibrations increases. The synchronizing regime become infinitely wide not simply when mass become zero but when a mass falls below special critical value when the numerical value depends upon the vibrating body shape.
(a)
(b)
Fig. 7. Time sequence of the two transient modes of vortex shedding, (a) symmetric and (b) anti-symmetric, behind the first two rows of the intermediate spacing array (Leinhard, 1966).
(Williamson & Govardhan, 2000) present a large data set for the low branch frequencyplotted versus (mass ratio) yielding a good collapse of data on to single curve base
equation 7.
= |
|
(7) |
|
. |
|||
|
|
This equation provides a practical and simple means to calculate the frequency attained by vortex induced vibrations. The critical mass ratio is given by
= 0.54 ±0.002 |
(8) |
Below which the lower branch of response can never be attained. With respect to combine mass-damping parameter’s capability to reasonably collapse peak amplitude data in Griffins plot, a number of parameters like stability parameter, Scrutom number and combined response parameter termed as Skop-Griffins parameter given by (SG):
= 2 ( ) |
(9) |
Cross-Flow-Induced-Vibrations in Heat Exchanger Tube Bundles: A Review |
87 |
Where S stands for single vortices and Sc is the Scruton number.
(Hamakawa & Matsue, 2008) focused on relation between vortex shedding and acoustic resonance in a model (boiler plant) for tube banks to clarify the interactive characteristics of vortex shedding and acoustic resonance. Periodic velocity fluctuation due to vortex shedding was noticed inside the tube banks at the Reynolds number (1100-10000) without acoustic resonance and natural vortex shedding frequency of low gap velocities. Kumar et al., 2008 in their review stated that controlling or suppressing vortex induced vibrations is of importance in practical applications where active or passive control could be applied.
(Paidoussis, 2006) specially addressed real life experiences in vortex induced vibrations and concludes with this mechanism in addition of other already clarified mechanisms of flow induced vibrations. Vortex induced vibrations of ICI nozzles and guide tubes in PWR for ICI thimble guiding into the core of the reactor to monitor reactivity may witness breakage of ICI nozzles resulting in strange noises experience in the reactor. Analysis of shedding frequencies confirmed the vortex induced vibrations to be the culprit partially due to the large values of varying lift coefficients and partially due to lock-in.
(Hamakawa & Fukano, 2006) also focused vortex shedding in relation with the acoustic resonance in staggered tube banks and observe three Strouhal number (0.29, 0.22 and 0.19). In cases with no resonance inside tube banks, the last rows of tube banks and in both regimes respectively. The vortices of 0.29 and 0.22 components alternatively irregularly originated.
(Pettigrew & Taylor, 2003) discussed and overviewed procedures and recommended design guidelines for periodic wave shedding in addition to other flow induced vibration considerations for shell and tube heat exchangers. It concludes that the fluctuating forces due to periodic wave shedding depends on the number of considerations like geometric configuration of tube bundles, its location, Reynolds number, turbulence, density of fluid
and pitch to diameter |
ratio. |
2.4 Turbulence excitation
Extremely turbulent flow of the shell-side fluid contains a wide spectrum of frequencies distributed around a central dominant frequency, which increases as the cross-flow velocity increases. This turbulence buffets the tubes, which extract energy from the turbulence at their natural frequency from the spectrum of frequencies present. When the dominant frequency for the turbulent buffeting matches the natural frequency, a considerable transfer of energy is possible leading to significant vibration amplitudes (Chenoweth, 1993). Turbulent flow is characterized by random fluctuation in the fluid velocity and by intense mixing of the fluid. Nuclear fuel bundles and pressurized water reactor (PWR) steam generators are existing examples (Hassan & Ibrahim, 1997).
Turbulence is by nature three-dimensional (Au-Yang, 2000). Large-Eddy Simulation, (LES) incorporated in three-dimensional computer codes has become one of the promising techniques to estimate flow turbulence. (Hassan & Ibrahim, 1997) & (Davis & Hassan, 1993) have carried out Large Eddy Simulation for turbulence prediction in two-and threedimensional flows. The primary concern in turbulence measurements is how the energy spectrum or the power spectral density (PSD) of the eddies are distributed. The PSD of the

88 |
Nuclear Power Plants |
velocity profile E(n) is numerically equal to the square of the Fourier Transform of U (t) , and is defined to be (Hassan & Ibrahim, 1997).
|
|
|
U 2 |
E(n)dn |
(10) |
where E(n) is the sum of power at positive and negative frequency n .
E(n) |
4 2 |
|
a(n) |
|
2 |
(11) |
|
|
|||||
|
T |
|||||
|
|
|
||||
where T is the time period over which integration is performed, and a(n) is the Fourier Transform coefficient.
An important parameter of flow turbulence is the correlation function. The Lagrangian (temporal) auto-correlation over a time T gives the length of time (past history) that is related to a given event (Hassan & Ibrahim, 1997).
(Non-dimensional) R( ) |
|
U (t)U (t ) |
|
|
(12a) |
||||
|
|
|
|
|
|
|
|||
|
|
|
|
U (t)U (t) |
|
|
|
||
|
1 |
t T |
|
||||||
(Dimensional) R( ) lim |
U (t)U (t )dt |
(12b) |
|||||||
T |
|||||||||
|
t 0 |
|
|||||||
|
|
|
|
||||||
Physically R( ) represents the average of the product of fluctuating velocity U values at a given time and at a time later. R( ) gives information about whether and for how long the instantaneous value of U depends on its previous values. Cross-correlation curves can also be obtained as a function of the time delay to give the correlation between the velocities at consecutive separated location points (Owen, 1965).
R |
( ) |
1 t T |
U / |
(t)U / (t )dt |
(13) |
||
|
|
||||||
T |
|||||||
12 |
|
1 |
2 |
|
|||
|
|
|
|
||||
t 0
where R12 gives the cross-correlation of the U-velocity component at 1- and 2- point locations.
Recently (Au-Yang, 2000) has reviewed the acceptance integral method to estimate the random vibration, Root Mean Square (RMS) of structures subjected to turbulent flow (random forcing function). The acceptance integral is given by:
J |
|
( ) |
1 |
|
|
|
(x ) S |
|
(x , x , ) / S |
|
(x , ) |
|
|
(x )dx dx |
(14) |
|
|
0 |
0 |
p |
p |
|
|||||||||
|
|
|
|
|
|
|
|
|
|
||||||
|
|
|
|
|
|
|
|
|
|
|
|
|
|
|
When , J is known as joint acceptance
where
Cross-Flow-Induced-Vibrations in Heat Exchanger Tube Bundles: A Review |
89 |
||
J |
= |
Joint acceptance for th mode |
|
J |
= |
Cross-acceptance |
|
|
= |
Surface of 2-D structure of length of 1-D structure |
|
x |
= |
Position vector |
|
Sp |
= |
Double sided pressure power spectral density. |
|
|
= |
Mode shape function |
|
|
|
|
|
|
= |
Mode shape function |
|
|
= |
Frequency |
|
, |
= |
Modal indices |
|
Yang obtained closed form solutions for the joint acceptances for two special cases of springsupported and simply-supported beams. A review of turbulence in two-phase is presented by (Khushnood et al., 2003).
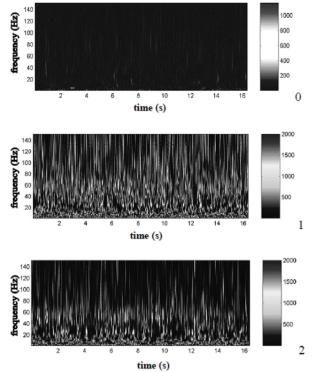
(Endres & Moller, 2009) present the experimental analysis of disturbance propagation with a fixed frequency against cross flow and its effect on velocity fluctuations inside the bank. It is concluded that continuous wavelet transforms of the signals. Figure 8 indicates the disturbance frequency to be showing steady behavior. Generally designing for enhanced heat exchange ratios in thermal equipments ignores the structural effects caused by turbulent flow.
Fig. 8. Continuous wavelet transforms of the signals at locations 0, 1 and 2. Tube bank with P/D = 1.26, vortex generator #2, ReG = 6.46X10⁴ (Endres & Möller, 2009).

90 |
Nuclear Power Plants |
(Pascal-Ribot and Blanchet, 2007) proposed a formulation to collapse the dimensionless spectra of buffeting forces in a single characteristic curve and gives edge to the formulation over previously normalized models in terms of collapse of data.
Dimensionless autocorrelation spectrum
(Non-dimensional frequency)
Fig. 9. Dimensionless reference equivalent spectra (Barrington, 1973)
Figure 9 shows the dimensionless spectra calculated with equations 15 & 16 respectively.
|
Po k 1g |
|
|
1 |
2 |
(15) |
||||
|
|
g |
|
|||||||
|
|
|
|
|
|
|
|
|
||
P0 |
k 1g |
|
|
ct 1 |
ct 2 |
: ct 0.4 |
(16) |
|||
g |
||||||||||
|
|
|
|
|
|
|
||||
Where α is the void fraction.
(Wang et al., 2006) concludes the physically realistic solutions for turbulent flow in a staggered tube banks can be realized by FLUENT (with 2-D Reynolds stress model).
Figure 10 shows the consistency of turbulence intensity contours obtained through standard wall function approach and non-equilibrium wall function approach whereas near-wall treatment model and near -wall turbulence model predicts much higher results (Wang, et al., 2006).

Cross-Flow-Induced-Vibrations in Heat Exchanger Tube Bundles: A Review |
91 |
Fig. 10. Turbulence intensity contours (Barrington, 1973)
2.5 Acoustic resonance
Acoustic vibration occurs only when the shell-side fluid is a vapor or a gas. The characteristic frequency of acoustic vibration in a heat exchanger depends on some characteristic length, usually the shell diameter and the velocity of sound in shell-side fluid, Usound . The acoustic frequency (Chenoweth, 1993) can be predicted by the following equation.
fa |
m Usound |
(17) |
|
2d |
|||
|
|
where m is the mode number (a dimensionless integer), and d is the shell diameter. The lowest acoustic frequency is achieved when m 1 and the characteristic length is the shell diameter. The acoustic frequencies of an exchanger can be excited by either vortex shedding or turbulent buffeting (Chenoweth, 1993). (Barrington, 1973) indicated that so
92 |
Nuclear Power Plants |
long as the exciting frequencies are within 20% of an acoustic frequency, a loud sound may be produced. Acoustic vibration becomes destructive when it is in resonance with some component of exchanger. The acoustic frequencies of shell can be changed by inserting a detuning plate parallel to the direction of cross-flow to alter the characteristic length (Chenoweth, 1993). There are a number of published acoustic vibration criteria to predict strong acoustic vibration within a tube bank, including (Eisinger et al., 1994), (Groth & Arnold, 1956), (Chen, 1968), (Fitzpatrick, 1986), (Ziada et al.,) and Blevins (Blevins, 1990 ).
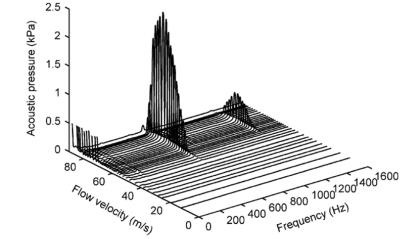
(Hanson & Ziada, 2011) have investigated the effects of acoustic resonance on the dynamic lift force acting on the central tube. Two effects of resonant sound field includes generation of “sound induced” dynamic lift because of resonant acoustic pressure distribution on the tube surface and synchronization of vorticity shedding. Sound enhancements coefficients and sound induced lift force development is carried through numerical solution. (Hanson et al., 2009) investigated aeroacoustic response of two side-by-side cylinders against cross flow. It is concluded that acoustic resonance synchronizes vortex shedding and eliminates bistable flow phenomenon. Vortex shedding is noticed a particular strouhal number which excites acoustic resonance. Figure 11 and figure 12 gives the pressure spectra for two side-by-side cylinders and aeroacoustic response of two side-by-side cylinders.
(Eisinger & Sullivan , 2007) considers strong acoustic resonance with acoustic pressure reading 165 dB for package boiler at near full load, suppression of resonance (lower frequency) through baffle covering with downstream section and the development of another resonance (higher frequency) in the unbaffled upstream section.
(Feenstra et al., 2006) carried out experimental investigation of the effects of width of test section for measuring the acoustic resonance with a small pitch rates staggered tubes. The conclusion was that the maximum acoustic pressure versus input energy parameter of Blevins and Bressler is not a reliable preditor and it over predicts.
Fig. 11. Pressure spectra for the two side-by-side cylinders for T/D=1.25 (Hanson, et al., 2011)

Cross-Flow-Induced-Vibrations in Heat Exchanger Tube Bundles: A Review |
93 |
Fig. 12. Aeroacoustic response of the two side-by-side cylinders with T/D =1.25 and D =21.8 mm (Hanson, et al., 2011) (Eisinger & Sullivan, 2005) test results concluded that wide test sects gives the maximum acoustic pressure (lower acoustic mode) at P=53.4 MPa which is 4.27 times greater than predicted by Blevins and Bressler.
3. Natural frequencies of tube vibration
In flow-induced vibration design of heat exchanger tube bundles, resonant conditions must be suppressed by ensuring separation of natural frequencies of the tubes and exciting frequencies (Shin & Wambsganss,1975). A number of techniques are available for computing natural frequencies of straight, curved, single and multiple span tubes. These tubes may be subjected to varying end conditions. Loose baffles act like "kinfe-edged rings” supports (Timoshenko, 1955) . Tubes are rigidly fastened to the tube sheet and supported at intermediate points along their lengths by baffles or support plates. Some tubes in the centre may be supported by every baffle, whereas tubes that pass thorough baffle window may be supported by every second and third baffle. Table 5 (MacDuff & Feglar, 1957, Kissel, 1977) gives some of the formulas/techniques for estimating the natural frequencies of straight-and curved-or U-tubes.
3.1 Variables affecting tube natural frequencies
The tube natural frequencies are affected by tube-to-baffle hole clearance, axial stress, fins, span length, span shape (straight, U-tube), support type, temperature and tube vibration (Chenoweth, 1976, Elliot & Park, 1973, Pettigrew et al., 1986, Simpson et al., 1974, Tanaka & Takahara, 1981, TEMA Standards, 8th edition). At about one tenth of TEMA allowable clearance, the frequency is about 7% higher than that predicted for simple supports. For most exchangers, tube-to-hole clearance is not a significant parameter for controlling natural frequencies, but it may be important in damping and tube wear (Chenoweth, 1993). Due to manufacturing procedures, the tubes may be under a tension or compression axial loading. (Kissel, 1972) found a variation in natural frequency due to axial loading in a typical

94 |
Nuclear Power Plants |
exchanger as much as ± 40%. The natural frequency varies as reciprocal of the span length squared (unsupported span). For finned tubes, effective diameter for the outside diameter should be used to find the area moment of inertia for natural frequency calculation (Chenoweth, 1993). Currently, software by TEMA (FIV) (TEMA Standards, 8th edition) is capable of predicting the natural frequencies.
|
|
|
|
|
|
|
|
|
Formula/ Procedure |
|
Conditions |
|
|
|||||||||||||||||
|
|
|
|
|
|
|
|
|
|
|
|
|
|
|
|
|
|
|
|
|
|
|
|
|
|
|
|
|
||
|
|
|
|
|
1 |
n |
EI |
1/ 2 |
|
|
|
|
Straight beams /single span |
|
|
|||||||||||||||
fn |
|
(Jones, 1970) |
n is the mode number and n is a frequency |
|||||||||||||||||||||||||||
|
|
2 |
|
|
2 |
|
m |
|
|
|||||||||||||||||||||
|
|
|
|
|
l |
|
|
|
|
|
|
|
|
factor which depends upon the end conditions |
||||||||||||||||
|
|
|
|
|
|
|
|
|
|
|
|
|
|
|
|
|
|
|
|
|
|
|
|
|
|
|||||
|
|
|
|
|
|
|
|
|
|
|
|
|
|
|
|
|
|
|
|
|
|
|
|
|
|
|
|
|
||
|
|
|
|
|
|
|
|
|
|
|
|
|
|
|
|
|
|
|
|
|
|
|
|
|
|
Curved beams/ single span |
|
|
||
f |
|
|
|
1 |
|
|
1 |
|
|
|
|
EI |
1/ 2 |
(Archer, 1960) |
n is a frequency factor |
|
|
|||||||||||||
n |
|
|
|
|
|
|
|
|
|
|
|
|
|
|
|
|
|
|
|
|||||||||||
|
|
|
2 |
|
|
|
|
R |
|
|
m |
|
|
|
|
R is the radius of curvature and is the |
|
|
||||||||||||
|
|
|
|
|
|
|
|
|
|
|
|
|
|
|
|
|
|
|
|
|
|
|
|
|
|
|
|
|||
|
|
|
|
|
|
|
|
|
|
|
|
|
|
|
|
|
|
|
|
|
|
|
|
|
|
subtended angle |
|
|
||
|
|
|
|
|
|
|
|
|
|
|
|
|
|
|
|
|
|
|
|
|
|
|
|
|
|
|
|
|||
fn |
59.55 |
Cu |
|
EI |
|
|
0.5 |
|
|
|
U-tube curved |
|
|
|||||||||||||||||
|
|
|
|
|
|
|
|
|
|
|||||||||||||||||||||
2 |
|
|
|
|
|
|
|
|
|
|
|
|
|
|
||||||||||||||||
|
|
|
|
|
|
|
|
|
L |
|
Me |
|
|
|
|
Cu |
is the first mode U-tube constant |
|
|
|||||||||||
(TEMA, 6th Edition, 1978) |
|
|
|
|
||||||||||||||||||||||||||
Experimental/ computer program |
Straight/multiple, free-free spans (1-5 span |
|||||||||||||||||||||||||||||
|
|
|
nL 2 |
|
|
|
EIg |
|
|
|
|
|
|
|
|
|||||||||||||||
fn |
|
|
|
|
|
|
|
|
|
|
|
|
tests); idealized support conditions, ( nL) |
2 |
is |
|||||||||||||||
|
2 L2 |
|
|
|
|
|
W |
|
|
|
|
|
|
|
|
|
||||||||||||||
|
|
|
|
|
|
|
|
|
|
|
|
|
|
|
|
|
eigen value |
|
|
|||||||||||
(Lowery & Moretti, 1975) |
|
|
||||||||||||||||||||||||||||
|
|
|
|
|||||||||||||||||||||||||||
|
|
|
|
|
|
|
|
|||||||||||||||||||||||
FEM in-plane and out of plane |
|
|
|
|
||||||||||||||||||||||||||
Experimental/ analytical |
Straight/curved |
|
|
|||||||||||||||||||||||||||
(Elliott & Pick, 1973) |
|
|
|
|
|
|
|
|
||||||||||||||||||||||
|
|
|
|
|
|
|
||||||||||||||||||||||||
Beams immersed in liquids, air, kerosene, |
Straight/simply supported/clamped |
|
|
|||||||||||||||||||||||||||
and oil (Jones, 1970) |
|
|
|
|
|
|
|
|
||||||||||||||||||||||
|
|
|
|
|
|
|
|
|
|
|
|
|
|
|
|
|
|
|
|
|
|
|
|
|
|
|
|
|
||
Out of plane: |
|
|
|
|
|
|
|
|
|
|
|
|
|
|
Clamped ring segments |
|
|
|||||||||||||
|
|
|
|
|
|
|
|
|
|
|
|
|
|
n |
is mode number; k is bending stiffness |
|
||||||||||||||
f |
|
3.13 |
n |
|
|
|
|
C |
|
|
|
|
|
|
n(n2 1) |
|
|
|||||||||||||
|
|
|
|
A |
|
|
|
1 kn2 |
|
|
|
|
||||||||||||||||||
|
n |
|
|
|
|
|
R2 |
|
|
|
|
|
n |
|
|
is specific weight; C is the torsional stiffness. |
||||||||||||||
(Ojalvo & Newman, 1964) |
A is cross-sectional area |
|
|
|||||||||||||||||||||||||||
|
|
|
|
|
|
|
|
|
|
|
|
|
|
|
|
|
|
|
|
|
|
|
|
|
|
|
|
|||
|
|
|
|
|
||||||||||||||||||||||||||
Graphical in-plane and out of plane |
Straight/curved, single span /multiple span |
|||||||||||||||||||||||||||||
(Chen & Wambsganss, 1974) |
||||||||||||||||||||||||||||||
|
|
|
|
|||||||||||||||||||||||||||
|
|
|
|
|
|
|
|
|
|
|
|
|
|
|
|
|
|
|
|
|
|
|
|
|
|
|
|
|
|
|