

NUCLEAR POWER PLANTS
.pdfAnalysis of Primary/Containment Coupling Phenomena |
215 |
Characterizing the MASLWR Design During a SBLOCA Scenario |
During the saturated blowdown period, the inlet and the outlet temperature of the core are equal each other assuming the saturation temperature value. A core reverse flow and a core coolant boiling off at saturation is present in the facility during this period. When the refill takes place the core normal flow direction is restarted and a delta T core is observed depending on the refill rate and core power, figure 9.
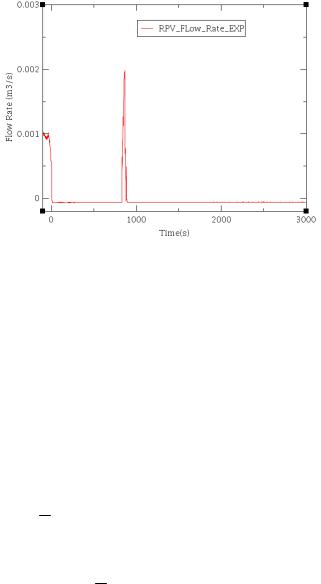
When the refill of the reactor takes place the level of the coolant reaches the location of the flow rate HL measurement point, therefore an increase of the RPV flow rate is detected for this phenomenon, figure 10.
Fig. 8. RPV water level inventory behaviour during the OSU-MASLWR-001 test (Modro et al., 2003; Reyes et al., 2007; Mascari et al., 2011e).
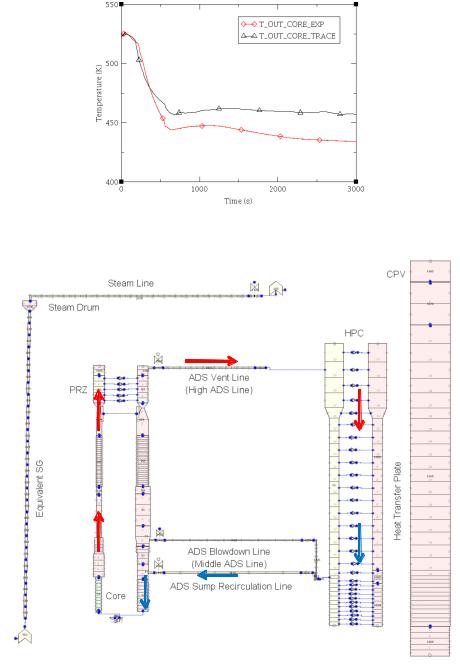
Fig. 9. Inlet/outlet core temperature behavior during the OSU-MASLWR-001 test (Modro et al., 2003; Mascari et al., 2011e).
216 |
Nuclear Power Plants |
Fig. 10. RPV flow rate during the OSU-MASLWR-001 test (Modro et al., 2003; Mascari et al., 2011e).
5. Code application
5.1 TRACE code
TRACE (TRACE V5.0, 2010) is a component-oriented code designed to perform best estimate analyses for LWR. In particular this code is developed to simulate operational transients, LOCA, other transients typical of the LWR and to model the thermal hydraulic phenomena taking place in the experimental facilities used to study the steady state and transient behavior of reactor systems (Mascari et al., 2011a).
TRACE is a finite volume, two fluid, code with 3D capability. The code is based on two fluid, two-phase field equations. This set of equations consists of the conservation laws of mass, momentum and energy for liquid and gas fields (Reyes, 2005a):
Mixture mass conservation equation:
t [ v (1 ) l ] [ vvv lvl (1 )] 0
Vapor mass conservation equation:
t ( v ) ( vvv ) v
Liquid momentum conservation equation:
vl |
|
|
1 |
|
ci |
|
|
|
|
cond |
|
|
cw |
|
|
|
t |
vl vl |
|
p |
|
(vv vl )|vv vl| |
|
(vv vl ) |
|
vl|vl| g |
|||||||
l |
(1 ) l |
(1 ) l |
(1 ) l |
|||||||||||||
Gas momentum conservation equation:

Analysis of Primary/Containment Coupling Phenomena |
|
|
|
|
|
|
|
217 |
|||||||||
Characterizing the MASLWR Design During a SBLOCA Scenario |
|
|
|
|
|
||||||||||||
|
vv |
|
|
1 |
|
ci |
|
|
|
|
Boiling |
|
|
cwv |
|
|
|
|
|
vv vv |
|
p |
|
(vv vl )|vv vl| |
|
(vv vl ) |
|
vv|vv| g |
|||||||
|
t |
v |
v |
v |
v |
||||||||||||
Mixture energy conservation equation:
t [( v ev l(1 )el ] [ v evvv l(1 )elvl ] p [ vv (1 )vl ] qwl qdlv
Vapor energy conservation equation:
t ( v ev ) ( v evvv ) p t p ( vv ) qwv qdv qiv vh v
The resulting equation set is coupled to additional equations for non-condensable gas, dissolved boron, control systems and reactor power. Relations for wall drag, interfacial drag, wall heat transfer, interfacial heat transfer, equation of state and static flow regime maps are used for the closure of the field equations. The interaction between the steamliquid phases and the heat flow from solid structures is also considered. These interactions are in general dependent on flow topology and for this purpose a special flow regime dependent constitutive-equation package has been incorporated into the code.
TRACE uses a pre-CHF flow regime, a stratified flow regime and a post-CHF flow regime. In order to study the thermal history of the structures the heat conduction equation is applied to different geometries. A 2D (r and z) treatment of conduction heat transfer is taken into account as well.
A finite volume numerical method is used to solve the partial differential equations governing the two-phase flow and heat transfer. By default, a multi-step time-differencing procedure that allows the material Courant-limit condition to be exceeded is used to solve the fluid-dynamics equations.
TRACE can be used together with a user-friendly front end, Symbolic Nuclear Analysis Package (SNAP), able to support the user in the development and visualization of the nodalization, to show a direct visualization of selected calculated data, and accepts existing RELAP5 and TRAC-P input. The TRACE/SNAP architecture is shown in figure 11.
|
|
|
|
|
|
|
|
|
|
|
SNAP System |
|
|
|
|
|
|
|
|
|
Model database |
|
|
|
|
|
|
|
|
|
|
|
|
|
|
|
|
|
|
|
|
|
SNAP |
|
|
|
|
|
|
|
|
|
|
|
|
|
|
|
|
|
|
|
|
|
|
|
|
|
|
|
RELAP5 ASCII |
|
|
|
|
|
|
|
|
|
Input |
|
|
|
|
|
|
|
|
|
|
|
|
|
|
|
|
|
|
|
|
|
|
|
|
|
|
|
|
|
|
|
|
|
|
|
|
|
|
|
TRAC-P ASCII |
|
TRACE Input |
|
|
|
|
|
|
|
Input |
|
Processing |
|
|
|
|
|
|
|
|
|
|
|
|
|
|
|
|
|
|
|
|
|
|
|
|
|
|
|
|
|
|
|
|
|
|
|
|
|
TRAC-B ASCII |
|
|
|
|
|
|
|
|
|
Input |
|
Platform Independent |
Interprocess Message Passing |
|
|
|
||
|
|
|
|
|
|
||||
|
|
|
Binary File |
|
Service |
|
|
|
|
|
|
|
|
|
|
|
|
|
|
Fig. 11. TRACE/SNAP environment architecture (Staudenmeier, 2004; Mascari et al., 2011a).
218 |
Nuclear Power Plants |
SNAP (SNAP users manual, 2007) is a suite of integrated applications including a “Model Editor”, “Job Status”, the “Configuration Tool” client applications and a “Calculation Server”. In particular, the “Model Editor” is used for the nodalization development and visualization and for the visualization of the selected calculated data by using its graphical and animation model capability. The codes currently supported in SNAP are CONTAIN, COBRA, FRAPCON-3, MELCOR, PARCS, RELAP5 and TRACE.
5.2 OSU-MASLWR TRACE model
An OSU-MASLWR TRACE model (Mascari et al., 2008, 2009a, 2009b, 2010b, 2011a, 2011b, 2011c, 2011d) is developed in order to evaluate the TRACE code capabilities in predicting the thermal hydraulic phenomena typical of the MASLWR design as natural circulation, heat exchange from primary to secondary side by helical SG in superheated condition and primary/containment coupling during transient scenario.
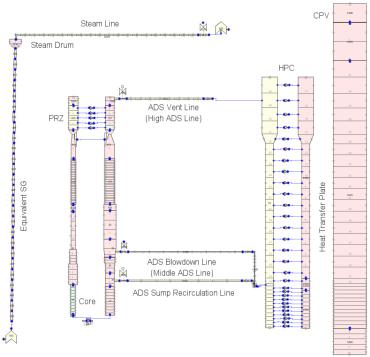
The TRACE nodalization, developed by using SNAP, models the primary and the secondary circuit. The containment structures consisting of the HPC, CPV and heat transfer plate are modeled as well, figure 12.
Fig. 12. OSU-MASLWR TRACE model.
The “slice nodalization” technique is adopted in order to improve the capability of the code to reproduce natural circulation phenomena. This technique consists in realizing the mesh cells of different nodalization zones, at the same elevation, with the same cell length (Mascari et al.,

Analysis of Primary/Containment Coupling Phenomena |
219 |
Characterizing the MASLWR Design During a SBLOCA Scenario |
2011a). In this way it is avoided the error due to the position/elevation of the cell nodalization center that can influences the results of the calculated data when natural circulation regime is present. If the “slice nodalization” technique is not used, this error has to be taken into account and its effect increases if larger nodalization cells are used. In this case it can be reduced by using a “fine nodalization”. In general, its effect on the results is less important when forced circulation regimes are simulated. However the “slice nodalization” technique could require nodes of small length increasing the numerical error and the computational time. The “code user” has to take into account these disadvantages during the nodalization development.
The primary circuit of the TRACE model, comprises the core, the HL riser, the UP, the PRZ, the SG primary side, the CL down comer and the LP. After leaving the top of the HL riser, the flow enters the UP divided in two thermal hydraulic regions connected to the PRZ. After living the UP, the flow continues downward through the SG primary section and into the CL down comer region. The core is modeled with one thermal hydraulic region thermally coupled with one equivalent active heat structure simulating the 56 electric heaters. The PRZ is modeled with two hydraulic regions, connected by different single junctions, in order to allow potential natural circulation/convection phenomena. The three different PRZ heater elements are modeled with one equivalent active heat structure. The thick baffle plate is modeled as well. The direct heat exchange by the internal shell between the hotter fluid, in the ascending riser, and the colder fluid, in the descending annular down comer, is modeled by heat structures thermally coupled with these two different hydraulic regions. SG coils are modeled with one “equivalent” group of pipes, in order to simulate the three separate parallel helical coils. The steam line of the facility is modeled as well.
In order to simulate the OSU-MASLWR-001 test the HPC is divided in two thermal hydraulic regions, connected by single junctions, in order to allow the simulation of possible natural circulation phenomena. The ADS lines are modeled.
The RPV, HPC and CPV shell and the connected insulation are modeled.
5.3 TRACE model qualification process
A nodalization, representing an actual system (integral test facility or nuclear power plant), can be considered qualified when it has a geometrical fidelity with the involved system, it reproduces the measured nominal steady state conditions of the system, and it shows a satisfactory behavior in time-dependent conditions.
The OSU-MASLWR nodalization qualification process (Bonuccelli et al., 1993) is still in progress, because the facility experimental characterization will be conducted in the framework of the current IAEA ICSP. In particular several important facility operational characteristics, like pressure drop along the primary loop, at different primary side mass flow rates, and heat losses, at different primary side temperatures, determined to be of importance during the planned ICSP experiments, will be evaluated and distributed to the ICSP participants. Besides, some nodalization models, here presented, are still preliminary because some geometrical data and the complete instrument characterization and location will be delivered in the ICSP framework as well. Therefore the current results are preliminary and should not be used for the code assessment, but are able to show the TRACE capability to reproduce the primary/containment coupling phenomena typical of the MASLWR prototypical design (Mascari et al., 2009b; Mascari et al., 2011c).
220 |
Nuclear Power Plants |
5.4 Analysis of the OSU-MASLWR-001 TRACE calculated data
Starting from the calculated data developed in previous analyses (Pottorf et al., 2009; Mascari et al., 2009b; Mascari et al., 2011c) the target of this section is to give an expanded revised analyses, after a first review of the TRACE nodalization, of the TRACE V5 patch 2 code capability in predicting the primary/containment coupling phenomena typical of the MASLWR prototypical design.
The analysis of the OSU-MASLWR-001 calculated data shows that the TRACE code is able to qualitatively predict the primary/containment coupling phenomena characterizing the test. The blowdown phenomena, the refill of the core and the long term cooling, permitting of removing the decay power, are predicted by the code.
In particular, following the inadvertent middle ADS actuation, the blowdown of the primary system takes place. A subcooled blowdown, characterized by a fast RPV depressurization, is predicted by the code after the SOT.
When the differential pressure in the facility at the break location results in flashing, a twophase blowdown, qualitatively predicted by the code, occurs. A decrease in depressurization rate of the primary system is then observed, in agreement with the experimental data.
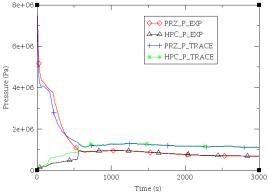
When the PRZ pressure reaches saturation, single phase blowdown occurs and the depressurization rate increases again, in agreement with the experimental data. The RPV and HPC pressure versus code calculations are shown in figure 13.
Fig. 13. Experimental data versus code calculation for PRZ and HPC pressure.
In agreement with the experimental data, when the pressure difference between the RPV and the containment reaches a value less than 0.517 MPa, the high ADS valves are opened which equalizes their pressure.
When the pressure difference reaches a value less than 0.034 MPa, the sump recirculation valves are opened and the refill period begins. The refill phenomenon is predicted by the code. As in the experimental data, the refill period takes place for the higher relative coolant height in the HPC compared to the RPV.
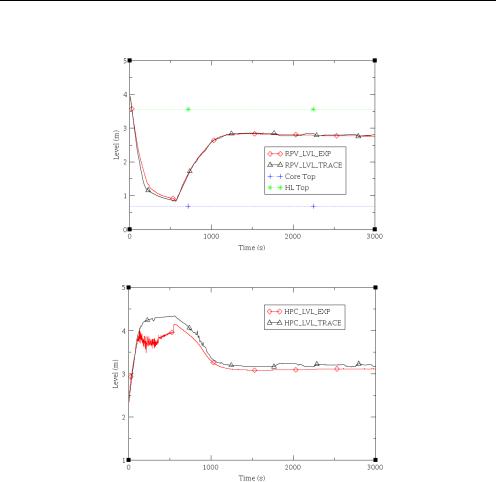
Figure 14 shows the RPV level evolution experimentally detected during the test versus the calculated data. In agreement with the experimental data, the RPV water level never fell
Analysis of Primary/Containment Coupling Phenomena |
221 |
Characterizing the MASLWR Design During a SBLOCA Scenario |
below the top of the core. Figure 15 shows the HPC level versus code calculation during the test. The qualitative behavior is well predicted by the TRACE code.
Fig. 14. Experimental data versus code calculation for RPV level.
Fig. 15. Experimental data versus code calculation for HPC level.
In agreement with the experimental data, during the saturated blowdown period the inlet and the outlet temperature of the core are equal each other assuming the saturation temperature value. A core reverse flow and a core coolant boiling off at saturation is predicted by the code. When the refill takes place, the core normal flow direction is restarted. Figure 16 shows the experimental data versus code calculation for outlet core temperature.
In agreement with the experimental data when the sump recirculation valves are opened the vapor produced in the core goes in the upper part of the facility and through the high ADS valve goes to the HPC where it is condensed. At this point through the sump recirculation line and the down comer the fluid goes to the core again (Mascari et al., 2011c, 2011d). Figure 17 shows the long term cooling flow path typical of the MASLWR design.
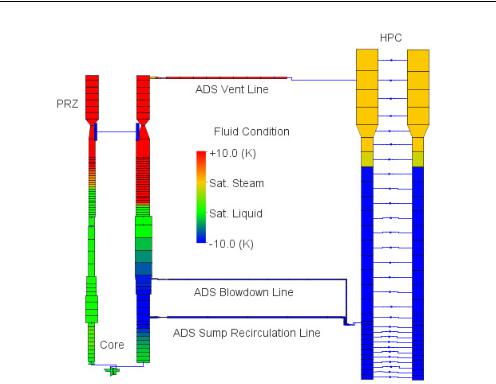
Figure 18 shows, by using the SNAP animation model capabilities, the fluid condition of facility, 976 s after the SOT, predicted by the TRACE code.
222 |
Nuclear Power Plants |
Fig. 16. Experimental data versus code calculation for outlet core temperature.
Fig. 17. Long term cooling flow path typical of the MASLWR design.
Analysis of Primary/Containment Coupling Phenomena |
223 |
Characterizing the MASLWR Design During a SBLOCA Scenario |
Transient Time: 1790 s
Fig. 18. SNAP animation model used to analyze the OSU-MASLWR-001 test (976s after the SOT).
From a quantitative point of view the results of the calculated data show a general over prediction compared with the experimental data. It is thought that this could be due to a combination of selection of vent valve discharge coefficients and condensation models applied to the inside surface of the containment (Pottorf et al., 2009; Mascari et al., 2011c).
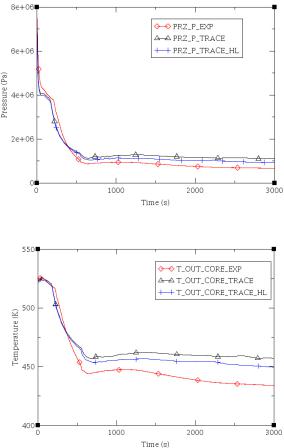
However, in order to quantitatively evaluate the capacity of the TRACE code to simulate OSU-MASLWR-001 primary/containment coupling phenomena, a qualification of the TRACE nodalization against an heat losses experimental characterization at different primary side temperature is necessary. Figures 19 and 20 show the behavior of PRZ pressure and outlet core temperature respectively by increasing the heat losses of the TRACE model (TRACE_HL). A general quantitative improvement of the calculated data has been showed by TRACE_HL calculation. Therefore in order to quantitatively evaluate the capability of the TRACE code to simulate the OSU-MASLWR phenomena, and therefore use the calculated data for the TRACE code assessment, is necessary a TRACE nodalization qualification against several facility operational characteristics like heat losses at different primary side temperatures and pressure drop at different primary mass flow rate. Currently the TRACE model qualification process is in progress considering the facility characterization that will be disclosed during the current IAEA ICSP.
224 |
Nuclear Power Plants |
Fig. 19. Experimental data versus code calculations for PRZ pressure.
Fig. 20. Experimental data versus code calculations for outlet core temperature.
Considering the importance of the containment/reactor vessel thermal hydraulic coupled behavior for the advanced integral-type LWR, in the IAEA ICSP framework a further test, simulating a loss of FW transient with subsequent ADS actuation and long term cooling, will be executed in the OSU-MASLWR facility (Woods & Mascari, 2009; Woods et al.; 2011).
6. Conclusions
The MASLWR is a small modular integral PWR relying on natural circulation during both steady-state and transient operation. During steady state condition the primary fluid, in single-phase natural circulation, removes the core power and transfers it to the secondary fluid through helical coil SG. In transient condition the core decay heat is removed through a passive primary/containment coupling mitigation strategy based on natural circulation.
The experimental analysis of the primary/containment coupling phenomena, characterizing the MASLWR design, has been developed in a first testing program at OSU-MASLWR