

1introjunos
.pdfNot
Introduction to JUNOS Software
Monitoring ReproductionPlatform and Interface Operation
The slide lists the topics we cover in this chapter. We discuss the highlighted topic
first. for
Operational Monitoring and Maintenance • Chapter 6–3
Introduction to JUNOS Software
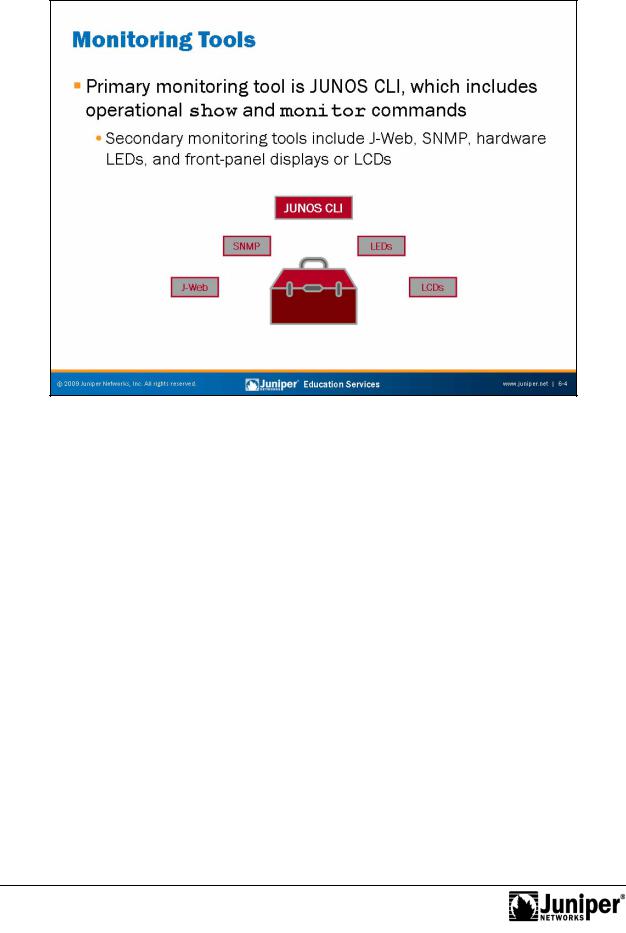
The primary monitoringReproductiontool for avid JUNOS Software users is the JUNOS CLI. The JUNOS CLI includes several show and monitor commands that facilitate system
monitoring.forWe highlight many of the monitoring capabilities available through the JUNOS CLI in this chapter.
In addition to the JUNOS CLI, a number of secondary monitoring tools exist such as the J-Web, SNMP, hardware LEDs, and front-panel displays or LCDs. Check the
Nottechnical publications at http://www.juniper.net/techpubs/ for specific details on a particular platform.
Chapter 6–4 • Operational Monitoring and Maintenance

Not
Introduction to JUNOS Software
Monitoring ReproductionSyst m Op ration
You can obtain most system information using show system argument commands. The following arguments are some of the most common:
• alarms: This argument displays current system alarms;
• |
boot-messages: This argument displays the messages seen during |
for• |
the last system boot; |
connections: This argument displays the status of local TCP and UDP |
|
|
connections; |
• |
statistics: This argument provides options for viewing various |
|
protocol statistics; and |
• |
storage: This argument displays the status of the file system storage |
|
space. |
Operational Monitoring and Maintenance • Chapter 6–5
Introduction to JUNOS Software
Monitoring the ChassisReproduction
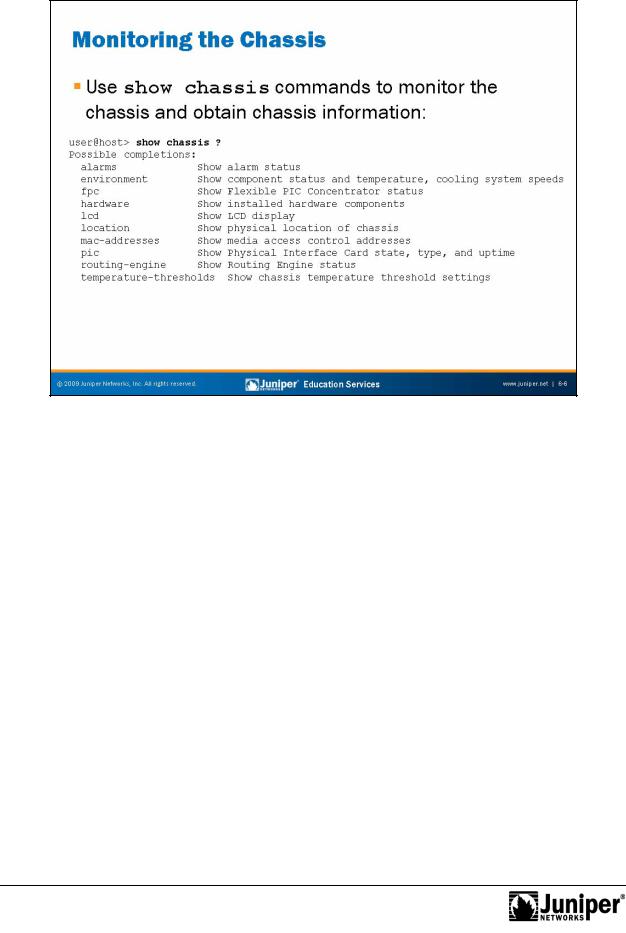
You can monitor the chassis and obtain chassis information using show chassis argument commands. The following arguments are some of the most common:
• ala ms: This argument displays current chassis alarms;
• |
envir nment: This argument displays component and environmental |
|
Not |
status as well as the operational speeds of the cooling system; |
|
forhardware: This argument displays an inventory of the installed |
||
• |
||
|
hardware components along with the serial number of each component; |
|
|
and |
|
• |
routing-engine: This argument provides operational status and |
|
|
utilization details for the routing engine. |
Chapter 6–6 • Operational Monitoring and Maintenance
Introduction to JUNOS Software
Interface StatusReproductionV rification
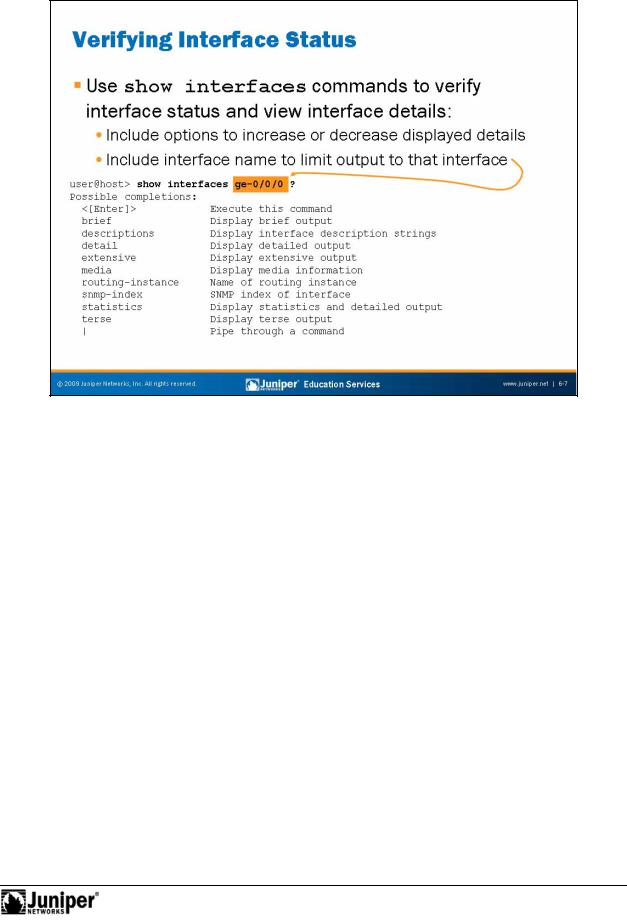
You can use the show interfaces command to verify various details and status information interfaces. A number of command options exist that determine the gene ated output for the show interfaces command. The example on the slide
illust ates the use of the interface-name option, which filters the generated utput and displays details only for the specified interface. If the interface-name
Notp i is excluded, the output provides interface details for all installed interfaces.
Operational Monitoring and Maintenance • Chapter 6–7
Introduction to JUNOS Software
Terse Output ExampleReproduction
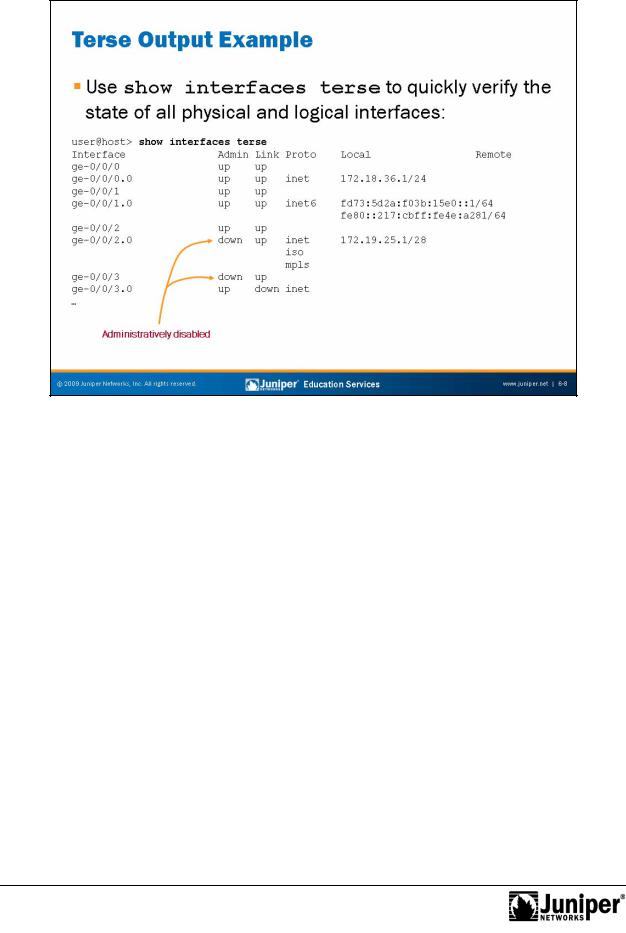
The example on the slide illustrates the show interfaces terse command. In this example the interface-name option is omitted, which causes all installed interfacesforand their accompanying details to be displayed. This command is ideal when you simply need to verify state information for physical and logical interfaces. The output m this command displays all installed interfaces in the left column and
Notprovides s ate, pr t col family, and addressing details to the right of each listed in erface.
Chapter 6–8 • Operational Monitoring and Maintenance
Introduction to JUNOS Software
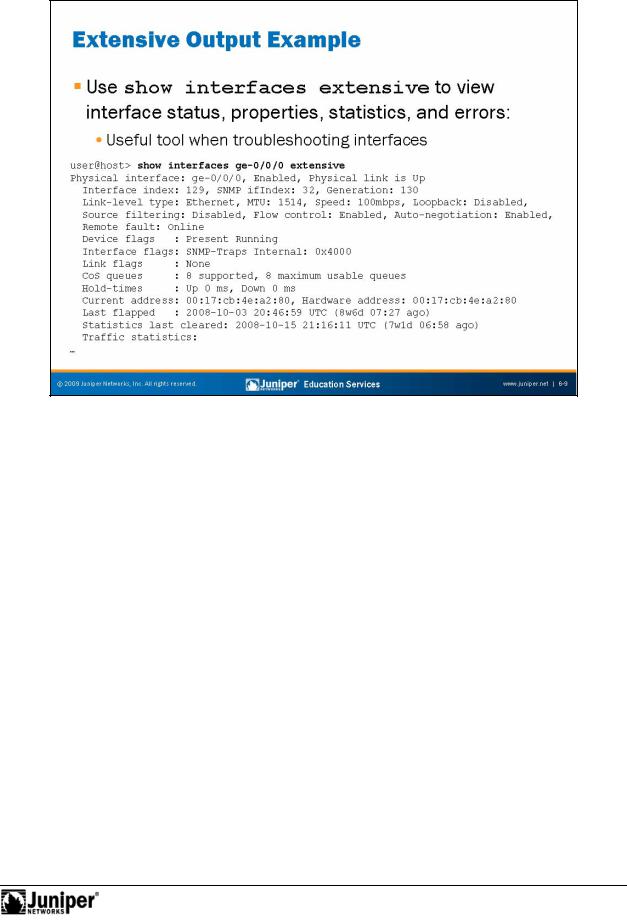
Gathering ExtReproductionnsive Interface Information
Use the show interface extensive command to view detailed information for fora named inte face (or all interfaces when a specific interface is not identified). The example on the slide shows a portion of the generated output when using the extensive option. This command is ideal when troubleshooting interfaces because it sh ws err rs, statistics, and physical and logical interface properties. This command
is also helpful when determining default settings for interfaces. Not
Operational Monitoring and Maintenance • Chapter 6–9
Introduction to JUNOS Software
|
|
|
displaying err |
and alaReproductionm conditions. To view real-time usage statistics for all |
|
|
|||
|
|
|
|
||||||
|
|
|
Monitoring an Interface |
|
|
|
|
||
|
|
|
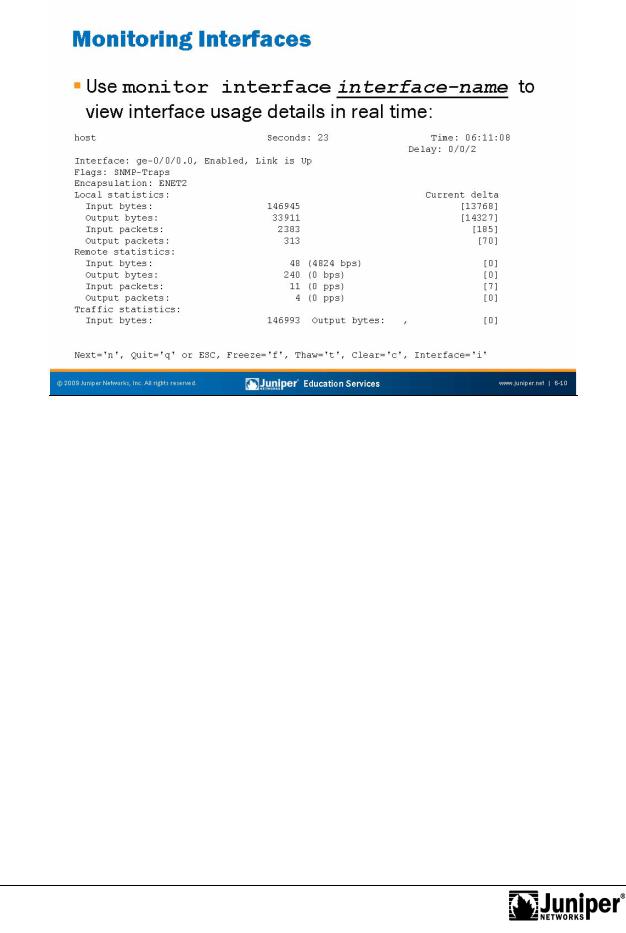
The slide depicts typical output from the monitor interface command. Your |
||||||
|
|
|
terminal session must support VT100 emulatio for the screen to correctly display the |
||||||
|
|
|
output. This command provides real-time packet and byte counters as well as |
||||||
|
|
|
interfaces, use the monitor interface traffic command. The following is a |
||||||
|
|
Not |
|
utput from this command: |
|
|
|
||
|
|
|
sample of he |
|
|
|
|||
user@host> monitor in erfacefortraffic |
|
Time: 04:47:57 |
|||||||
host |
|
|
|
Seconds: 27 |
|||||
Interface |
Link |
Input packets |
(pps) |
Output packets |
(pps) |
||||
ge-0/0/0 |
Up |
|
22763 |
(581) |
21275 |
(581) |
|||
... |
|
|
|
|
|
|
|
|
|
Bytes=b, Clear=c, Delta=d, Packets=p, Quit=q or ESC, Rate=r, Up=^U, Down=^D
Chapter 6–10 • Operational Monitoring and Maintenance
Introduction to JUNOS Software
|
|
Reproduction |
|
Network Utiliti s |
|
|
The slide highlights the topic we discuss next. |
|
Not |
for |
|
|
|
|
Operational Monitoring and Maintenance • Chapter 6–11

Introduction to JUNOS Software
Ping and TracerouteReproductionUtiliti s
The JUNOS CLI provides ping and traceroute utilities. You can use these tools to determineforgene al network reachability and the path that packets take to reach a destination. You can use various arguments with the ping and traceroute
commands, such as source IP address and packet size, to further assist in problem
isolation.
By defaul , he ping utility sends a continuous flow of ICMP echo requests to the referenced destination. To stop the ping operation, you press the Ctrl+c keys, as illustrated on the slide. Alternatively, you can include the count option with a specified number of ICMP echo requests to send out:
user@host> ping 10.210.11.177 count |
5 |
|
PING 10.210.11.177Not(10.210.11.177): |
56 data bytes |
|
64 |
bytes from 10.210.11.177: icmp_seq=0 ttl=64 time=0.071 ms |
|
64 |
bytes from 10.210.11.177: icmp_seq=1 ttl=64 time=0.060 ms |
|
64 |
bytes from 10.210.11.177: icmp_seq=2 ttl=64 time=0.125 ms |
|
64 |
bytes from 10.210.11.177: icmp_seq=3 ttl=64 time=0.128 ms |
|
64 |
bytes from 10.210.11.177: icmp_seq=4 ttl=64 time=0.080 ms |
|
--- 10.210.11.177 ping statistics ---
5 packets transmitted, 5 packets received, 0% packet loss round-trip min/avg/max/stddev = 0.060/0.093/0.128/0.028 ms
Chapter 6–12 • Operational Monitoring and Maintenance