

Management consulting
Phase 7 – Review and restart
As problems are solved, and more success is achieved, recognition is natural. New improvement targets are then needed to further reduce the costs associated with failure. This is also where preventing problems should become more important than solving them, if it has not already become the norm. The quality improvement process should be reviewed and evaluated regularly, and decisions taken on whether to restart, expand, disband or maintain existing efforts.
The above TQM process provides only very general guidelines and consultants should not take them as a rigid TQM process flow. It also provides a structure for a number of smaller quality improvement projects, which actually constitute the essence of the TQM process.
21.5 Principal TQM tools
Publications describing and recommending tools for quality improvement and management proliferate and a number of these tools were developed well before the emergence of TQM. We review here the most important tools without going into detail. It is useful to group these tools by two major dimensions: the first one according to the step of the quality improvement process, and the second reflecting the level of sophistication of the tool. The tools can also be broken down into analytical and management tools (see box 21.4).
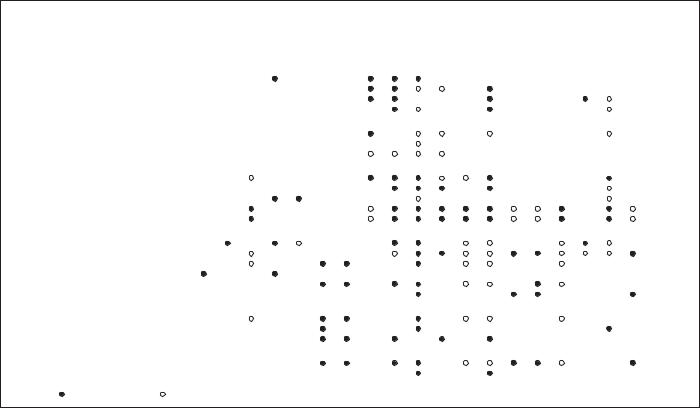
The classification suggested by the Juran Institute3 (see figure 21.4) illustrates how some quality improvement tools could best be used at different steps of the quality improvement process, providing some useful hints for consultants.
Several surveys have indicated that most Fortune 500 companies embracing TQM register less than 10 per cent quality improvement per year.4 Among the main reasons for this poor performance is selection of relatively ineffective
Box 21.4 Tools for simple tasks in quality improvement
Analytical tools |
Management tools |
|||
● |
Pareto charts |
● |
Affinity diagram |
|
● |
Cause and effect diagram |
● |
Plan–do–check–act (PDCA) |
|
|
(fishbone or Ishikawa diagram) |
● |
Interrelationship diagram |
|
|
Frequency distribution (scatter |
|||
● |
● |
Tree diagram |
||
|
diagram) |
|||
|
● |
Matrix diagram |
||
|
Stratification |
|||
● |
● |
Matrix data analysis/star plot |
||
● Control and line charts |
||||
● |
Process decision programme chart |
|||
● Failure and effect analysis |
||||
● |
Arrow diagrams |
|||
|
Taguchi loss function |
|||
● |
● |
Force-field analysis |
||
|
Histogram |
|||
● |
● |
Process capacity index |
||
|
Brainstorming |
|||
● |
● |
Quality assurance system chart |
||
|
|
|||
|
|
● |
Flowcharts |
|
478
479
Figure 21.4 Quality tools according to quality improvement steps
Tools by step
Step 1: Identify the project
a.Nominate projects
b.Evaluate projects
c.Select a project
d.Ask: Is it QI?
|
|
|
|
|
|
|
|
|
|
|
|
|
|
|
matrix |
network |
|
matrix |
|
|
Barriers/aidsBenefit/costBox |
plot |
|
-effect |
chart |
spread |
|
collectiondiagram |
|
|
analysis |
|
|
diagram |
|
diagram |
|||||
|
|
|
|
|
|
|
|
|||||||||||||
|
BrainstormingCause |
Control Control Cost/qualityData |
Flow |
Graphs/chartsHistogramPareto |
PlanningPlanningScatter |
SelectionStratificationTr |
|
|||||||||||||
|
|
|
|
|
|
|
|
|
|
|
|
|
|
|
|
|
|
|
ee |
|
– |
– |
– |
|
– |
– |
– |
– |
– |
– |
– |
– |
– |
– |
– |
– |
– |
– |
– |
– |
|
– |
– |
– |
|
× |
× |
– |
– |
– |
– |
– |
– |
– |
– |
– |
– |
– |
– |
– |
– |
|
– |
– |
– |
|
– |
– |
– |
– |
– |
– |
– |
– |
– |
– |
– |
– |
– |
– |
– |
– |
|
– |
– |
× |
|
– |
× |
– |
– |
– |
– |
– |
– |
× |
– |
– |
– |
× |
– |
– |
– |
|
Step 2: Establish the project |
– |
– |
– |
– |
– |
– |
– |
– |
– |
– |
– |
– |
– |
– |
– |
– |
– |
– |
– |
|
a. Prepare mission statement |
||||||||||||||||||||
b. Select a team |
– |
– |
– |
– |
– |
– |
– |
– |
– |
– |
– |
– |
– |
– |
– |
– |
– |
– |
– |
|
c. Verify the mission |
– |
– |
– |
– |
– |
– |
– |
– |
– |
– |
– |
– |
– |
– |
– |
– |
– |
– |
– |
|
Step 3: Diagnose the cause |
– |
– |
– |
× |
× |
– |
– |
– |
– |
– |
– |
– |
– |
– |
– |
– |
– |
– |
– |
|
a. Analyse the symptoms |
||||||||||||||||||||
b. Confirm or modify mission |
– |
– |
– |
× |
× |
– |
– |
– |
– |
– |
– |
– |
– |
– |
– |
– |
– |
– |
– |
|
c. Formulate theories |
– |
– |
– |
– |
– |
– |
– |
– |
– |
– |
– |
– |
– |
– |
– |
– |
– |
– |
– |
|
d. Test theories |
– |
– |
– |
× |
× |
– |
– |
– |
– |
– |
– |
– |
– |
– |
– |
– |
– |
– |
– |
|
e. Identify root cause(s) |
– |
– |
– |
× |
× |
– |
– |
– |
– |
– |
– |
– |
– |
– |
– |
– |
– |
– |
– |
|
Step 4: Remedy the causes |
– |
– |
– |
– |
– |
– |
– |
– |
– |
– |
– |
– |
– |
– |
– |
– |
– |
– |
– |
|
a. Evaluate alternatives |
||||||||||||||||||||
b. Design remedy |
– |
– |
– |
× |
× |
– |
– |
– |
– |
– |
– |
– |
– |
– |
– |
– |
– |
– |
– |
|
c. Design controls |
– |
– |
– |
× |
× |
– |
– |
– |
– |
– |
– |
– |
– |
– |
– |
– |
– |
– |
– |
|
d. Design for culture |
– |
– |
– |
– |
– |
– |
– |
– |
– |
– |
– |
– |
– |
– |
– |
– |
– |
– |
– |
|
e. Prove effectiveness |
– |
– |
– |
– |
– |
– |
– |
– |
– |
– |
– |
– |
– |
– |
– |
– |
– |
– |
– |
|
f. Implement |
– |
– |
– |
– |
– |
– |
– |
– |
– |
– |
– |
– |
– |
– |
– |
– |
– |
– |
– |
|
Step 5: Hold the gains |
|
|
|
× |
× |
|
|
|
|
|
|
|
|
|
|
|
|
|
|
|
a. Design effective quality controls |
– |
– |
– |
– |
– |
– |
– |
– |
– |
– |
– |
– |
– |
– |
– |
– |
– |
|||
b. Foolproof the remedy |
– |
– |
– |
– |
– |
– |
– |
– |
– |
– |
– |
– |
– |
– |
– |
– |
– |
– |
– |
|
a. Audit the controls |
– |
– |
– |
– |
– |
– |
– |
– |
– |
– |
– |
– |
– |
– |
– |
– |
– |
– |
– |
|
Step 6: Replicate and nominate |
|
|
|
|
|
|
|
|
|
|
|
|
|
|
|
|
|
|
|
|
a. Replicate the project results |
– |
– |
– |
– |
– |
– |
– |
– |
– |
– |
– |
– |
– |
– |
– |
– |
– |
– |
– |
|
b. Nominate new projects |
– |
– |
– |
– |
– |
– |
– |
– |
– |
– |
– |
– |
– |
– |
– |
– |
– |
– |
– |
|
Key: |
Frequently used |
Occasionally used |
– Rarely used |
× |
Never used |
|
|
|
|
|
|
|
|
|
||||||
Source: Juran Institute: Quality improvement guide (Wilton, CT, 1993).
management quality total in Consulting

Management consulting
Box 21.5 Powerful tools for company-wide TQM
●Six Sigma
●Design of experiments (DOE)
●Multiple environment overstress test (MEOST)
●Quality function deployment (QFD)
●Total productive maintenance (TPM)
●Benchmarking
●Poka-yoke (mistake proofing)
●Next operation as customer (NOAC)
●Team-based quality organization (TBQO)
tools. For example, some companies have used ISO 9000 over world-class quality systems (such as TQM, Deming Award, Malcolm Baldridge National Quality Award and the European Quality Awards). Other reasons are selection of poor quality measurement over meaningful metrics such as the cost of poor quality and cycle time, and using statistical process control instead of product/ process optimization.
Another common problem is ignoring powerful tools, such as “next operation as customer”, which focuses on the internal customer as scorekeeper and evaluator and is particularly useful for improving white-collar quality and productivity. Using only weak tools produces confusion, frustration and disenchantment among workers. Some more powerful – though not necessarily the latest – tools are mentioned in box 21.5.5
Six Sigma. This quality improvement method is based on the quality philosophy developed by Motorola and adopted by many other organizations, including General Electric. It offers a set of tools that apply equally to design, production and service, and is based on setting attainable short-term goals while striving for long-range objectives. It uses customer-focused goals and measurements to drive continuous improvement at all levels in the enterprise. Six Sigma is designed to help organizations reduce costs and increase productivity and profits through statistical problem-solving tools that lead to breakthrough improvements with measurable bottom-line impact. The long-term objective is to develop and implement processes so robust that defects are measured at levels of only a few per million opportunities. Six Sigma provides a measure that applies to both product and service activities: defects per million opportunities (DPMO). It focuses on defining customer satisfaction measures and using teams to continually reduce the DPMO for each measure to 3.4. This number is so small that it is perceived as “virtual perfection”. The fact that it is not zero allows people to buy into Six Sigma intellectually.6
Design of experiments (DOE). DOE can be applied to design, product/ process features, optimization and chronic-problem-solving in manufacturing and with suppliers and customers. The objectives of DOE are to:
480
Consulting in total quality management
●separate important variables from unimportant ones and enlarge the tolerances of the latter to substantially reduce costs;
●optimize the important parameters to establish realistic specifications and tolerances;
●freeze the parameters to prevent technician and maintenance people from changing them, intentionally or unintentionally;
●control peripheral quality “leaks”, such as accuracy of measuring instruments, environmental factors, and defects with process certification.
Its benefits include quality improvement of 10:1 or 100:1 with one, two, or three experiments; effective cost and cycle time reduction; heightened employee morale with higher success in chronic-problem-solving; greater customer loyalty; and enhanced overall factory effectiveness, including profits and return on investments.
Multiple environment overstress test (MEOST). Since warranties to customers are constantly escalating – from one year to three or five years or even lifetime – the design reliability must keep pace. The objectives of MEOST are to combine environmental stresses at the product design stage both to simulate actual customer use and to go beyond normal conditions to a maximum practical overstress. Only by going beyond “the horizon of design stress” can the weak links in design be detected. MEOST does for reliability what DOE does for quality: it can virtually eliminate field failures. In doing so, it removes one of the major causes of customer complaints and defections and can substantially reduce product recalls and liability lawsuits. MEOST can reduce the need for field service, which is notorious for its inefficiency and ineffectiveness, and for large inventories of spare parts.
The MEOST methodology is as follows:
1.Obtain a profile of the maximum environmental stress levels likely to be seen in the field simultaneously (thermal cycling, humidity, vibration, voltage, etc.) and design test chambers that simulate such combinations of stresses in the laboratory.
2.Test the product for a small fraction of its guaranteed lifetime in the field, gradually increasing both time and combined stress up to design stress. There should not be a single failure. If there is, institute immediate failure analysis and corrective action.
3.Continue beyond the design-stress level up to a maximum practical overstress (generally 10 to 20 per cent beyond design stress). Ignore isolated failures. If, however, there are four or more failures of the same type and the same mechanism, institute immediate failure analysis and corrective action.
4.Repeat steps 2 and 3, but for double the time. If the test is a success, the product qualifies for production and eventual shipment to the customer.
5.After six months, retrieve a few units and repeat steps 2 and 3. A plot can then be made of percentage of failures versus time and can be extrapolated to determine whether the guaranteed lifetime is met.
481
Management consulting
Quality function deployment (QFD). QFD can be used to capture the voice of the customer at the customer–marketing–design interface for new products and services. The objectives of QFD are to:
●determine the customer’s requirements and expectations before conceptual design is translated into prototype design;
●let the customer rate each requirement in terms of importance and the organization’s performance versus that of its best competitors;
●determine the important, difficult and new aspects of the design based on the “house of quality” matrix;
●deploy product specifications into part specifications, process specifications and production specifications, using similar “house of quality” matrices.
QFD has enabled organizations to design in half the time, with half the defects, half the costs, and half the staff of previous comparable designs. It can accurately evaluate customer complaints, effectively link customers, designers, manufacturers and suppliers, and quickly transfer knowledge to engineers. As a result, QFD greatly facilitates customer excitement and loyalty.
Total productive maintenance (TPM) is a system of maintenance covering the entire life of the equipment in every division, involving everyone from top executives to the shop-floor workers. It involves promoting productive maintenance through morale-building, management and small-group activities in an effort to maximize equipment efficiency. In simple terms, TPM uses plant capability to its fullest extent by reducing equipment stoppages, enhancing equipment capability, and improving safety, health, and environmental factors in the expectation that such improvements will contribute to better quality and higher profits.
TPM is also a tool for changing an organizational culture that tolerates maintenance costs of between 9 and 15 per cent of sales, and that adopts the mentality “if it ain’t broke, don’t fix it”. Maintenance personnel in 50 per cent of plants in the United States still spend more than half their time fixing problems instead of preventing them. TPM aims to radically improve process and equipment quality and productivity, increase plant throughput, reduce cycle time and inventories, and establish worker maintenance teams for preventing, not correcting, equipment problems.
Benchmarking. In benchmarking, organizations learn and adapt from the best companies to improve manufacturing and services. In TQM the process of benchmarking is similar to that described in Chapter 20 among the approaches to productivity improvement.
Poka-yoke. This tool eliminates operator-controllable errors, thereby improving the performance of manufacturing line operators. The objectives of poka-yoke are to provide sensors – electrical, mechanical or visual – that warn an operator that a mistake has been made or, preferably, is about to be made and can be avoided. Its benefits include direct, fast and non-threatening feedback to the operator, virtual elimination of the need for statistical process control, higher
482