

5 Rectum |
69 |
|
|
5.3\ DWI for Tumour Restaging After Chemoradiotherapy
5.3.1\ DWI for Tumour Response Assessment
Interestingly, the vast majority of papers that were published in recent years on DWI in rectal cancer focussed on its use for assessment of tumour response to neoadjuvant chemoradiation treatment. This striking focus on response evaluation can probably be explained by the fact that we are currently witnessing a paradigm shift towards less invasive treatments in rectal cancer patients who show a very good response to neoadjuvant chemoradiotherapy. Patients with only a small tumour remnant after CRT may be treated with a local excision of the tumour remnant instead of total mesorectal excision [17]. Moreover, trials from Brazil, Denmark, the Netherlands and the USA have shown that in patients with a complete tumour regression after CRT, a nonoperative management with stringent follow-up (‘wait- and-see’) may be considered as an alternative to surgery with comparable survival outcomes [18–21]. This shift in treatment makes response evaluation an increasingly relevant issue. Morphological MRI has limited accuracy for re-evaluation of the tumour stage after neoadjuvant treatment. In a meta-analysis, reported pooled specificity for T-staging after CRT was 91%, but sensitivity was only 50%. Particularly the sensitivity to differentiate between a complete tumour response and residual tumour was very low (19%) [22]. The main problem is the evaluation of fibrosis after CRT. As a result of radiotherapy, tumours undergo fibrotic changes which appear hypointense on T2-weighted MRI. In these hypointense areas, it can be very difficult to discern small areas of viable residual tumour. There is increasing evidence that DWI can help in these cases and aid to improve the performance of MRI for tumour restaging after CRT.
There are several ways DWI can be used to assess response (Fig. 5.4). The first and most basic approach is to visually assess DWI post-treatment and determine if a high signal remains present within the bowel wall at the site of the tumour. Such a visual assessment has been shown to improve the performance of MRI to discriminate patients with residual tumour from patients with a complete response [23–25]. In the previously described meta-analysis, pooled sensitivity for studies that used DWI for tumour restaging was 84% compared to 50% for standard MRI [22].
The second and so far most often studied approach is to quantitatively measure the tumoural ADC and determine how it changes as a result of treatment. Tumour ADC values typically increase as a result of CRT. This rise in ADC is believed to be caused by a loss of cell membrane integrity, i.e. necrosis. As a late result of CRT, irreparable cell loss will occur, which enlarges the interstitial space leading to increased room for water diffusion and thus increased ADC values [26]. Some groups have reported an initial steep rise in ADC early, i.e. 1–2 weeks, after initiation of treatment, which is believed to be related to tumoural oedema caused by an inflammatory response due to the sudden release of vascular endothelial growth
70 |
D. M. J. Lambregts and R. G. H. Beets-Tan |
|
|
a |
b |
c |
d |
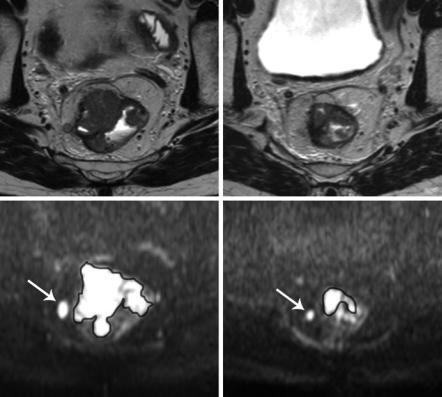
Fig. 5.4 T2-weighted (a, b) and corresponding high b-value diffusion-weighted (c, d) images of a male patient with a tumour in the mid-rectum imaged before treatment (a, c) and 8 weeks after completion of chemoradiation (b, d). The volume of the tumour is delineated on the diffusion-weighted images to calculate the tumour volume and mean tumour ADC. At primary staging, the tumour mass shows clear high signal on DWI; the tumour volume was 10.4 cm3 and the mean ADC was 1.04 × 10⁻³ mm2/s. On the restaging scan, there is still a clear residual tumour mass visible on DWI (d). The tumour volume has decreased significantly (to 2.8 cm3), while the apparent diffusion coefficient increased to 1.32 × 10⁻³ mm2/s as a result of treatment. Note the perirectal lymph node (arrow) that also decreased in size as a result of treatment. After surgical resection, histopathology revealed a ypT3N0 tumour
factors [27, 28]. In most published reports, ADC was measured after completion of chemoradiation (typically after an interval of >6 weeks), and the relative change in ADC ( ADC) compared to the pretreatment ADC was calculated. Results for the use of ADC as a marker to assess response have so far been inconsistent. Some groups showed excellent results for post-treatment and ADC to discriminate between good and poor responders, while others found no significant results [27– 29]. These conflicting findings are probably also related to the fact that considerable variations in ADC can occur between studies and centres as a result of differences in MR hardware, scan protocols, measurement and post-processing methods. This urges the need for standardisation of protocols before use of ADC as a biomarker of response may be considered in daily practice.