


2 |
T. Metens and N. Papanikolaou |
|
|
1.2\ Basic Principles
1.2.1\ Formal Definition of Diffusion
Molecules are involved in a random thermal motion called the Brownian motion, according to the observation in 1827 by Robert Brown [1773–1858] of the erratic translation movement of pollen in water, a random movement with no net ensemble displacement. This situation was further studied in 1908 by Paul Langevin [1872– 1946] [2] and by Albert Einstein [1879–1955] [3]. This microscopic movement is due to thermal agitation and occurs for water molecules in a bath of pure water (self- diffusion) or a viscous liquid medium.
For the free three-dimensional diffusion, considering the Brownian motion under thermal agitation, Albert Einstein derived in 1905 the relation between the mean quadratic displacement, the diffusion coefficient and the diffusion time t:
\ |
r2 |
= 6Dt \ |
(1.1) |
|
|
|
In other words, starting from a position r0 after a time t, the particles reach a standard deviation position located on the surface of a sphere of radius (6Dt)1/2. The value of the diffusion coefficient D depends on the temperature T and the friction F (that is proportional to the viscosity) of the medium.
In living tissues, diffusion is restricted by many other factors like intracellular metabolites, the presence of cell membranes, the extracellular architecture, the relative size of cells and extracellular compartment. Therefore, the measured diffusion coefficient is called apparent diffusion coefficient (ADC). The apparent diffusion coefficient value is in general reduced if cells expand because of cytotoxic oedema or when the cell density is more elevated, like in most malignant tissues. The link between the ADC and tissue cellularity seems quite complex and is still under investigation [4].
In some highly organized tissues, anatomically wise water diffusion can be spatially restricted by the presence of ordered structures. Therefore, diffusion becomes anisotropic where the mathematical description requires a diffusion tensor D to be introduced. However, in the gastrointestinal tract, the majority of studies deal with the isotropic part of the diffusion tensor, i.e. the average diffusion measured in three orthogonal directions, called the average diffusivity or the mean diffusion. In what follows we shall simply refer to it as the diffusion coefficient.
1.2.2\ Pulse Sequence Considerations
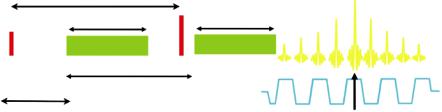
Following the seminal works on MR and diffusion by H. Carr and E. Purcell (1954) [5], H. Torrey (1956) [6] and D. Woessner (1961) [7], in 1965, E. Stejskal and J. Tanner [8] showed that the MR signal can be made sensitive to diffusion by the addition of supplementary gradients, called diffusion gradients (Fig. 1.1). Diffusing spins (moving spins) travelling at least partially along the direction of the diffusion gradients will accumulate a net dephasing, and this results into a signal attenuation,
1 DWI Techniques and Methods for GI Tract Imaging |
3 |
|
|
while stationary spins will be identically dephased and rephased with no signal loss. The Stejskal-Tanner gradients are used within a spin-echo echo-planar imaging (SE-EPI) sequence, allowing to acquire diffusion-weighted images (DWI). The signal of the SE Stejskal-Tanner sequence can be calculated as
\ |
S (TE) = S (TE = 0, b = 0)e-TE / T2 e-bD \ |
(1.2) |
|
|
|
|
|
|
with the diffusion control parameter b (in s/mm2): |
|
|
\ |
b = (g Gd )2 (D - d / 3) |
\ |
(1.3) |
γ being the proton gyromagnetic ratio, G the gradient amplitude, |
|
||
|
the delay |
||
between successive diffusion gradients and δ the duration of the diffusion gradients. The signal of the Stejskal-Tanner sequence is thus both T2 weighted and diffusion weighted; the b factor controls the diffusion weighting, and TE controls the T2 weighting (Fig. 1.2). The product of the two exponential attenuations explains the inherent low signal-to-noise ratio (SNR) of DWI; the spatial resolution is generally kept low in order to compensate for the otherwise low SNR.
Equation (1.2) accounts for diffusion in one specific direction in space and shows that increased water mobility results in substantial signal attenuation on diffusion- weighted images. Conversely, water molecules with reduced mobility will present with significantly lower signal attenuation compared to water molecules with increased mobility leading to a relative higher signal on high b value images. We emphasize that the signal intensity in DW images is not only affected by the b factor and the diffusion of water but also by the T2 and T2* relaxation time of the tissues because the Stejskal-Tanner diffusion “carrying sequence” is an SE-EPI. In a tissue with a long T2 relaxation coefficient, a relatively high signal intensity can be maintained mimicking restricted diffusion patterns, the so-called “T2 shine-through” effect. On the contrary, a tissue with a very low T2 value will appear dark, the socalled T2 shading effect. It is important to avoid such confusion by comparing DW images with T2-weighted images.
TE/2 |
|
d |
d |
G |
G |
90° |
180° |
t |
|
|
TE |
Fig. 1.1 Stejskal-Tanner SE diffusion sequence with EPI reading (only the diffusion-sensitized gradients are shown in green; these gradients are aligned along one spatial direction. G is the gradient amplitude, is the delay between successive diffusion gradients and δ is the duration of the diffusion gradients; the 90° and 180° RF pulses are used to generate a spin echo in order to minimize T2* effects. Note that after the 180 RF pulse, the effective gradient sign is changed
4 |
|
|
T. Metens and N. Papanikolaou |
|
|
|
|
a |
b |
c |
d |
e |
f |
g |
h |
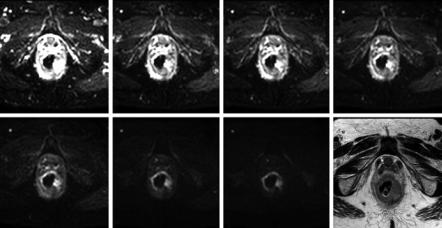
Fig. 1.2 (a–h) DW images acquired at fixed TE with b = 0, 50, 100, 200, 500, 1000 and 1500 s/ mm2 showing various degrees of diffusion weighting in a patient with rectal cancer. Note that the tumoural areas are preserving high signal intensities on the high b value images. Axial T2w TSE image on the same level with diffusion is shown as a reference
In many clinical situations, visual interpretation of DW images is not enough and further quantification of ADC is considered mandatory. This calculation involves at least the acquisition of two signals S1 and S2 from acquisitions with different b factors, i.e. b1 and b2 factors, and by computing
\ |
ADC = Ln(S1 / S2) / (b2 - b1 ) \ |
(1.4) |
|
|
If more than two b value images are involved, a linear regression of the logarithms Ln[S(b)/S(0)] in function of the b values will provide the ADC value (i.e. slope of the regression line). When this is performed for each pixel, a calculated image of the ADC, called the ADC map, is reconstructed. Generally the ADC map can be reconstructed by considering one or a combination of several diffusion directions and several b values, while the correct choice of the regression points is influencing the final ADC value. The calculated numerical ADC value depends on many parameters, and therefore we emphasize the “apparent” denomination.
The diffusion sequence must be repeated using diffusion gradients oriented in at least three orthogonal directions. The geometric mean of three orthogonal diffusion- weighted images with the same b amplitude gives the isotropic diffusion image (where directional effects have been eliminated by definition):
\ |
I (b) = S(0)e –(bxx Dxx +byy Dyy +bzz Dzz )/3 |
= S(0)e – b( Dxx + Dyy + Dzz )/3 |
= S(0)e – bMD \ (1.5) |
|
|
|
The derivation of Eq. (1.2) is based on the hypothesis that the diffusion is the single source of intravoxel incoherent motion (IVIM). However, in highly perfused tissues, micro-perfusion represents another potential source of IVIM: the blood flow appears indeed random as it follows the randomly oriented capillaries, and during the
1 DWI Techniques and Methods for GI Tract Imaging |
5 |
|
|
diffusion time, spins in the capillary blood flow might have changed their direction several times, or different spins will flow along different directions in differently oriented capillaries. This micro-perfusion phenomenon constitutes a pseudo-diffusion movement and will be discussed in detail below. Another complication arises from the fact that the pixel size in DWI is large compared to the various tissue compartments with different diffusivity and partial volume effects might result, again justifying the apparent character of the diffusion coefficient measured in tissue.
The Stejskal-Tanner SE-EPI sequence is acquired using a single EPI echo train, providing an image in the so-called “single-shot” mode. In a segmented acquisition (multi-shot mode), the signal phase of the different k-space segments can interfere destructively causing an irremediable signal loss in the final image. This severe segmental dephasing occurs in the strong diffusion gradients because of several physiologic factors like heart pulsation and organ movement occurring in between consecutive k-space segments acquisitions. Segmented approaches are possible but require adequate phase corrections that are often difficult to be implemented. The SE-EPI sequence requires fat suppression to avoid the large water-fat shift in the EPI phase encoding direction. Moreover, T2* image blurring and spatial distortions due to the high EPI echo train length (ETL)-related artefacts are mostly present in the phase encoding direction (Fig. 1.3).
The spatial resolution of abdominal clinical DW imaging is in general relatively lower comparing to that of conventional MRI sequences like T1 or T2. However, multichannel high-density torso coils are nowadays available and allow the use of parallel imaging with high acceleration factors to minimize geometric distortions and T2* blurring (Fig. 1.4). High b value images suffer from poor SNR, and therefore more averages than in the low b values may be acquired to compensate for the limited signal. Depending on several factors including coil characteristics, phase encoding direction, size and shape of the object of interest, static magnetic field
Fig. 1.3 DW images acquired at 3 T with b 10 s/mm2 with phase encoding in the anterior to posterior direction (left) and in the left to right direction (right); the red arrows indicate the corresponding EPI spatial distortions that are pronounced on the stomach due to air presence