

ManualOperator
.pdfTides and Tidal Currents
•Use the right-click menu on selected gauge and choose Tide Properties
•Or double click on a selected gauge with the Select tool
•The Tide Properties dialog consists in two parts with Tide Table and the appropriate graph. Related topic for more information on Tides Properties Graph
Note: the reference stations is displayed in double width pen style, whereas the secondary stations is displayed in single width pen style.
Getting Information on Tidal Current Data
 click the Tides & Currents information arrow and choose a Tidal Current layer in the corresponding drop-down menu. Show and hide tidal current vector arrows drawn on the chart in the same manner as Weather data layers.
This will display yellow rectangles outlined on chart that show the presence of tidal currents data (for high scales) . To bring up tidal current arrows right-click on one of yellow rectangle outlined and choose a scale under the menu. For lower scales, currents are represented by arrows.
Tidal currents legend :
219

MaxSea Operator Manual version 12.6
Yellow rectangles outlined on chart display the location of Tidal current data.
 Arrows become yellow squares for values less than 0.1 knots, we are between ebb and flow, the current direction may change rapidly.
 0.1 knot > 3.0 knots
Show / Hide Tidal Height Data
To display Tidal Height information :
1 - Go to the [Display] menu and choose [Tides & Current], this will bring up the "Tides & Current" window which gives information of the display on the nearest tide station to your present location.
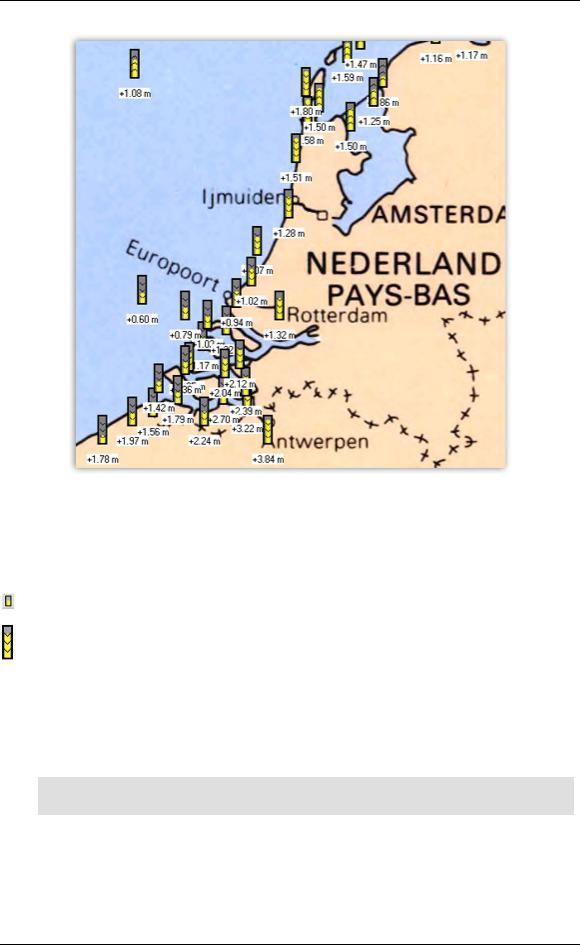
2 - Display Tides gauges on chart for each location. To access this data click on the "Tide & Current" button in the Chart toolbar. The Tidal height icon becomes selected and this brings up the tide gauges on the chart as shown below.
220
Tides and Tidal Currents
The tidal height function is used to display the tide for the main ports of the world.
The tidal height display depends from the chart scale :
From scale 1: 250 M to 1: 2.5 M, tide and current station are represented by fixed shape symbols:
From scale 1: 1 M to 1: 500 000, only reference station is shown:

 From scale 1: 250 000 to 1: 500, both reference and secondary station are shown:
.
Note: every gauges come along with a label indicating the height of the tide. The unit is which one you have chosen in the program. For more information of changing all units defined in the program red paragraph about "Option: units..."
221

MaxSea Operator Manual version 12.6
Getting Information on Tidal Current Data
 click the Tides & Currents information arrow and choose a Tidal Current layer in the corresponding drop-down menu. Show and hide tidal current vector arrows drawn on the chart in the same manner as Weather data layers.
This will display yellow rectangles outlined on chart that show the presence of tidal currents data (for high scales) . To bring up tidal current arrows right-click on one of yellow rectangle outlined and choose a scale under the menu. For lower scales, currents are represented by arrows.
Tidal currents legend :
Yellow rectangles outlined on chart display the location of Tidal current data.
222

Tides and Tidal Currents
 Arrows become yellow squares for values less than 0.1 knots, we are between ebb and flow, the current direction may change rapidly.
 0.1 knot > 3.0 knots
Changing Tides Date & Time Prediction
Once the tide gauges display is on, you can change the date and the time of the tide gauge by left-clicking on the change date and time symbols on the layers toolbar.
1 - Changing time of the tide gauges displayed beginning with the current date
Jan. -17 -06 09 : 13
(1) |
(2) |
(3) |
Fig.1
•The default mode is the "Current time" as shown in Fig.1-1. In this mode, the tidal gauges are updated automatically each minute according to the computer clock.
•To move the time of the tide display by one hour increments, left-click on the decreased blue arrow or increased blue arrow . The Clock becomes surrounded in red and the time display beside the clock is updated.
Jan. -18 -06 09 : 13
•Apply a long click on arrows nearest blue arrow as shown in Fig.1-3 to pull down a menu from which you can choose different values for the display increment (-/+1h or -/+2h or -/+3h or -/+6h or -/+12h or -/+24h).
Note: to change between the "Current time" and " Select Date/time", the Clock icon in the layer tools bar displays the same date as the computer
2 - Changing time of the tide gauges displayed beginning with a chosen date
•Left-click on the clock from the Layers tools bar and choose Select Date/Time to open a specific window.
•The Clock becomes selected as shown above
•Check a date from the calendar and the date & time display beside the clock is automatically updated.
•To change the time of the tide display you can choose one hour increments, by clicking on the decreased (- 1h) or increased (+1h) symbol. The Clock becomes selected and the time display beside the clock is updated.
223

MaxSea Operator Manual version 12.6
•Click on the arrow beside the "-1h" or "+1h" icon to pull down a menu from which you can choose time display increment. (-/+1h or -/+2h or -/+3h or -/+6h or -/+12h or -/+24h).
Note that while the tide gauges respond to the change time, the tide/current display stays with the present time for the closest tide gauge.
Changing Tidal Current Date & Time Prediction
Once the tidal current display is on, you can choose between two ways to change the tidal current display time:
1 - Changing time of the tidal current display beginning from the current time
•The default mode is the "Current time". In this mode, the Current arrows are updated automatically each minute according to the computer clock.
Jan. -17 -06 09 : 13
(1) |
(2) |
(3) |
•To move the time tidal current data display by step of one hour simple left-click on one of each decreased ( blue Left arrow) or increased (blue right arrow) as shown in Fig.1-3. At this moment the Clock becomes surrounded in red and the time display beside the clock is updated.
Jan. -18 -06 09 : 13
•Left-click on the arrow beside one of each "blue Left arrow" and "blue right arrow" icon to pull down a menu from which you can choose different step values of the changing time display (-/+1h or -/+2h or -/+3h or -/+6h or -/+12h or -/+24h).
Note: to make the difference between the "Current time" mode and the " Select Date/time", the Clock icon in the layer tools bar becomes selected when the second option is chosen.
2 - Changing time of the tidal current display beginning from a chosen date
•Left-click on the clock from the Layers tools bar and choose Select Date/Time to open a specific window.
•Then check a date from the calendar. Then to change the time of the tidal current display select the step value between two choices. Select a step of one hour, by simple left-clicking on one of each decreased (-1h) or increased (+1h) symbol.
•Left-click on the arrow beside one of each "-1h" or "+1h" icon to pull down a menu from which you can choose different step value of the changing time display (-/+1h or -/+2h or -/+3h or -/+6h or -/+12h or -/+24h).
•At this moment the Clock becomes selected and the time display beside the clock is updated.
224

Tides and Tidal Currents
Note for example:you have chosen date value "January the 22 at 13:54:59" and time value (+6h). The next two layer tidal current data display are projected six and twelve hours forward from the current data (just to the left 13:54:59)
Tides Properties
Double left-click on any tide gauge to bring up Tides Properties dialog:
From the top of the window the name location, geographical location and the station identification number are displayed.
The height tide data information during 24 hours for each hour are indicated in the Tide table on right of the window and the same information are reported on a graph. By default the present tide gauge data appears selected in the table and a red line drawing on the graph indicated its position.
Bring up the Tide & Current window to obtain more information about the tide and current values, and the GMT time with the nearest reference harbor refer to related topic Tide & Current Window .
When you choose to display this window, it permanently appears in the chart window.
225

MaxSea Operator Manual version 12.6
Current Properties
Once the tidal current data display is on, you can use the finger tool to check any current arrow for data on it.
Simple left-click on any current arrow and maintain the mouse button down to bring up a screen tip which shows specific data :
• Speed (strength)
• Direction
• Location
• Data source name
Double left-click on any current arrow to bring up the tidal currents graph:
Upper left part of the window is reserved for information concerning the selected harbor (name,identification number of the station and its position with according to geographic position (latitude, longitude).
The tidal current data information (Strength and direction of the tidal current) during 24 hours for each hour are indicated in the Current table on right-hand of the window and same information are reported on a graph. By default the present tidal current data appears selected in the table and it is indicated with a red line on the graph.
Bring up the Tide & Current window to obtain more information about the tide and current values, and the GMT time with the nearest reference harbor refer to related topic Tide & Current Window .
226

Tides and Tidal Currents
When you choose to display this window, it permanently appears in the chart window.
Choosing the Active Tidal Current Data Layer
Tidal Currents Data are produced by different publishers such as Mapmedia or NOAA US Tidal Currents. Other type of Tidal current data can be contained in files of weather forecasts. You may choose which Tidal Current data you will use in your navigation calculations. According to your navigation, choose the type of the currents of tide which you wish to integrate into your calculations of follow-up of navigation. When you wish to calculate a routing for example, the route is calculated according to the Tidal Current Data layer you have chosen before.
To activate the Tidal Current Data Layer :
1.Click on the Tides & Current drop-down arrow in the Chart Toolbar,
2.Point to Active Current Data
3.Check which type of Current data layer you wish to activate
Next all calculations that need tides and currents data, will be added in your planning route.
Making and Opening Movies
You can make time-lapse movies of weather and tidal current stream under the software from the selected chart window. This movie includes chart current arrows.
To make a movie file under the software, first choose the Tidal current time at which you wish the movie to begin.
Next, from the [Edit] menu, select [Create a movie] and choose the time between each image.
•Day number (00d)
•Hour number (01h)
•Minute number (00mn)
•Second number (00s)
Note: one hour is the interval of time between two sequences of animation.
IMPORTANT - Generation of many image sequences requires enough free space on the hard disk. It is strongly advised to reduce the size of the window chart before generating movies.
1.Then, select the folder and the file name for which you want to save the movie as (easier to find later for playing).
2.Finally, select a type of compression format and click on OK (uncompressed format is selected by default). If you have chosen a compression format, you can adjust the quality or/and customize the video display.
The software automatically makes a movie ( in the "My documents" folder by default. This movie is defined on a period of 24 hour period, date and time are displayed in the right lower corner of the window movie.
Playing and controlling movies is easy. To play the movie, go to Windows Explorer and click on the Movie file (*.AVI).
227

MaxSea Operator Manual version 12.6
Click twice on the movie file to open the movie window (this will be done except the software).
|
From the movie player left-click on |
|
|
To do this: |
|
|
|
|
|
||
|
one of each button: |
|
|
|
|
|
|
|
|
|
|
|
PLAY |
|
Play the movie in a continuous loop |
||
|
|
|
|
||
|
PAUSE |
|
If you want to pause the movie at any point. Resume play with the Play |
||
|
|
|
|
Button |
|
|
|
|
|
||
|
STOP |
|
Stop the movie at any point |
||
|
|
|
|
|
|
Click twice on the movie file to open the movie window (this will be done except the software).
Play the movie as often as you wish to get a feel for the rhythm of the tidal currents moving. After the movie has been paused, you can control it by dragging the "Seek bar" left or right to study the movement more carefully (forward and back in the file).
228