

20.7.4 Noise due to unlinearity
When carrying a traffic channel load the unlinear transfer characteristic of the active devices in the system generate harmonics and more complex intermodulation products that very quickly take on the characteristics of gaussian noise.
This noise source is referred to as intermodulation or cross modulation noise.
The initial problem is to define the power presented to the system by speech traffic.
20.7.4.1 Single channel load
The average power in each channel of a transmission band carrying normal 'busy hour' speech traffic referred to a OdBr point of measurement is Lo (dBmO) as in Equation 20.7 (Bell, 1971), where Pvo is the long term average power in a single talker dBmO, g is the standard deviation of the distribution of talker volumes and t is the traffic activity factor.
![]()
Single talker volume (Pyo)
This is the power in dBmO of a continuous individual talker measured using a long term averaging meter (10 seconds) at a OdBr point. This includes power due to signalling frequencies.
The precise value for P has been the subject of much measurement and study over the years. The UK figure used for trunk networks is -12.9dBmO. In the Bell System a figure of-13.9dBmO has been adopted for International use. (Most of the figures have been derived from Holbrook and Dixon, 1939.)
Loud and soft talker factor (0.115g2)
P is the average power in an individual talker. However, analysing a large number of talkers will show that they all have different volumes compared to the standard talker i.e. there are loud and soft talkers.
The distribution of the talker volumes (in dB) has been found to be Normal, with a standard deviation of g. (Figure 20.10(a).)
In order to find the average power per talker from a distribution of talker volumes the average or expected value is derived from the log normal distribution (see Figure 20.10(b)). This derives that the average power per talker over a large number of talkers is 0.115g greater than the average power of a single talker. (Bennett, 1940)
20.7.4.2 Multichannel load
The average traffic power Pn in a multichannel load of N channels is given by Equation 20.8, where N a 240, assuming that a single channel load figure is given by the -15dBmO value in Table 20.6.
![]()
For N < 240 the statistics of the activity factor dictate that a slightly higher value for the average load should be used. A best fit curve is given by Equation 20.9 (CCITT, 1985).
![]()
20.7.4.3 Unlinearily characterisation
For a sinusoid fundamental signal at the output of a typical amplifier, the output power of the second and third harmonics would appear as in Figure 20.11. In order to calculate the effect of the unlinearity on the transmission it is necessary to be able to quantify the harmonics and associated intermodulation products.
At the overload point, or clipping region, the harmonics increase very rapidly with increasing fundamental level and the characterisation of harmonic performance of the amplifier in this region is not practical.
As the output level is reduced and moves out of the overload region, the shape of the harmonic curve passes the knee and enters a linear portion of the graph where the second harmonic level reduces by 2dB and the third harmonic by 3db for every ldB drop in fundamental signal. The harmonic performance is characterised in this region.
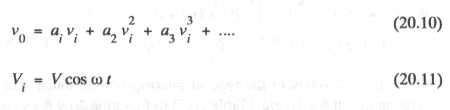
If the amplifier transfer characteristics in the 'linear' region are assumed to be a square law, Equation 20.10 is obtained, where v is the input voltage, given by Equation 20.11, v is the output voltage, and a , a , a are constants of the amplifier.
Activity factor (1 (Nog t)
Not all the channels are fully occupied with continuous talkers. This gives rise to an activity factor t.
Conversation between two parties consist of 50% listening and 50% talking. The activity in any one direction is therefore 0.5.
In addition not all of the channels are in use. Even in the peak period only 70% of the circuits are occupied at any one time. The activity factor t is therefore reduced to 0.35. The figure normally used for t is 0.25.
Values for Lo, Pyo, g and t are given in Table 20.6. (CCITT, 1985; Bell, 1971.)
From this transfer characteristic Equations 20.12 and 20.13 may be obtained.
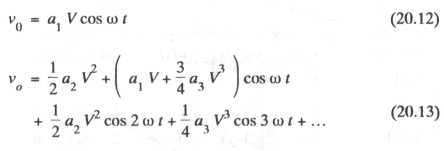
Thus the second harmonic (cos 2 to /) is proportional to the square of input signal amplitude V. Likewise the third harmonic (cos 3 co () is proportional to the cube of the input signal amplitude.
In dB terms it can be shown (Bell, 1971) that at a transmission level of OdBmO the power in a sinusoidal harmonic or intermodu-lation tone, P (x) in dBmO, at the amplifier output is related to the output level of the fundamental tones A and B by Equations 20.14 to 20.18, where P (x) is the harmonic or intermodulation power in dBmO, P(x) is the fundamental power in dBmO, H and Hv are the second and third harmonic powers in dBmO, characterised for the amplifier with fundamentals at OdBmO. (Figure 20.11.)
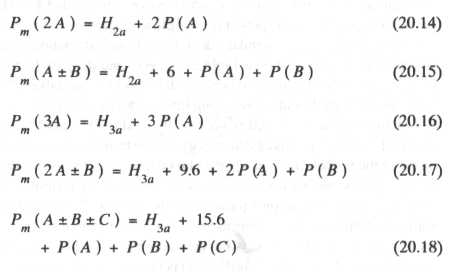
Thus, once H and H have been determined by measurement, all the second and third order intermodulation products can be deduced for a specific transmission level.