

узи сосудов шеи
.pdfRadioGraphics
EDUCATION EXHIBIT |
1561 |
Sonographic
Examination of the
Carotid Arteries1
Hamid R. Tahmasebpour, BSc, RDMS ● Anne R. Buckley, MD ● Peter L. Cooperberg, MD ● Cathy H. Fix, RDMS
Ultrasonography (US) of the carotid arteries is a common imaging study performed for diagnosis of carotid artery disease. In the United States, carotid US may be the only diagnostic imaging modality performed before carotid endarterectomy. Therefore, the information obtained with carotid US must be reliable and reproducible. Technical parameters that can affect the accuracy of carotid US results include the Doppler angle, sample volume box, color Doppler sampling window, color velocity scale, and color gain. Important factors in diagnosis of atherosclerotic disease of the extracranial carotid arteries are the in- tima-media thickness, plaque morphology, criteria for grading stenosis, limiting factors such as the presence of dissection or cardiac abnormalities, distinction between near occlusion and total occlusion, and the presence of a subclavian steal. Challenges to the consistency of carotid US results may include lack of a standard protocol, poor Doppler technique, inexperience in interpretation of hemodynamic changes reflected in the Doppler waveform, artifacts, and physical challenges. Hindrances in the classification of problematic carotid artery stenoses may be overcome by following a standard protocol and optimizing scanning techniques and Doppler settings.
©RSNA, 2005
Abbreviations: CCA common carotid artery, ECA external carotid artery, ICA internal carotid artery, PSV peak systolic velocity, PW pulsed wave
RadioGraphics 2005; 25:1561–1575 ● Published online 10.1148/rg.256045013 ● Content Codes: 


1From the Department of Radiology, St Paul’s Hospital, 1081 Burrard St, Vancouver, BC, Canada V6Z 1Y6 (H.R.T., P.L.C., C.H.F.); the Department of Radiology, Faculty of Medicine, University of British Columbia, Vancouver, BC, Canada (H.R.T.); and the Department of Radiology, Vancouver General Hospital, Vancouver, BC, Canada (A.R.B.). Recipient of a Certificate of Merit award and an Excellence in Design award for an education exhibit at the 2003 RSNA Annual Meeting. Received February 2, 2004; revision requested March 29; final revision received May 18, 2005; accepted May 20. All authors have no financial relationships to disclose. Address correspondence to H.R.T. (e-mail: htahmasebpour@yahoo.ca).
©RSNA, 2005

RadioGraphics
1562 November-December 2005 |
RG f Volume 25 ● Number 6 |
Introduction
Cerebrovascular disease (stroke) is the third leading cause of death in the United States, accounting for approximately 400,000 new cases diagnosed each year and over 163,000 deaths in 2002
(1). Ultrasonography (US) of the carotid arteries is the modality of choice for triage, diagnosis, and monitoring of cases of atheromatous disease. This is an operator-dependent examination that requires a good understanding of Doppler physics and hemodynamic physiology. The accuracy of carotid US hinges on following standard guidelines and practicing meticulous scanning techniques. There are several pitfalls that may mislead the operator to falsely interpret color and spectral Doppler findings.
In this article, we discuss standard guidelines for carotid US, optimal scanning techniques and Doppler settings, and US diagnosis of extracranial atherosclerotic carotid disease, including characteristic gray-scale, color, and spectral Doppler appearances as well as operatorand patient-related pitfalls.
Standard Protocol
Our suggested protocol may be modified by each institution with respect to their clinical settings and requirements.
Patient Position
The patient may lie down in the supine or semisupine position with the head slightly hyperextended and rotated 45° away from the side being examined.
Transducer
Higher-frequency linear transducers ( 7 MHz) are ideal for assessment of the intima-media thickness and plaque morphology, while lowerfrequency linear transducers ( 7 MHz) are preferred for Doppler examination. In a short muscular neck, if imaging with a linear transducer is impossible, a curved-array transducer ( 7 MHz)
may be helpful to document the anatomy of the carotid bifurcation with color Doppler US.
Imaging
The extent, location, and characteristics of atherosclerotic plaque in the common carotid artery (CCA) and internal carotid artery (ICA) should be documented with gray-scale imaging. The vessels should be imaged as completely as possible, with caudal angulation of the transducer in the supraclavicular region and cephalic angulation at the level of the mandible. Color Doppler imaging should be performed to detect areas of abnormal blood flow that require Doppler spectral analysis. Pulsed wave (PW) Doppler spectral analysis should be performed, and the velocity of blood flow in the mid-CCA and proximal ICA as well as proximal to, at, and immediately distal to the diseased areas should be measured (2). Evaluation of the external carotid artery (ECA) should be performed, as it is a source of bruit and differences in the Doppler appearance of the ECA and ICA improve observer confidence that the bifurcation vessels have been correctly identified. Color and PW Doppler imaging of both vertebral arteries should also be performed to rule out the presence of a subclavian steal. The topography of the plaque, velocity information, and interpretation of the results by the radiologist can be conveniently recorded in a standardized format (Fig 1).
Limitations
Physical challenges such as a short muscular neck, a high carotid bifurcation, tortuous vessels, calcified shadowing plaques, tracheostomy tubes, surgical sutures, postoperative hematoma or bandages, central lines, inability to lie flat in respiratory or cardiac disease or to rotate the head in patients with arthritis, and uncooperative patients may limit the results of carotid US examination.
Optimal Scanning Techniques and Doppler Settings
Doppler Equation
US equipment calculates the velocity of blood flow according to the Doppler equation:
f 2f0 V cos ,
C

RG f Volume 25 ● Number 6 |
Tahmasebpour et al 1563 |
RadioGraphics
|
Figure 1. Suggested format for docu- |
|
mentation of the results of carotid US. |
|
Graphic representation of the plaque is |
|
important for follow-up examinations. |
|
EDV end-diastolic velocity, ID identi- |
|
fication, LT left, N/A not applicable, |
|
PSV peak systolic velocity, RT right, |
|
VA vertebral artery. |
where f is the Doppler shift frequency, f0 is the |
rotid arteries may vary from one patient to an- |
transmitted ultrasound frequency, V is the veloc- |
other; therefore, the operator is required to align |
ity of reflectors (red blood cells), (theta, also |
the Doppler angle parallel to the vector of blood |
referred to as the Doppler angle) is the angle be- |
flow by applying the angle correction or angling |
tween the transmitted beam and the direction of |
the transducer. |
blood flow within the blood vessel (the reflector |
Sample Volume Box |
path), and C is the speed of sound in the tissue |
|
(1540 m/sec). Since the transmitted ultrasound |
and Angle Correction |
frequency and the speed of sound in the tissue are |
The US machine calculates the velocity from the |
assumed to be constant during the Doppler sam- |
Doppler shift frequency reflected from red blood |
pling, the Doppler shift frequency is directly pro- |
cells within the sample volume box. In most |
portional to the velocity of red blood cells and the |
cases, sonographers will experience some uncer- |
cosine of the Doppler angle (3). |
tainties in estimating the flow angle and position- |
Doppler Angle |
ing the sample volume box. If the Doppler angle |
is small ( 50°), this uncertainty leads to only a |
|
The angle affects the detected Doppler frequen- |
small error in the estimated velocity. If Doppler |
cies. At a Doppler angle of 0°, the maximum |
angles of 50° or greater are required, then precise |
Doppler shift will be achieved since the cosine of |
adjustment of the angle correct cursor is crucial to |
0° is 1. Conversely, no Doppler shift (no flow) |
avoid large errors in the estimated velocities (3,4). |
will be recorded if the Doppler angle is 90° since |
|
the cosine of 90° is 0. The orientation of the ca- |
|
RadioGraphics
1564 November-December 2005 |
RG f Volume 25 ● Number 6 |
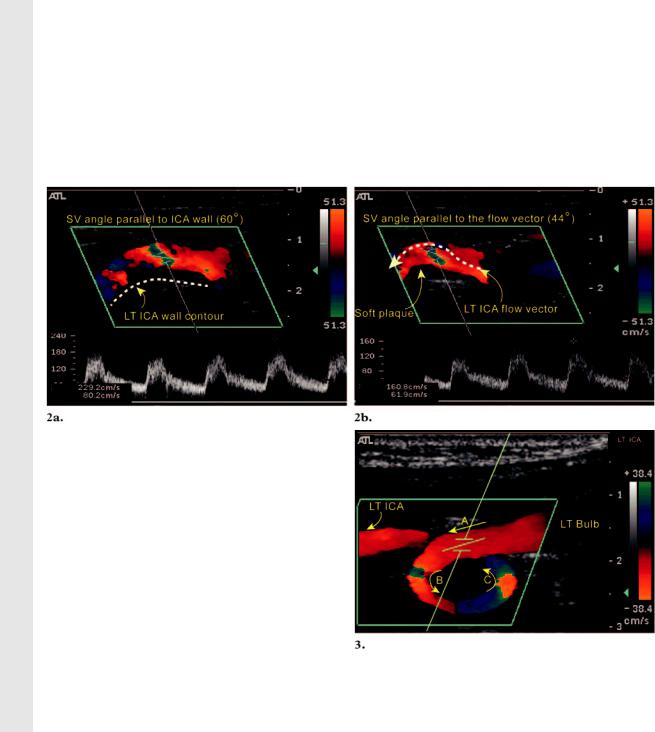
Figures 2, 3. (2) Location and angle of the sample volume in a diseased ICA with soft plaque. LT left, SV sample volume. (a) Color Doppler image shows the sample volume angle incorrectly aligned with the wall contour of the ICA. The PSV reading in the ICA is 229 cm/sec, resulting in overestimation of the degree of stenosis as more than 70%. (b) Color Doppler image shows the sample volume angle correctly aligned with the flow vector (the contour of the soft plaque). The resultant PSV reading in the ICA is 161 cm/sec; thus, the degree of stenosis was reclassified as 50%– 69%. (3) Location of the sample volume box in a tortuous artery. Color Doppler image shows a tortuous left (LT) ICA. The change in the color depiction of the ICA is not due to a change in blood flow velocity but instead reflects changing direction of the blood flow relative to the Doppler angle of incidence. To sample the velocities at points B and C, the color box and angle of incidence require operator correction of the Doppler angle of incidence by steering the color box or angling the transducer. In this case, the correct position of the sample volume box is at point A.
The Doppler angle should not exceed 60°, as measurements are likely to be inaccurate. Our preferred angle of incidence is 45° 4. Consistent use of a matching Doppler angle of incidence for velocity measurements in the CCA and ICA reduces errors in velocity measurements attributable to variation in . Incorrect assignment of the Doppler angle of incidence with the direction of blood flow is a common source of operator error. The optimal position of the sample volume
box in a normal artery is in the mid lumen parallel to the vessel wall, whereas in a diseased vessel it should be aligned parallel to the direction of blood flow (Fig 2). In the absence of plaque disease, the sample volume box should not be placed on the sharp curves of a tortuous artery, as this may result in a falsely high velocity reading (Fig 3). If the sample volume box is located too close to the vessel wall, artificial spectral broadening is inevitable.
Spectral Broadening
Spectral broadening results from turbulence in the blood flow. Spurious spectral broadening can result from a large Doppler angle, a large sample
volume box ( 3.5 mm), a sample volume box located close to the vessel wall, or a high PW Doppler gain setting. The size of the sample volume box (also known as the gate) is normally kept between 2 and 3 mm. If the gate is too small ( 1.5 mm), the Doppler signal may be missed. Increasing the gate is helpful in searching for trickle flow or trying to obtain a Doppler signal behind a shadowing calcified plaque.
Color Doppler Parameters
Color is a display of the reflected Doppler frequencies from red blood cells.
RadioGraphics
RG f Volume 25 ● Number 6 |
Tahmasebpour et al 1565 |
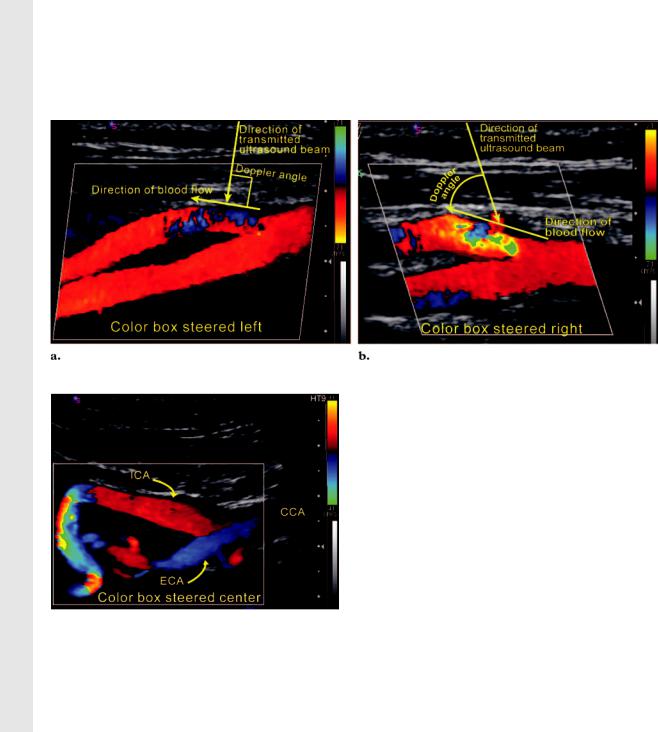
Figure 4. Adjustment of the color Doppler sampling window. (a) Color Doppler image shows that the leftward position of the color Doppler sampling window results in a poor Doppler angle of incidence to the direction of blood flow in the proximal ECA. The result of an angle of incidence of almost 90° is ambiguous color display in this segment of the ECA. (b) Color Doppler image shows that correcting the angle of incidence by changing the position of the color Doppler sampling window or angling the transducer improves depiction of this area and is crucial for accurate velocity measurements.
Figure 5. Adjustment of the color Doppler sampling window in a tortuous ICA. Color Doppler image shows the color Doppler sampling window steered to the “center” or “straight” position to increase color sensitivity in those segments of the artery that subtend angles of more than 60° to the Doppler beam. Red and blue regions represent blood flow toward and away from the transducer, respectively.
Color Doppler Sampling Window.—The color Doppler sampling window (also known as the color box) is positioned over the artery to be interrogated. The size of the color Doppler sampling window is adjusted to include all regions of interest. Adjustment of the angle of incidence can be achieved by changing pre-set color box angles from left to center or right, as well as angling the
transducer to ensure that the Doppler angle of incidence is less than 60° to the direction of blood flow (Figs 4, 5).
Color Velocity Scale Control.—The color velocity scale is the most important parameter of the carotid US color Doppler setup. The color velocity scale is an operator-defined range of velocities that requires adjustment, analogous to the window width and level of a gray-scale image. It is not synonymous with the pulse repetition frequency (PRF), but the PRF is related to the velocity scale setting, so that increasing the velocity scale increases the PRF and vice versa (3,5–7). The image frame rate may appear slow if a very low color velocity scale is applied, since the PRF decreases and the time between transmit pulses in a pulse packet increases (3).
If the velocity of blood flow exceeds 1⁄2 the PRF (Nyquist limit), then the direction and velocity are inaccurately displayed and flow appears to change direction (aliasing). Aliasing can be advantageously used to demonstrate high or low flow and turbulence. If the color velocity scale is set below the mean velocity of blood flow, aliasing throughout the vessel lumen makes it impossible
1566 November-December 2005 |
RG f Volume 25 ● Number 6 |
RadioGraphics
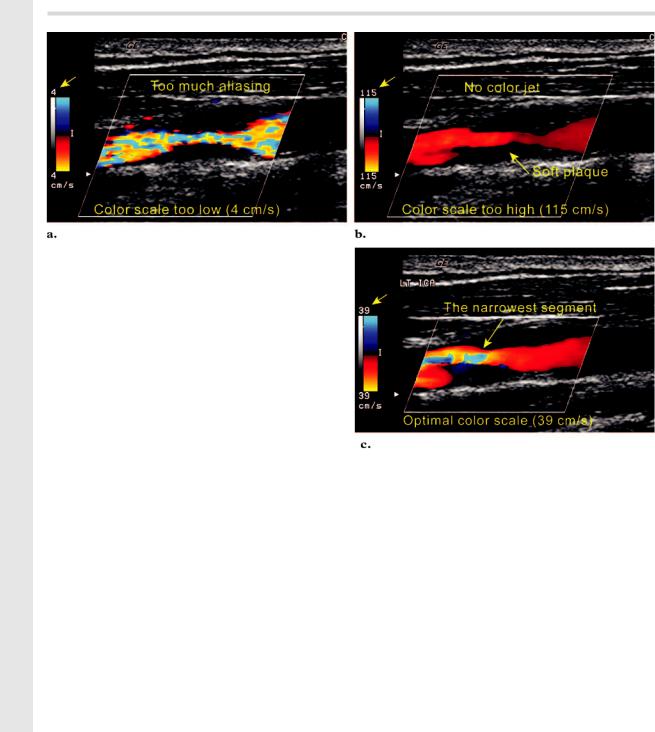
Figure 6. Adjustment of the color scale in a carotid artery stenosis. (a) Color Doppler image obtained with the color scale set too low (4 cm/sec) shows aliasing in the entire segment of the ICA. (b) Color Doppler image obtained with the color scale set too high (115 cm/sec) shows no aliasing. (c) Color Doppler image obtained with the optimal color scale setting shows the region of highest velocity, which corresponds to the narrowest segment of the ICA. Velocity sampling should be performed at this site.
to identify the high-velocity turbulent color jet |
|
associated with a tight stenosis. Conversely, if the |
|
color velocity scale is set significantly higher than |
|
the mean velocity of blood flow, aliasing may dis- |
|
appear, resulting in a missed stenosis (Fig 6). |
ever, the color velocity scale should be shifted up |
In a near occlusion, blood flow velocity may be |
or down according to the mean velocity of blood |
slower than the usual color velocity scale range |
flow to demonstrate aliasing only in systole. |
thresholds, resulting in a false-positive appear- |
|
ance of an occlusion. In this setting, the area of |
Color Gain Control.—The color gain should be |
interest should be re-evaluated by using very low |
set so that color just reaches the intimal surface of |
color velocity settings ( 15 cm/sec) to enhance |
the vessel. If the color gain setting is too low, |
detection of trickle flow in a near occlusion (Fig |
trickle flow may go undetected. If a high color |
7). If this setting does not reveal detectable flow, |
gain setting is applied, “bleeding” of the color |
contrast material– enhanced imaging (computed |
into the wall and surrounding tissues may limit |
tomographic [CT] angiography, gadolinium-en- |
visualization of the plaque surface and may result |
hanced magnetic resonance [MR] angiography, |
in misalignment of the angle correction with the |
or conventional angiography) may be required to |
direction of blood flow during a PW Doppler ex- |
differentiate near occlusion from total occlusion |
amination (Fig 8). Although measurement of the |
(8,9). |
intima-media thickness and the initial survey |
In a normal carotid US examination, the color |
should always be performed on a gray-scale im- |
velocity scale should be set between 30 and 40 |
age, color bleeding artifact may mask the eddy |
cm/sec (mean velocity). In a diseased artery, how- |
flow at the surface of an ulcerated plaque. |
|
Other Doppler Parameters.—The manufac- |
|
turer’s guidelines should be followed for other |
|
Doppler parameters such as color threshold, color |
|
persistence, baseline, wall filter, and PW Doppler |
|
scale and gain. |
RG f Volume 25 ● Number 6 |
Tahmasebpour et al 1567 |
RadioGraphics
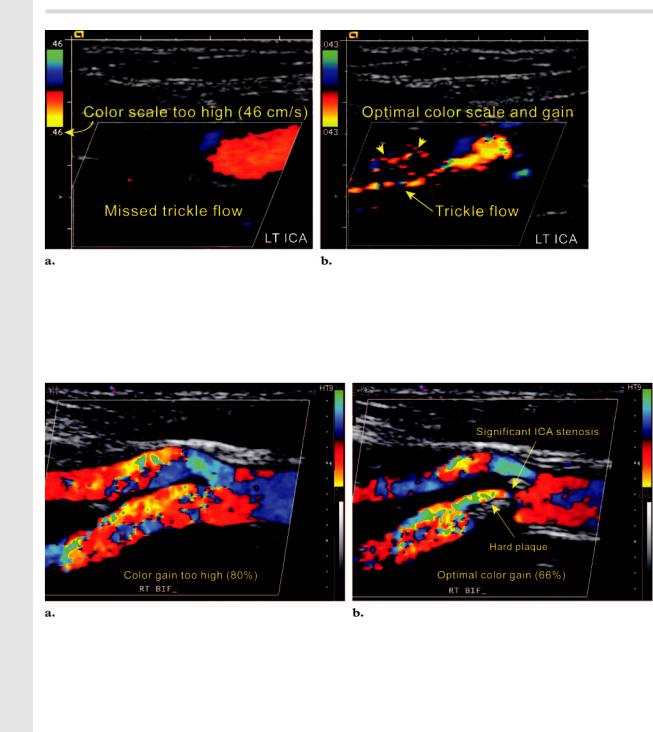
Figure 7. Adjustment of the color scale in a near occlusion. (a) Color Doppler image obtained with the color scale set at 46 cm/sec shows a false-positive appearance of absent flow in the left ICA. (b) On a color Doppler image obtained with the color scale setting lowered to 4 cm/sec, trickle flow is evident, thus indicating the correct diagnosis of a near occlusion in the left ICA. Note the color noise in the background (arrowheads), which is a reassuring indicator of the optimal color gain setting for low-velocity flow.
Figure 8. Adjustment of the color gain. (a) Color Doppler image obtained with the color gain set at 80% shows marked turbulence in both the ICA and ECA, but no luminal narrowing is evident. (b) On a color Doppler image obtained with the color gain lowered to 66%, the anatomy of the bifurcation is demonstrated more accurately. The improved demonstration of the anatomy aids accurate placement of the sample volume box on the narrowest segment, with subsequent alignment of the Doppler angle parallel to the flow vectors.
US Diagnosis of Extracranial |
ischemic heart disease (12). Intima-media thick- |
Atherosclerotic Carotid Disease |
ness measurements must be obtained from a |
Intima-Media Thickness |
gray-scale image, not from a color Doppler im- |
age. We recommend use of higher-frequency lin- |
|
The intima-media thickness of the extracranial |
ear transducers ( 7 MHz) with compound and |
carotid arteries is a measurable index of the pres- |
harmonic imaging to reduce the near field arti- |
ence of atherosclerosis (10,11). The intima-media |
facts (13). Intima-media thickness measurements |
thickness of the CCA is thought to be associated |
may be obtained at the near or far wall of the |
with risk factors for stroke. The bifurcation in- |
CCA, bulb, and ICA. Only the intima (echogenic |
tima-media thickness and the presence of plaque |
layer) and the media (echo-poor layer) are included |
are more directly associated with risk factors for |
|
1568 November-December 2005 |
RG f Volume 25 ● Number 6 |
RadioGraphics
Figure 9. Measuring the intima-media thickness in |
Figure 11. Heterogeneous plaque. Gray-scale |
|
US image shows a heterogeneous plaque in the |
||
the left CCA. Gray-scale US image shows the cursors |
||
proximal right ICA. Note the irregular surface of |
||
placed perpendicular to the long axis of the CCA to |
||
the plaque, which contains echogenic and echo- |
||
include only the intima and media in the thickness |
||
poor areas. This type of plaque is considered un- |
||
measurement. In this case, the distance between the |
||
stable with the potential for inducing a transient |
||
cursors is 2.8 mm. |
||
ischemic attack or cerebrovascular accident. |
||
|
Figure 10. Homogeneous plaque. Gray-scale US |
Figure 12. Intraplaque hemorrhage. Gray- |
|
image shows an echogenic soft homogeneous plaque in |
||
scale US image shows a plaque containing an |
||
the proximal right ICA. Note how smooth the surface |
||
echo-poor area (arrow), which may be due to |
||
of the plaque is (arrowheads). This smoothness may |
||
hemorrhage or lipids. In contrast to fat deposits, |
||
indicate that the plaque is stable. |
||
intraplaque hemorrhage is associated with a rapid |
||
|
||
|
increase in the size of the plaque, which is more |
|
in the measurement (Fig 9). Increased intima- |
likely to become symptomatic. |
|
|
||
media thickness has also been reported as a physi- |
|
|
ologic effect of aging (14). An intima-media |
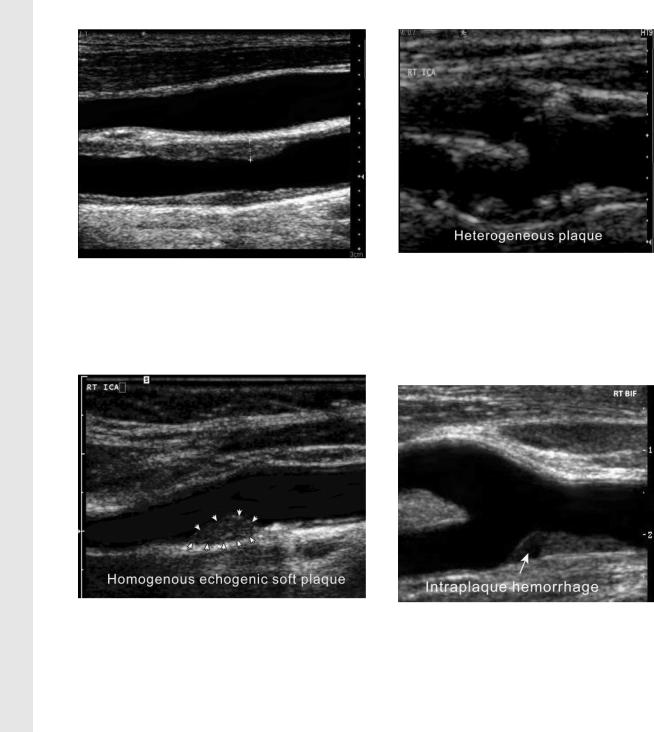
plaques are unstable or friable with the potential |
|
thickness of less than 1 mm is normal. |
for embolic transient ischemic attacks and cere- |
|
Plaque Morphology |
brovascular accidents (Fig 11). These symptom- |
|
atic plaques have lower calcium content but |
||
An important component of carotid US is to ad- |
larger amounts of intraplaque hemorrhage and |
|
equately document the location, internal charac- |
lipid, which make them appear hypoechoic (15– |
|
teristics, and surface detail of plaque. Plaque can |
17). Plaques associated with amaurosis fugax are |
|
be simply characterized as homogeneous or heter- |
more hypoechoic than plaques causing transient |
|
ogeneous. Homogeneous plaques may be fibrous |
ischemic attacks or cerebrovascular accidents. |
|
(soft) or calcified (hard) and have a uniform inter- |
Hypoechoic plaques are more likely to be symp- |
|
nal architecture with a smooth surface contour |
tomatic than hyperechoic ones (15–17) (Fig 12). |
|
(Fig 10). Heterogeneous plaques and ulcerated |
Ulcerated plaques may be detected by demon- |
|
|
strating eddy flow within the plaque depressions |
RG f Volume 25 ● Number 6 |
Tahmasebpour et al 1569 |
RadioGraphics
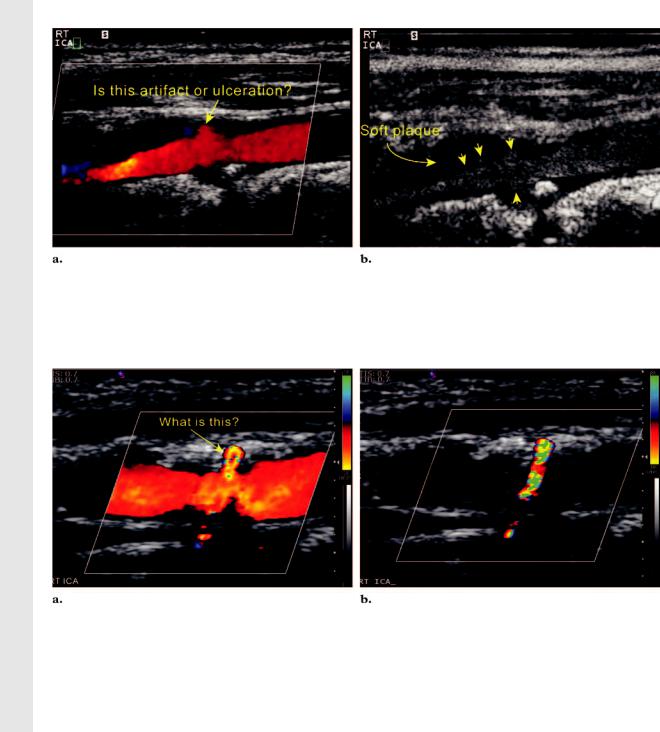
Figure 13. Comparison of color flow and gray-scale flow imaging of a diseased ICA. (a) Color Doppler image of the right ICA shows a moderate amount of plaque in the proximal ICA with questionable eddy flow at the plaque surface. The questionable eddy flow could be due to bleeding of color or ulceration in the plaque. (b) Gray-scale flow image shows an irregular plaque surface (arrowheads) with several depressions. In addition, the true lumen of the ICA is narrower than it appears on the color Doppler image.
Figure 14. Differentiation of ulcerated plaque and twinkle artifact. (a) Color Doppler image of the right ICA shows a moderate amount of hard plaque in the proximal ICA with some questionable flow at the plaque surface.
(b) Color Doppler image obtained in diastole with the color scale setting increased to 86 cm/sec shows that the color flow has disappeared, but the color artifact from the hard plaque continues to twinkle.
at color Doppler or gray-scale flow imaging (18). |
the color velocity scale and cardiac cycle. With |
Gray-scale flow imaging is a non-Doppler tech- |
increasing color velocity scale, the color flow |
nique that displays the true movement of blood |
within the ulcerated plaque will disappear while |
cells and the surrounding tissues simultaneously |
the artifactual color from the cholesterol deposits |
without the distraction of color-related artifacts |
will continue to twinkle (20) (Fig 14). This is an |
(19) (Fig 13). Color flow within the plaque sur- |
easy method of differentiating one from the other. |
face must be differentiated from artifactual bleed- |
Color or PW Doppler interrogation may prove |
ing of color due to high color gain, motion arti- |
difficult or indeed impossible in the presence of |
fact, low color scale, or twinkle artifact. The |
circumferential shadowing calcified plaque. If the |
twinkle artifact, which is a random strong reflec- |
color and PW Doppler information is lost directly |
tion of the incident ultrasound beam at a rough |
behind the shadowing calcified plaque, the opera- |
surface formed by hard plaque such as cholesterol |
tor should interrogate the artery from anterior to |
deposits, may be mistaken for blood flow within |
|
the plaque. The twinkle artifact is independent of |
|
RadioGraphics
1570 November-December 2005 |
RG f Volume 25 ● Number 6 |
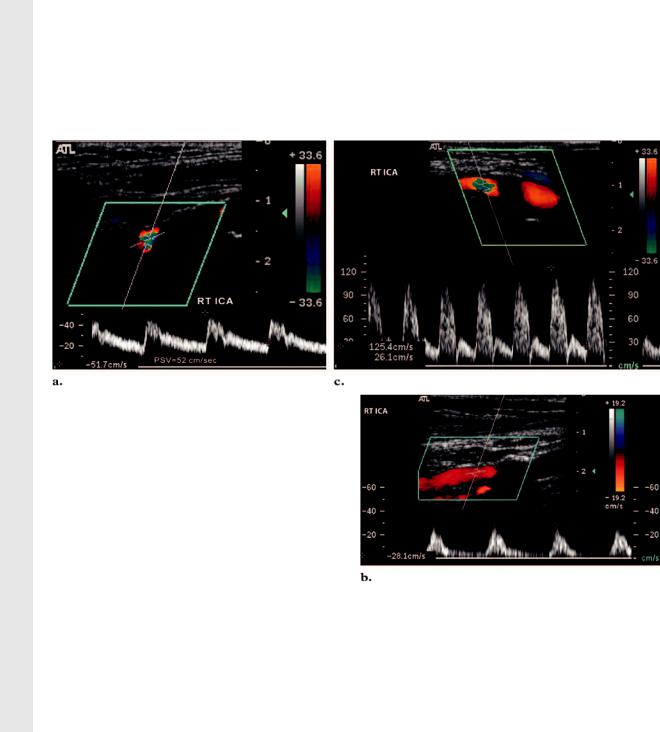
Figure 15. Circumferential calcified plaque in the proximal ICA. (a) PW Doppler image of the right ICA obtained immediately distal to a circumferential shadowing plaque shows no sign of turbulence, and the PSV is within normal limits. Therefore, there is unlikely to be a significant stenosis behind the calcified plaque. (b) PW Doppler image of the proximal right ICA shows a tardus-parvus waveform. A severe proximal stenosis behind the shadowing plaque is suspected; therefore, evaluation with another imaging modality is required. (c) PW Doppler image of the right ICA shows spectral broadening (turbulence) with an elevated PSV. These results may be due to a high degree of stenosis immediately proximal to the point of sampling; therefore, further investigation with another imaging modality is required.
posterior to access a noncalcified segment. In the event that the shadowing plaque is circumferential, the Doppler examination will be limited. In this situation, the length of the shadowing segment may be measured. If the shadowing segment is less than 1 cm and no turbulent flow is demonstrated beyond the plaque, there is unlikely to be a significant stenosis ( 50%) behind the shadowing segment. If damped or turbulent flow is demonstrated distal to the plaque, then a tight stenosis is suspected and should be confirmed with another imaging modality (Fig 15). If the shadowing segment is longer than 2 cm, the degree of stenosis is indeterminate and other imaging modalities are recommended.
ICA and CCA Stenosis
The criteria for grading ICA and CCA stenosis are provided in Table 1 (21). The ICA PSV and the presence of plaque at gray-scale or color Doppler imaging are primary parameters for the grading of ICA stenosis. If the degree of stenosis is indeterminate according to the primary parameters, then additional parameters including the ICA/CCA PSV ratio and the ICA end-diastolic velocity will be taken into consideration. If the CCA is stenotic, the PSV of the nonstenotic segment of the CCA (point A) proximal to the stenotic segment (point B) may also be measured to
calculate the ICA/CCApoint A PSV ratio and the CCApoint B/CCApoint A PSV ratio.
Sonographic features of a severe ICA or CCA stenosis may include the following: PSV greater than 230 cm/sec, a significant amount of visible plaque ( 50% lumen diameter reduction on a gray-scale image), color aliasing despite a high color velocity scale setting ( 100 cm/sec), spectral broadening, poststenosis turbulence at color Doppler and PW Doppler imaging, color bruit artifact in the surrounding tissue of the stenotic artery, end-diastolic velocity of greater than 100 cm/sec, ICA/CCA PSV ratio of 4.0 or greater, and finally a high-pitched sound at PW Doppler imaging (Fig 16).
Limitations
A velocity difference of greater than 20 cm/sec between the right and left CCAs indicates asymmetric flow, which may be normal or due to a proximal stenosis, tandem lesions, distal obstruction, or dissection. Carotid US is not the proce-