

5 курс / Пульмонология и фтизиатрия / Clinical_Tuberculosis_Friedman_Lloyd_N_,_Dedicoat
.pdf20 Epidemiology
developing TB by “reactivation” of infection that is then said to be “latent.”
Augmenting the strong innate resistance to developing disease, infection is associated with an acquired immune response. This acquired immunity can be only partially protective against active disease,18–20,23 however, infected persons living in an endemic area remain at high risk of TB because of the continuing threat of reinfection.19,24–28
The low probability of progression to symptomatic disease explains why population-level incidence of active TB is low. Thus, tuberculosis’s importance among infectious diseases is largely attributable to the high case fatality rate among untreated or improperly treated cases (e.g., only half of MDR cases are diagnosed worldwide). About two-thirds of untreated smear-positive cases die within 5–8 years, the majority within the first 2 years.15,29 The case fatality rate for untreated smear-negative cases, who generally have less advanced disease and fewer bacilli in sputum (making them harder to diagnose by microscopy and even new PCR tests30), is lower but still 10%–15%.31,32 Even among smear-positive patients receiving treatment, case fatality can exceed 10% if adherence is low, or if rates of HIV infection and drug resistance are high.5
The longer-term consequences of this host−pathogen relationship can be explored by a simple mathematical model (Figure 2.3).33 Individuals in a population are assigned to mutually exclusive states of infection and disease, and the natural history described previously specifies the rates of flow between states. TB models generate slow epidemics that peak after several
|
|
|
Births |
|
|
|
|
|
|
|
Uninfected |
|
||
|
|
|
|
|
primary TB |
Infection |
|
||
Latent |
|
|||
Progressive |
|
|||
|
|
|
|
|
Reactivation/ reinfection |
|
|||
|
|
|
|
|
|
Active TB |
|
||
|
|
|
|
|
|
|
|
TB deaths |
|
Figure 2.3 A simple compartmental model of TB epidemiology. Individuals within a population are assigned to the mutually exclusive states uninfected, latent, and with active TB (boxes), and the arrows represent possible transitions between states. Active TB (progressive primary disease, usually taken to be within 5 years) can develop soon after infection, or after a period of latency by reactivation or reinfection. Most mathematical models are more complex than the scheme represented here, distinguishing, for example, infectious from non-infectious disease, or allowing for different rates of progression among HIV-infected and uninfected individuals.
|
1000 |
|
|
|
|
|
TB/100,000/yr |
800 |
|
|
|
|
|
600 |
|
|
|
R0 |
= 2.6 |
|
|
|
|
|
|||
|
|
|
|
|
|
|
Incidence |
400 |
|
|
|
R0 |
= 2.0 |
|
|
|
|
|||
200 |
|
|
|
R0 |
= 1.4 |
|
|
|
|
|
|||
|
0 |
|
|
|
|
|
|
0 |
20 |
40 |
60 |
80 |
100 |
|
|
|
|
Years |
|
|
Figure 2.4 Model TB epidemics generated for three different basic case reproduction numbers (R0). The mathematical model is described in Dye and Williams.279
decades, typically at an incidence rate below 1% (Figure 2.4).24,34–36 More complex models with additional compartments that reflect, for example, heterogeneity in disease and transmission are often required, and the parameters depend on the question for which the model is designed. The accuracy and usefulness of models is, of course, dependent on how well described these parameters are for different settings, making those that are poorly characterized yet influential for model behavior important focus areas for clinical research.37 Even though models are often based on assumptions, they are useful where there is limited data and policy makers or health programs need to make urgent decisions and focus limited resources on key areas.
One composite epidemic parameter of critical importance is the basic case reproduction number (R0), which is defined as the average number of secondary infectious cases generated when one infectious case is introduced into an uninfected population. For an infection to spread, R0 must exceed 1. Because active TB can arise via three different routes, and typically with a considerable time delay after infection, it is not straightforward to calculate an exact R0.38 However, rough estimates of R0 for TB are relatively low among infectious diseases, on the order of 2 in untreated populations.39 For R0 = 2, the expected doubling time of a TB epidemic in its early stages is 4–5 years, meaning that epidemics of a single strain can extend for many decades (Figure 2.4).35 Although large human populations uninfected with TB no longer exist, the concept of R0 remains useful because it guides thinking about a wide range of epidemiological processes. This could, for example, include the transition from predominantly acquired drug-resis- tant TB in the past to an epidemic that is now dominated by primary transmission,40 requiring a new look at the projected efficacy of different control methods on epidemics’ trajectories.
WHY DID TB DECLINE IN EUROPE AND NORTH AMERICA FOR MOST OF THE TWENTIETH CENTURY?
The model described earlier can be used to produce projections of the trajectory of epidemics. Figure 2.4 shows the incidence of
Книга в списке рекомендаций к покупке и прочтению сайта https://meduniver.com/

Why do some people get TB and not others? 21
TB eventually reaching a steady state. Case reports suggest that TB incidence has been nearly steady for at least two decades in some Southeast Asian countries (Figure 2.1), but equilibrium was never reached in Western Europe or the Americas. TB has been in decline since per capita incidence rates peaked in industrialized countries, probably sometime during the early nineteenth century and certainly before chemotherapy began in the 1950s (Figure 2.5).41 Some of this decline could be due to the natural waning of the epidemic (Figure 2.4),35 but the trend was too prolonged for this to provide the whole explanation. In this respect, then, this very basic model appears to be wrong.
The reasons for the sustained 150-year decline have been the subject of perennial debate,42 with three broad proposed explanations: (1) reduced opportunities for transmission per case, (2) reduced susceptibility of contacts, and (3) reduced virulence of the pathogen. Fewer transmissions per infectious case may have occurred because of lower living density or better ventilation within homes or because of patient isolation within sanatoria. As the disease declined, an upward shift in the average age of cases may have resulted in less opportunity for spread in the population if elderly cases had fewer contacts.43 Assuming that no other concomitant change in risk of disease occurred, one analysis suggested that the number of effective contacts per infectious case fell from 22 in England and Wales in 1900 to about 10 by 1950.44
Yet, there also may have been other factors affecting susceptibility of contacts that contributed to this decline. Nutrition improved,45 and is linked to susceptibility46 and can reduce incidence in children (but not transmission).47 Susceptibility is also under genetic control and, with 15%–30% of deaths in cities of the USA attributable to TB during the early nineteenth century,48 most of them among young adults of reproductive age, there must have been some selective pressure. However, at least one analysis suggests that natural selection by pulmonary TB is unlikely to have played a major role in the decline of TB prior to the availability of anti-TB drugs.49
The third explanation is that M. tuberculosis has generally become less pathogenic. Intriguingly, irreversible genetic deletions may have produced phenotypes of M. tuberculosis less likely
|
100000 |
|
|
|
|
0.6 |
|
|
|
|
|
|
|
0.5 |
fatality (deaths/cases) |
Cases or deaths |
10000 |
|
|
|
Cases |
0.4 |
|
|
|
|
|
|
0.3 |
||
1000 |
|
|
|
Deaths |
0.2 |
||
|
|
|
|
|
|
Case |
|
|
|
|
|
|
|
0.1 |
|
|
|
|
|
|
|
|
|
|
100 |
|
|
|
Case fatality |
0.0 |
|
|
|
|
|
|
|
||
|
1910 |
1930 |
1950 |
1970 |
1990 |
2010 |
|
Figure 2.5 Decline in TB cases and deaths in England and Wales from 1912. Case fatality remained at 40%–50% until TB drugs became available during the 1940s, fell sharply into the 1950s and more slowly thereafter. (Data from UK Health Protection Agency.)
to cause cavitary pulmonary disease,50,51 but it remains to be proven that these types of deletion events occurred more rapidly than the sporadic appearance of novel, virulent variants. Indeed, some apparently virulent strains are associated with novel genetic deletions52 and more generally, some emergent strains of M. tuberculosis, including some in the Beijing group, are relatively virulent and harbor significant levels of drug resistance with a propensity toward developing compensatory mutations.53,54
It is not possible to disentangle the factors contributing to TB decline before the widespread introduction of chemotherapy. For example, the city of Cape Town, which had a similar incidence as New York City and London at the start of the twentieth century, introduced contemporaneous measures of TB control prior to chemotherapy (e.g., tuberculin testing, pneumothorax, milk pasteurization), yet while incidence and mortality fell in New York City and London, they diverged dramatically in Cape Town.41 Whatever the exact causes of this decline in the West are, however, these processes together caused a fall in the TB death rate per capita in Western Europe of only 5% per year in the era before chemotherapy. Environmental and nutritional improvements will have benefits beyond those related to a specific disease, but it is doubtful that they can be employed as powerful instruments for TB control, especially in the short term. However, this requires investigation (e.g., observational data on TB incidence as cities embark on initiatives to reduce air pollution, community cluster randomized-controlled trials of a school feeding program in impoverished areas).
WHY DO SOME PEOPLE GET TB
AND NOT OTHERS?
The simple model described earlier captures some of the typical behavior of TB epidemics, but there are important variations on this basic theme. Some variations have been discovered through investigations of epidemiological “risk factors” that influence the probability of infection, disease, or outcome and operate on many scales (e.g., physiological, genetic, and behavioral). The goal of risk factor analysis is to try to identify the principal causal and modifiable factors affecting TB epidemiology.
A small selection of known host-related risk factors is given in Table 2.2, classified in terms of the M. tuberculosis life cycle rather than an epidemiologic scale.32 HIV co-infection dramatically increases the risk of TB disease following primary infection, and promotes the reactivation of latent infection. In HIV-co-infected versus uninfected individuals, the average relative risk of developing TB was found in one study to be 28 over 25 months.55 This risk increases as host immunity is progressively impaired.56–61
Although HIV is much more detrimental than other documented risk factors such as diabetes,62,63 alcohol,64 silicosis,65 mal- nutrition,46,66–68 and indoor air pollution,40 the cumulative impact of a risk factor at population level depends on the number of people exposed as well as the risk to each person exposed. Consequently, some factors that only minimally elevate risks among individuals can be responsible for a large proportion of disease in a population if those factors are very common. As determinants of the total

22 Epidemiology
Table 2.2 Selected host-related risk factors for infection, progression to active TB, and adverse outcomes of disease. Factors can elevate risk across multiple phases of TB disease
Risk factor |
Type of study |
Source |
Infection |
|
|
Increased risk of TB among healthcare workers |
Retrospective ecologic |
[70] |
TB among the homeless associated with recent transmission |
Retrospective analysis of strain clusters |
[71] |
HIV-positive TB patients less likely to infect contacts than HIV-negatives |
Cohort |
[72] |
Childhood infection linked to consumption of unpasteurized milk or cheese |
Case−control |
[73] |
Household contacts of infectious TB case at increased risk of infection |
Case−control |
[74] |
Cigarette smokers at increased risk of infection |
Meta-analysis of cohort and case−control studies |
[75,76] |
Progression to disease |
|
|
HIV increases the risk of recurrent TB via reinfection |
Cohort |
[77] |
TB associated with cigarette smoking |
Meta-analysis of cohort and case−control studies |
[75,76] |
TB associated with diabetes mellitus |
Meta-analysis of cohort and case−control studies |
[63] |
TB associated with exposure to smoke from biomass stoves |
Case−control |
[78] |
TB associated with intake of dietary iron from traditional beer |
Case−control |
[79] |
Vitamin D deficiency associated with active TB, facilitated by polymorphism |
Case−control |
[80,81] |
in the vitamin D receptor gene |
|
|
NRAMP1 polymorphisms associated with smear-positive pulmonary TB |
Case−control |
[82] |
Adverse outcome of disease |
|
|
Malnutrition associated with early mortality in a cohort of patients with high |
Cohort |
[83] |
HIV infection |
|
|
Women at higher risk of carrying MDR-TB |
Retrospective analysis of strain clusters |
[84] |
Previously treated TB patients less likely to adhere to therapy |
Cohort |
[85] |
Severity of pulmonary disease associated with death among hospitalized |
Cross-sectional |
[86] |
patients |
|
|
Non-adherence to treatment linked to alcoholism, injection drug use, |
Cohort |
[87,88] |
homelessness, less morbidity, psychological distress, and poorer health |
|
|
literacy |
|
|
Mortality is higher for cigarette smokers |
Meta-analysis of cohort and case−control studies |
[75,76] |
Diabetes mellitus is associated with increased rates of mortality and relapse |
Meta-analysis of cohort and case−control studies |
[89] |
Cavitation on initial chest radiograph or 2-month positive culture associated |
Retrospective cohort study |
[90] |
with relapse |
|
|
number of TB cases, tobacco smoking in Asia and malnutrition in Africa could rival the importance of HIV.8,69
Besides environmental factors and concomitant illness, infection and the progression to active TB are also under human genetic control. That TB runs in families is well known but this observation confounds genes and possible transmission due to close contact. Among thegenesassociated withsusceptibilitytoTB (e.g., twin studies, case−control studies) are those encoding the vitamin D receptor, natural resistance associated macrophage protein (NRAMP1), HLA, mannose binding lectin (MBL), ASAP1 actin and membrane remodeling protein, and the Toll-like receptors.91–100 Associations between human genetic polymorphisms and disease risk, clinical presentation, or outcome are typically determined by the interactions between genes and their environment.101,102 Investigations of genetic determinants have thus not yielded consistent results, as illustrated by studies of vitamin D receptor polymorphisms97,103 and clinical trials evaluating vitamin D supplementation describing an overall lack of impact on TB treatment outcomes.104
In sum, the standard picture of M. tuberculosis as the agent of slow epidemics is a useful frame of reference, but certain co-factors
can profoundly alter TB epidemiology. Above all, we still have no more than a superficial understanding of why only a small fraction of infections ultimately result in clinical disease. Unlocking this is a major research priority, and could reveal targets for TB control (e.g., vaccine development to prevent progression to active disease), diagnostics (e.g., to identify and triage patients who will imminently progress), and permit more accurate modeling (and thus targeting of interventions to high-risk groups).
WHAT FACTORS CAN EXPLAIN RESURGENCES OF TB, LIKE THOSE
SEEN IN AFRICA AND THE FORMER SOVIET COUNTRIES SINCE 1990?
Preventing and controlling epidemics of TB requires measuring and understanding the factors that drive increases in incidence. In Africa, spatial and temporal variation in TB incidence is correlated strongly with HIV prevalence.105 The WHO Africa region contributes 34% of the HIV-positive TB caseload. In 2016,
Книга в списке рекомендаций к покупке и прочтению сайта https://meduniver.com/

Does variation between M. tuberculosis strains modify the natural history, epidemiology, and control of TB epidemics? 23
82% of TB patients in Africa had a documented HIV test result, however, Africa had the lowest rate of antiretroviral treatment (ART) initiation in HIV-positive TB cases.8 Globally, an estimated 13% of all new adult TB cases were HIV-co-infected in 2016 and the percentage of incident TB cases with HIV varied greatly (as low as 2% in the Western Pacific Region). The extent to which HIV is fueling TB transmission (in addition to provoking reactivation) remains poorly understood: one analysis suggested that 1%–2% of all transmission events were from HIV-infected, smear-positive TB cases in 2000106 and another showed that HIVinfected patients are more likely to be reactivated TB cases rather than primary TB cases.107 The fraction of the overall force of TB infection attributable to HIV-infected cases depends on the prevalence of HIV as well as the relative infectiousness of HIVassociated TB compared with TB cases not affected by HIV. The relative infectiousness of HIV-associated TB is affected by both host and microbiological factors (e.g., the probability of sputum smear-positive pulmonary disease) and environmental factors that determine the expected duration of infectiousness (e.g., how rapidly cases can access diagnosis and effective treatment). The duration of HIV-associated TB infectiousness appears to vary, being shorter than for HIV-negative TB108 or about the same109 depending on the setting; reductions in the per-day infectiousness may be the case where there is a diagnostic delay for HIVinfected patients.110
The rise in TB incidence attributable to HIV has evidently peaked in most countries, following the peak in HIV incidence.111 However, the number of notified HIV-positive TB cases was, in 2016, only 46% of the estimated incidence of TB among people living with HIV8 suggesting massive under-detection of TB in this vulnerable population. More aggressive implementation of ART,111,112 combined with other interventions targeted at TB (such as isoniazid preventive therapy [IPT]113 or systematic testing of HIV-positive patients114) will help further to reduce the burden of HIV-associated TB.
In Russia and other former-Soviet countries, TB incidence and death increased sharply between 1990 and 2000, but stabilized and now are falling.8 Understanding precisely why this increase happened is as difficult as understanding the preceding decline. It is clear that there was a marked deterioration in case finding and cure rates in Russia, but this cannot explain all of the rise.115 Other factors that may have shaped the post-1990 epidemic in Russia include enhanced transmission due to mixing of prison and civilian populations, an increase in susceptibility to disease following infection (possibly linked to stress, malnutrition, and alcoholism), poor service delivery, the spread of drug resistance, and, latterly, HIV infection.116–119
Immigration from high-incidence countries is part of the reason why the decline of TB in Western Europe, North America, and the Gulf States has stalled. Many immigrants are infected in their countries of origin and they cause, in varying degrees, further transmission and outbreaks after arrival.120–125 Furthermore, from 2008 to 2018, the proportion of TB cases in the Western Europe region with an HIV test result that was HIV-positive increased from 3% to 15%.8
TB incidence is no longer falling in some East Asian settings, notably Singapore.8,111 Part of the explanation could be that more
cases are arising by reactivation from an aging TB epidemic in an aging human population.126,127 TB deaths are not frequent enough to cause significant demographic change, but demographic changes can markedly affect TB epidemiology.
DOES VARIATION BETWEEN M. TUBERCULOSIS STRAINS MODIFY THE
NATURAL HISTORY, EPIDEMIOLOGY, AND CONTROL OF TB EPIDEMICS?
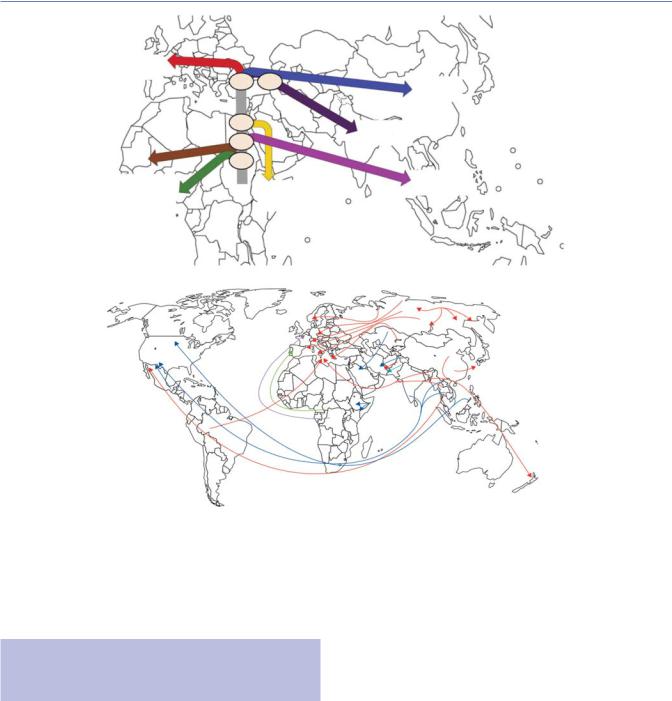
While early targeted genetic analyses (e.g., multilocus sequence typing) suggested minimal within-species diversity of M. tuberculosis,128,129 recent advances using whole genome sequencing and ultra-deep sequencing to uncover minority sub-populations, combined with large public collections of sequencing data from clinical isolates, are allowing new insights into the molecular epidemiology of M. tuberculosis.130,131 These include substantial within-host genetic diversity (especially in immunocompromised patients) that can also be associated with different phenotypes (e.g., drug susceptibility by anatomical site),132,133 and a new understanding of the global population structure of M. tuberculosis lineages (including drug-resistant varieties) and how they have spread around the world54,130,134–136 (Figure 2.6).
This appreciation of diversity within M. tuberculosis has been accompanied by investigations that aim to discover whether differences between (or within137) lineages modify the ability of the pathogen to infect hosts or are associated with differences in the natural history of disease.138 Accumulating evidence suggests that strain lineages vary in strength and mechanism of hostimmune stimulation after infection,53 within-host competitive ability,139 and in the rates of acquiring mutations140 and in the specific mutations they preferentially acquire.141 Each of these dimensions may affect the within-host course of infection, disease, response to therapy, drug susceptibility, and transmission fitness. Early mathematical modeling efforts suggested potential effects of strain diversity on the emergence of drug resistance142 and the effects of potential interventions.143,144 Recently, molecular epidemiology studies suggest that, contrary to early work in the 1950s,145 certain M. tuberculosis lineages (e.g., the Beijing family under lineage two) have inherent capacity for rapid evolution of drug resistance and compensatory mutations, which afford the organism more opportunities to develop resistancecausing and/or fitness-promoting mutations, and increased virulence and transmission.130,146–148 Improving our understanding of the genetic variation in M. tuberculosis strains will doubtless improve our ability to predict and intervene in emergent epidemics. This will require additional data on strain molecular epidemiology. Importantly, the routine use of sequencing technologies for drug resistance in the medium term149,150 may serve as a readily available source of such data. Critically, the value of molecular epidemiology data is enhanced dramatically when paired with patient and other microbiological metadata.27 On a larger scale, M. tuberculosis molecular data can be combined with data on human genetic diversity and movement and, when paired with knowledge of migration explain the dissemination of
strains.148,151,152
24 Epidemiology
(a) |
|
|
|
Lineage 4 |
|
|
|
Europe |
46 |
42 |
Lineage 2 |
|
|||
|
|
|
East Asia |
|
64 |
|
Lineage 3 |
|
67 |
|
Central Asia |
|
|
|
|
|
73 |
|
|
Lineages 5 |
|
|
Lineage 1 |
|
Lineage 7 |
Indian Ocean |
|
and 6 |
|
Ethiopia |
|
West Africa |
|
|
|
(b)
Figure 2.6 The genetic history of MTB corresponds with human migration and movement. (a) Out-of-Africa and Neolithic expansion of MTB reconstructed from phylogeographic and dating analyses that shows a correlation with human migration events, starting 67 000 years ago with a split in Lineage 1. Major splits are annotated with the median value (in thousands of years) of the dating of the relevant node. Lineage 7 diverged subsequent to the proposed Out-of-Africa migration of MTB complex; it may have arisen among a human population that remained in Africa or a population that returned to Africa. (b) Worldwide spread of drug-resistant strains of MTB. Red = Beijing strain. Green = LAM9 strain. Light blue = Haarlem1 strain. Purple = T1 strain. Dark blue = untyped strains. ([a] From Comas I et al.152; [b] From Dheda K et al.240)
DOES TB INFLUENCE THE EPIDEMIOLOGY OF OTHER DISEASES (OR VICE VERSA)?
Mammalian adaptive immune responses fall into two antagonistic subclasses—Th1 and Th2—each with its own set of cytokine mediators. Microbial infections have the potential to influence the balance between Th1 and Th2 responses by altering cytokine profiles, with positive or negative consequences for health. By influencing Th1/Th2 balance, bacterial infections can play a role in atopy, an allergic state producing mucosal inflammation characteristic of asthma that is characterized by over-reactive Th2 responses.
Because mycobacteria elicit strong Th1 responses, shifting the Th1/Th2 balance away from Th2, M. tuberculosis infection may protect against asthma. One study of Japanese children found that strong tuberculin responses, probably attributable to M.
tuberculosis exposure, were associated with less asthma, rhinoconjunctivitis, and eczema in later childhood.153 A study of South African children found an inverse association between M. tuberculosis infection and atopic rhinitis.154 Comparisons among countries have found that asthma tends to be more common where TB is not.155,156 The implication of the majority of these results of association is that TB may inhibit the spread of atopic disorders in some settings, though there are notable exceptions.157
Besides the link between TB and asthma, interactions between other infections have come under investigation. Vigorous Th2 responses are seen in protective immune reactions to helminth infections, and helminths could modulate atopic disease while compromising the immune response to bacille Calmette-Guerin (BCG) and M. tuberculosis.158–160 Another common organism Helicobacter pylori, estimated to infect over 4 billion people, may play a role in TB: H. pylori-infected macaques challenged with low doses of M. tuberculosis are less likely to progress to active TB compared to H. pylori-uninfected macaques and, in humans,
Книга в списке рекомендаций к покупке и прочтению сайта https://meduniver.com/

How can current strategies be enhanced to improve control of TB epidemics? 25
latently infected household contacts who did not develop active TB within two years were more likely to be infected with H. pylori than contacts that go on to develop active disease.161 Conversely, mice with Helicobacter hepaticus (a human pathogen) gut infection have subclinical inflammation, and drastic impairment of immune control of the growth of subsequently administered M. tuberculosis, which results in severe lung tissue pathology.162
Inversely, a mycobacterial vaccine might be constructed to prevent atopy and asthma. BCG could already serve that purpose, and although the evidence is ambiguous,158 it may improve non-spe- cific mortality.163,164 M. tuberculosis infection may protect against leprosy, as does BCG,165 and natural TB transmission could have contributed to the decline of leprosy in Europe.166 While the synergistic and antagonistic interactions between bacterial, viral, and parasitic infections are complex and unresolved, these examples raise the possibility that mycobacteria influence, and are influenced by, the presence of other infections.
Recently, rapidly rising living standards in settings with a high TB burden (e.g., India) and the increased likelihood of new types of co-epidemics have received attention.167 For example, obesity will increase and, concomitantly, type II diabetes. Diabetes increases risk of TB 2–3 fold, tuberculosis worsens glycemic control, and drug−drug interactions add complexity to patient management.168 The number of people with diabetes is expected to grow from 387 million in 2014 to 592 million by 2030, with three-fourths of diabetics living in countries presently classified as low or middle income.169,170 While the underlying immunological interactions between TB and diabetes are studied,171 this interaction (as well as that of TB with other non-communicable diseases [NCDs]) requires an integration of health screening and delivery services and has implications for the future reporting of case notifications and monitoring disease. However, it also presents new opportunities for diagnosing and treating both TB and diabetes.170,172
HOW CAN CURRENT STRATEGIES BE ENHANCED TO IMPROVE CONTROL OF TB EPIDEMICS?
With this epidemiological background, we can now explore the impact of past control methods of TB. The cornerstone of TB control traditionally focused on the prompt treatment of symptomatic cases with combination chemotherapy, administered through the End TB Strategy’s predecessor—the Stop Strategy. Wellimplemented standard short-course regimens can cure over 90% of new, drug-susceptible TB cases and these provide a foundation for more complex strategies for control where, for example, rates of drug resistance or HIV infection are high.
Many national TB control programs show that they can achieve high cure rates: the average treatment success rate in 2016 among the 6.3 million new cases was 83%, however, it was worse for drugresistant TB (54% for MDR/rifampicin-resistant TB and 30% for XDR TB, both 2014 data).8 The most substantial deviations below the average for drug-susceptible TB treatment were in the WHO European Region (due to high rates of treatment failure and death) and the Region of the Americas (high loss to follow-up and missing
data). From a higher-level perspective, reasons for suboptimal treatment completion include deficiencies inherent in DOTS or its implementation that need strengthening (e.g., improved funding, increased patient autonomy and alignment with patients’ needs, and reduced patient financial costs).174,175 The global TB community recently has aspired to meet the 90–90−90 targets, where 90% of patients started on treatment successfully complete it; however, in 2016, just seven of the designated 30 high burden countries met this criterion. Critically, the quality of data used to measure progress toward these goals requires improvement (useful tools and guidance to accomplish these exist,176–178 however, investment and incentives are required so that programs meet reporting standards).
High case detection and cure rates are essential if incidence, prevalence, and death rates are to be reduced.179 Mathematical modeling suggests that the incidence of endemic TB will decline at 5%–10% per year with ≥70% passive case detection and ≥85% cure.20,181 In principle, TB incidence could be reduced more rapidly, by as much as 30% per year, if new cases could be found soon enough to eliminate transmission,182 but given the slow onset of symptoms in many cases and the suboptimal limits of detection of current TB diagnostic tests, this has been hard to achieve. It is possible, however, that new ultra-sensitive nucleic acid amplification tests (e.g., Xpert MTB/RIF Ultra) may offer improved sensitivity in paucibacillary patients with early-stage disease.183 Furthermore, promising tests based on correlates of risk signatures, which aim to rule out the likely development of active TB within months of infection and, when positive, can be used to monitor patients or give them confirmatory testing, may serve as powerful ways of identifying patients at high risk.184,185 However, in general, the decline driven by such interventions will be faster when a larger fraction of cases (primary progressive or exogenous disease) arises from recent infection, i.e., in areas where transmission rates are high. As TB transmission and incidence decrease, a higher proportion of cases may arise from the reactivation of latent infection, and the rate of decline in incidence may slow (Figure 2.7).
In the control of endemic TB largely by chemotherapy, the best results have been achieved in communities of Alaskan, Canadian, and Greenland Inuit, where the incidence was reduced by 13%–18%
|
160 |
|
|
|
|
|
|
|
|
|
140 |
|
|
|
|
|
|
|
|
rate/100,000/yr |
120 |
|
|
|
|
|
|
|
|
100 |
|
|
Progressive primary |
|
|
|
|||
|
|
|
Exogenous reinfection |
|
|||||
80 |
|
|
|
|
|||||
|
|
|
|
|
|
|
|
||
|
|
|
|
|
Endogenous reactivation |
||||
Incidence |
60 |
|
|
|
|
|
|
|
|
40 |
|
|
|
|
|
|
|
|
|
|
|
|
|
|
|
|
|
|
|
|
20 |
|
|
|
|
|
|
|
|
|
0 |
|
|
|
|
|
|
|
|
|
1950 |
1953 |
1956 |
1959 |
1962 |
1965 |
1968 |
1971 |
1974 |
Figure 2.7 The changing etiology of TB in decline, modeled on 45–49 year-olds in the Netherlands. (From Dye C.182; Adapted from Styblo K.15)

26 Epidemiology
per year from the early 1950s onward15 (Figure 2.8). Over a much wider area in Western Europe, TB declined at 7%–10% per year after drugs became available during the 1950s, though incidence was already falling at 4%–5% per year before chemotherapy.15
Case notification series from some countries show that incidence is not falling in the manner anticipated by modeling studies, even though national TB control programs have apparently achieved high rates of case detection and cure. Vietnam is a case in point. WHO targets for case detection and cure had, on the available evidence, been met by 1997, and yet the numbers of notified TB cases have remained more or less stable. Closer inspection of the data reveals that falling case rates among adults 35–64 years old (especially women) have been offset by a rise in the age group 15–34 years old (especially men).186,187
Although the long-term aim of TB control is to prevent new cases, the immediate goals are to reduce prevalence and deaths. About 90% of the burden of TB, as measured in terms of years of healthy life lost (or disability-adjusted life years, DALYs) is due to premature death, and prevalence and deaths can be reduced faster than incidence by community-wide chemotherapy. Thus, the TB
death rate among Alaskan Inuit dropped at an average of 30% per year in the interval 1950–1970, and at 12% per year throughout the Netherlands from 1950 to 1990 (faster at first, slower later).15,188 Indirect assessments of DOTS’ impact suggest that 70% of TB deaths were averted in Peru between 1991 and 2000, and more than half the expected TB deaths have been prevented each year in in provinces in China that implemented DOTS.189,190 Nationwide surveys carried out in China showed a reduction in the prevalence of smear-positive disease from 169/100,000 in 2000 to 66/100,000 in 2010, a reduction of 61%. This rate of decline is almost as fast as previously recorded in the Republic of Korea (Figure 2.8).5
Recently, in line with the Universal Health Care umbrella of the Sustainable Development Goals (specifically Goal 3, Good Health and Well-being for People, which aims to ensure healthy lives and promote the well-being for all at all ages), the emphasis on prompt treatment initiation has expanded to incorporate aspects of universal health care focusing on the broader social and economic risk factors (and repercussions) of TB.1,8 Monitoring frameworks that include key indicators of progress toward universal health coverage are now incorporated into reporting indicators (e.g., malnourishment). This
(a) Europe & USA |
(c) Alaskan natives |
|
|
|
|
|
|
10000 |
|
|
|
0.3 |
|
Reported cases/million/yr |
500 |
|
|
|
Cases or deaths/million/yr |
1000 |
|
|
|
|
|
|
|
|
|
|
|
|
|
0.2 |
Case fatality |
||
|
|
|
|
100 |
|
|
|
|
|||
|
Netherlands, 8.8%/yr |
|
|
|
|
|
0.1 |
||||
|
USA, 5.4%/yr |
|
|
10 |
Cases |
|
|
|
|||
|
|
|
|
|
|
|
|||||
|
|
England & Wales, 7.9%/yr |
|
|
|
|
|
|
|
||
|
|
|
|
|
Deaths |
|
|
|
|
||
|
|
Germany, 5.5%/yr |
|
|
|
|
|
|
|
||
|
50 |
|
|
1 |
Case fatality |
|
|
0 |
|
||
|
|
|
|
|
|
|
|
|
|||
|
1950 |
1960 |
1970 |
1980 |
|
1950 |
1955 |
1960 |
1965 |
1970 |
|
|
|
|
Year |
|
|
|
|
Year |
|
|
|
(b) China & R. Korea |
(d) England & Wales |
|
|
|
|
|
|
|
|
|
|
|
|
0.6 |
|
Prevalence smear+/million/yr |
|
|
|
|
|
|
|
10000 |
|
|
|
0.5 |
|
5000 |
|
|
|
|
|
Cases or deaths/million/yr |
|
|
|
|
|
||
|
|
|
|
|
|
|
|
|
|
|
|||
|
|
|
|
|
|
|
|
|
|
0.4 |
Case fatality |
||
|
|
|
|
|
|
|
|
|
|
0.3 |
|||
|
|
|
|
|
|
1000 |
|
|
|
|
|||
|
|
|
|
|
|
|
|
|
|
0.2 |
|||
|
R. Korea, 6.7%/yr |
|
|
|
|
Cases |
|
|
0.1 |
||||
|
|
|
|
|
|
|
Deaths |
|
|
|
|
||
|
|
China, 3.4%/yr |
|
|
|
|
|
|
|
|
|
||
|
500 |
|
|
|
|
100 |
Case fatality |
|
|
0 |
|
||
|
|
|
|
|
|
|
|
|
|
|
|||
|
1960 |
1970 |
1980 |
1990 |
2000 |
2010 |
|
1940 |
1945 |
1950 |
1955 |
1960 |
|
|
|
|
|
Year |
|
|
|
|
|
Year |
|
|
|
Figure 2.8 Examples of the decline in TB incidence, prevalence, and mortality nationally and sub-nationally, under the influence of largescale programs of drug treatment. (a) Case notifications from three European countries plus the USA.15,280–282 (b) National population-based prevalence surveys in the Republic of Korea (1965–1995) and China (1979–2010).210,283,284 (c) TB cases and deaths recorded from an intensively studied population of Alaskan natives (1952–1970). Case fatality is estimated as the ratio of deaths/cases.188 (d) National case and death notifications from England and Wales, 1940–1960, with case fatality estimated as in (c).281
Книга в списке рекомендаций к покупке и прочтению сайта https://meduniver.com/

How can current strategies be enhanced to improve control of TB epidemics? 27
broadening of what is now considered to fall under the remit of TB control programs is an advance that ultimately will likely reduce the TB epidemic; however, important research and data on the type of interventions or improvements that target these indicators in a manner most impactful for TB are needed.
Using TB drugs more effectively: Active case finding and treatment
DOTS embraced passive case detection for three reasons: most smear-positive disease develops more quickly than any reasonable frequency of mass screening of symptoms or by radiography; the majority of patients severely ill with a life-threatening disease are likely to seek help quickly191; and countries that have not yet implemented effective systems for passive case detection will have difficulty pursuing cases more actively.
But the drawback of passive case finding is that it is often very passive indeed. Population surveys of disease commonly find large numbers of TB patients that have not sought treatment of any kind, or have sought treatment but were not diagnosed. Symptom screening, which is often done sub-optimally,192 still misses onefifth of cases when done well193 and near-future technologies might later become suitable for mass screening in people without or with minimal symptoms (and are thus a major research and development priority194). Furthermore, while drug treatment after a long illness can prevent death, it may not impact transmission as most transmission occurs prior to presentation.195 Strategies for increasing screening among sub-populations in which TB is concentrated such as refugees,196 those sleeping in shelters for the homeless,197 contacts of active cases,198,199 health workers,70 drug users and prisoners,200 people in very high incidence areas,201,202 HIV-positive people,203 and people with a history of TB204 can be feasible and cost-effective.
Because active case finding cuts delay to treatment, the benefits for individual patients are clear, but the benefits for whole populations through reduced transmission are harder to detect. One cluster randomized trial has demonstrated that some forms of active case finding can reduce the prevalence of TB in high HIV incidence communities.202 However, studies of the epidemiological impact of active case finding have not found significant effects on reducing community TB incidence,205 including the large com- munity-randomized ZAMSTAR study that covered nearly one million individuals in South Africa and Zambia.206 This large and expensive study is unlikely to be repeated and not only highlights the difficulties in attempting to empirically research key TB epidemiology questions, but also the limitations of our understanding of the effect of active case finding.207
Nevertheless, mathematical models (as well as intuition) suggest that, even in the midst of a major HIV epidemic, early detection and cure of TB are effective ways to cut TB burden.208 New models to understand how best to implement active case finding policies are being developed209 and, by combining the assault on active TB with other methods, such as the prevention and treatment of HIV infection, the treatment of latent TB infection,208,211 and infection control in key settings it should be possible to achieve a synergistic effect, thereby making TB control still more effective.212 But these beneficial effects remain to be demonstrated
in practice and there continues to be a need to design and rigorously evaluate interventions to halt transmission, and then prioritize those interventions most likely to achieve population-level impact for implementation.213 Indeed, recent work (Figure 2.9) comparing the long-term impact of interventions using independent models, shows that scale-up of current tools is probably insufficient to meet the End TB goals in India and China, but may succeed in South Africa,212 and the further context-specific interventions are likely required (e.g., tackling undernutrition in India or the latent infection reservoir in elderly Chinese).
The TB patient care cascade, which quantifies the number of patients with a favorable outcome at each step of the care continuum, has recently emerged as a useful tool to identify diagnostic (and many other) gaps where patients are “lost” by the system.192,214 On a local level, such a tool can be used to identify types of people who are under-represented and do disproportionally worse at each step of the cascade.215
Using TB drugs more effectively: Treatment of latent TB infection
Persons at high risk of TB can be given a test for latent TB infection and those found to be positive can be offered treatment for latent infection, most commonly IPT. Studies among contacts of active cases have demonstrated that 12 months of daily isoniazid gives 30%–100% protection against active TB,216 and yet IPT is not widely used. The main challenges are (1) active disease must be excluded (e.g., by radiography) or culture before isoniazid is taken alone, (2) compliance to six or more months of daily treatment tends to be poor among healthy people, and (3) side effects including a hepatitis risk of 1% per year. Even with the resources available in the USA, the implementation of contact tracing and IPT has fallen short of recommendations.217
Current WHO guidelines recommend that HIV-infected individuals free of symptoms suggestive of TB receive treatment with IPT for at least 6 months.218 In 2016, 920,269 HIV-positive individuals received IPT, a number that has grown substantially since 2009.8 The high risk of TB among persons co-infected with M. tuberculosis and HIV motivates those individuals, encouraging wider use of preventive therapy, especially in Africa,219 but questions have been raised about the methods of screening to ensure that those most likely to benefit receive this treatment220,221 and that those with subclinical TB are not inadvertently treated with monotherapy.166–168 Although trials of IPT in skin-test-positive adults infected with HIV have averaged about 60% protection, the effects have been lost soon after the IPT treatment has ended and there has been little or no impact on mortality.222–228 Studies have suggested that the benefits of IPT appear to be limited to those with positive TST and IPT does not appear to reduce adult mortality,229 however, in HIV-positive patients receiving ART there is evidence from a high burden setting showing that IPT’s effect is not restricted to patients who are TST-positive.230 Furthermore, the benefits of IPT do not outlast treatment in high-incidence settings where reinfection can occur231 and there is not yet evidence that widely offering IPT alone within high incidence settings improves TB control.211 By contrast, IPT has been shown to reduce both TB incidence and mortality among HIV-infected

28 Epidemiology
Reduction in adult tuberculosis incidence between 2015 and 2025(%)
100
75
50
25
0
China |
|
India |
South Africa |
NTU |
UGA |
|
|
ICPHFI |
IDM |
|
|
STAMP |
Harvard |
Additional |
Additional |
Hopkins |
AuTuMN |
||
IRD |
TIME |
reduction |
reduction |
SIPTM |
|
|
|
Additional |
|
|
|
reduction |
|
|
|
|
|
ss |
|
|
|
F |
|
|
|
|
|
|
ss |
|
|
|
F |
|
|
|
|
|
|
ss |
|
|
|
F |
|
|
|
|
#1: |
|
Diagnosis |
#5: |
|
|
|
ombination |
#1: |
|
Diagnosis |
#5: |
|
|
|
ombination |
#1: |
|
Diagnosis |
#5: |
|
|
|
ombination |
|||||||||
Baseline |
|
#3: |
|
|
|
Baseline |
|
#3: |
|
|
|
Baseline |
|
#3: |
|
|
|
|||||||||||||||
|
Acce |
|
Care |
AC CF+PT |
|
IPT |
|
Acce |
|
Care |
AC CF+PT |
|
IPT |
|
Acce |
|
Care |
AC CF+PT |
|
IPT |
||||||||||||
|
|
|
|
#4: |
|
A |
HIV+ve |
|
|
|
|
|
#4: |
|
A |
HIV+ve |
|
|
|
|
|
#4: |
|
A |
HIV+ve |
|
||||||
|
#2: |
|
|
|
|
#6: |
#7: |
C |
|
|
#2: |
|
|
|
|
#6: |
#7: |
C |
|
|
#2: |
|
|
|
|
#6: |
#7: |
C |
|
|||
|
|
|
|
|
|
|
|
|
|
|
|
|
|
|
|
|
|
|
|
|
|
|
|
|
|
|
|
|
|
|||
Figure 2.9 An example showing the projected impact of different interventions on the incidence of TB. Models had to reflect activities planned by national TB programs to address specific targets in the TB care cascade (e.g., a reduction in the proportion of patients not accessing TB care). The figure shows the variable project impact of baseline (left of dotted line) and incremental (excluding baseline, right of dotted line) impact of individual intervention scenarios (triangles and circles) from independent models (shapes). Lines between models are for illustration of within-model impact of interventions. Critically, this shows that setting-specific interventions based on currently available tools can, in South Africa, help reach the End TB goals but in China and India they will likely be insufficient. Interventions: Access (increase access to high quality care), Diagnosis (diagnosis of disease and MDR), Care (improve post-diagnosis care), ACF (active case finding in general population), ACF+PT (active case finding followed by preventive therapy of latent TB), HIV+ive IPT (continuous IPT for ART-receiving population), Combination (scale up all interventions simultaneously). Study countries: NTU (China), ICPHFI (India), STAMP (India), Hopkins (South Africa), IRD (South Africa), SIPTM (South Africa), UGA (South Africa), IDM (South Africa, China), Harvard (South Africa, India, China), AutuMN (South Africa, India, China), TIME (South Africa, India, China). (From Houben et al.212)
children.232 Recently, there is some population-level evidence of efficacy in medium incidence settings, but it is hard to estimate the independent effect of IPT.233 In a community-randomized trial in Brazil that included treatment of infection (alongside active case finding), incidence decreased by 15% compared to standard procedure.234 In another cluster-randomized trial in Brazil in HIVinfected people, strengthening active TB screening, tuberculin testing, and IPT provision reduced the adjusted hazard of TB incidence and death by 25%–30%.235
There remain significant logistic hurdles to providing IPT for people who are co-infected,236 especially if IPT must be administered for many years to have a durable effect. A key challenge in providing IPT is identifying the subset of people who will benefit from treatment. Studies are underway on the efficacy of preventive treatment in patients with so-called incipient TB (i.e., patients identified through correlate of risk signatures, rather than TST, as having high probability of soon progressing to culture-posi- tive TB),237,238 which may make widespread IPT more feasible to programs.
WILL TB BECOME RESISTANT TO ALL
ANTIBIOTICS?
Efforts to systematically document the global burden of drugresistant forms of TB date back to the mid-1990s. At that time,
the prevalence of MDR TB was highest in countries of the former Soviet Union and the spread of resistance there was linked to the resurgence of TB after dissolution of the Union in 1991. Surveys and surveillance indicate that the severity of the MDR crisis in the former Soviet and Eastern European region remains high; data collected between 2007 and 2010 indicate that the proportion of new cases with MDR was greater than 20% in Belarus, the Republic of Moldova, and six oblasts of the Russian Federation. Among previously treated cases, MDR prevalence was at least 50% in Belarus, Lithuania, the Republic of Moldova, and five oblasts of the Russian Federation.239
Although the proportion of cases with MDR is highest in the countries of the former Soviet Union and Eastern Europe, the greatest numbers of MDR cases are in India and China due to their large populations. Drug-resistant TB remains underdiagnosed and under-treated: of the 600,000 estimated incident MDR cases in 2016, only 129,689 were started on second-line treatment (India and China alone accounted for 39% of this incidence-notification gap).8 This is despite recent advances in the detection of MDR TB.240 In 2011, the WHO endorsed Xpert MTB/RIF (a frontline PCR test for TB that also detects rifampicin resistance).241,242 It has become a standard-of-care in many high burden countries (at the end of 2016, nearly 30,000 machine modules had been installed and over 23 million cartridges procured by the public sector).8 In sub-Saharan African countries, the precise effects of HIV on the burden of drug-resistant TB is not clear243–245 but, in 2006, reports
Книга в списке рекомендаций к покупке и прочтению сайта https://meduniver.com/

How can novel tools and pharmacological interventions contribute to ending TB epidemics? 29
of the spread and high case fatality associated with XDR TB among HIV-co-infected patients in KwaZulu-Natal, South Africa captured global attention,246 and subsequent studies have documented very high rates of resistance to available drugs in XDR patients, raising the specter of essentially untreatable epidemics of TB.247–250 Alarmingly, this has been followed with reports of patients with persistently culture-positive highly drug-resistant forms of TB being discharged back into communities resulting in primary transmission.247,248
The extent to which drug resistance threatens global control of TB depends on the absolute and relative genetic fitness of susceptible and resistant strains. As detailed earlier, there now is a substantial body of evidence that most drug resistance is caused by primary transmission.40,54,130 More highly drug-resistant strains appear to be transmitted less, however, the proportion of cases attributed to transmission appears to increase year on year as strains have more opportunities to mitigate fitness costs through compensatory mutation.251,252 Importantly, while transmitted drug-resistant cases outnumber those caused by acquired resistance by orders of magnitude, the prevalence of drug resistance in previously treated cases remains higher (19% vs. 4%).8 While it is true that transmission is driving drug-resistant TB globally, there is heterogeneity on a local level and efforts to infer relative case reproduction numbers from molecular epidemiological studies (e.g., clusters of genotypically similar strains) have produced variable results.253–256 Encouragingly, when some countries (e.g., Latvia and Estonia) with a high fraction of MDR TB (likely due to transmission) implemented aggressive new TB programs that included treatment of MDR TB, overall incidence decreased.
While individualized regimens are efficacious in the treatment of highly drug-resistant forms of disease257–259 and the new shortened MDR regimen treatment holds promise,260 there is substantial progress to be made to ensure that all TB cases receive appropriate therapy, regardless of resistance. This is complicated by a lack of rapid diagnostics for susceptibility to several drugs (e.g., pyrazinamide, ethambutol) within the new second-line regimen and high levels of background resistance to these drugs in MDR strains (40%–50% in some settings). This threatens the emergence of resistance to critical drugs like the fluoroquinolones and could comprise the new MDR regimen.261–263
HOW CAN NOVEL TOOLS AND PHARMACOLOGICAL INTERVENTIONS
CONTRIBUTE TO ENDING TB
EPIDEMICS?
Recent years have seen unprecedented innovation pertaining to new diagnostic tests and drugs for TB. These have served to galvanize research, policy, and healthcare provider communities after long periods of slow progress, and also stimulated commercial research and development where there was previously little.150 Here, we summarize what is known about the epidemiological impact of these recent tools, lessons learned from their implementation, and the potential epidemiological effect of future interventions.
Reducing the risk of TB before infection
The current vaccine, BCG, has low efficacy in preventing infectious TB in countries with a high disease burden.264 Thus, even with the very high coverage now achieved, BCG is unlikely to have any substantial impact on transmission, and hence incidence, because its main effect is to prevent serious (but non-infectious) disease in children. The manufacture of a new, high-efficacy vaccine would change the focus of TB control from treatment to prevention. In some models, a “pre-exposure” vaccine that prevents infection may have a greater impact than a “post-exposure” vaccine that stops progression to disease among those already infected (Figure 2.10).180 However, it is difficult to predict the impact of different vaccines until we know more about their mode of action and their efficacy in clinical trials. Furthermore, although the effect of different theoretical vaccines with pre-specified characteristics can be comparatively modeled, it should be noted there is a lack of consensus on the potential epidemiological effect of preversus post-exposure vaccines.265 There are approximately 20 vaccine candidates at different stages of clinical trial pipeline.266
Reducing the risk of TB after infection
Vaccines or drugs delivered to individuals with latent infection can improve TB control; the development of new diagnostic tools that target these individuals most at risk of progression is needed. Neither tuberculin skin tests nor novel commercially available diagnostics for latent infection such as interferon-gamma release assays appear to be particularly good predictors of the
|
250 |
|
|
|
|
rate/100,000/yr |
200 |
|
|
No intervention |
|
150 |
Mass vaccination |
Neonatal |
|
||
(post-exposure) |
|
||||
|
|
|
|
|
|
Incidence |
100 |
Mass vaccination |
|
|
|
|
(pre-exposure) |
|
|
||
50 |
|
|
|
|
|
|
|
|
|
|
|
|
|
Dual action vaccine |
|
|
|
|
0 |
|
|
|
|
|
2010 |
2020 |
2030 |
2040 |
2050 |
Figure 2.10 Hypothetical impact of four vaccination strategies on TB incidence rate. Calculations have been carried out with an agestructured mathematical model20 set up to investigate the effect of vaccination on a TB epidemic like that in South Asia with an annual incidence set at about 200 per 100,000 population in 2015. Mass vaccination of uninfected populations (pre-exposure) would reduce the annual incidence to 20 per 100,000 in 2050. In a country the size of India, this would correspond to prevention of 50 million cases. A dual-action vaccine active both preand post-exposure would prevent a further 5 million cases, reducing the incidence to 14 per 100,000. (From Young DB, and Dye C.180)