

5 курс / Пульмонология и фтизиатрия / Clinical_Tuberculosis_Friedman_Lloyd_N_,_Dedicoat
.pdf80 Using Genotyping and Molecular Surveillance to Investigate Tuberculosis Transmission
Strain A |
Strain B |
IS6110 insertion site
PvuII restriction site
IS6110 probe
|
Hybridisation with labelled IS6110 |
|
|
DNA |
|
|
DNA |
digestion |
|
|
digestion |
A |
A |
B |
B |
Separate by |
Separate by |
gel electrophoresis |
gel electrophoresis |
Figure 5.1 IS6110-based RFLP analysis. The DNA from two strains of M. tuberculosis are depicted schematically. After the DNA has been extracted from the mycobacteria (this step is not illustrated), the DNA is cleaved using PvuII, a specific restriction endonuclease (arrows). In reality, thousands of fragments of DNA are created and then separated according to molecular weight by gel electrophoresis. At this stage, thousands of bands produce a nearly confluent image that is difficult to interpret. By hybridization with an IS6110 probe (circle), only those fragments containing IS6110 will be visible on the gel. In this example, the two strains each have four copies of IS6110, but they differ in location on the gel.
Strain A |
Spacer |
|
Spacer |
|
Spacer |
|
|
|
|
|
Spacer |
|
Spacer |
Spacer |
DR |
1 |
DR |
2 |
DR |
3 |
|
|
|
|
DR |
7 |
DR |
8 |
43 |
|
|
|
|
|
|
|
|
|
|
|||||
Primers |
|
|
|
|
|
|
|
|
|
|
|
|
|
|
PCR |
|
|
|
|
|
|
|
|
|
|
|
|
|
|
products |
|
|
|
|
|
|
|
|
|
|
|
|
|
|
Strain B |
Spacer |
|
Spacer |
|
Spacer |
|
Spacer |
|
Spacer |
|
|
|
Spacer |
Spacer |
|
|
|
|
|
|
|
|
|||||||
DR |
1 |
DR |
2 |
DR |
3 |
DR |
4 |
DR |
5 |
|
|
DR |
8 |
43 |
|
|
|
|
|
|
|
|
|
||||||
Primers |
|
|
|
|
|
|
|
|
|
|
|
|
|
|
PCR |
|
|
|
|
|
|
|
|
|
|
|
|
|
|
products |
|
|
|
|
|
|
|
|
|
|
|
|
|
|
A
B
5 |
10 |
15 |
20 |
25 |
30 |
35 |
40 |
|
|
|
Spacer |
|
|
|
|
Figure 5.2 Spoligotyping. In the upper part of the figure, the direct repeat (DR) region is illustrated for two strains of M. tuberculosis. In this example, only spacers 1–8 are illustrated in detail. Strain A is missing spacers 4–6 and strain B is missing spacers 6–7 (additional spacers are missing but not highlighted in the figure). Polymerase chain reaction (PCR) amplification of the conserved DR locus is performed using two sets of primers depicted with the arrows. The resulting PCR products are hybridized to a membrane containing covalently bound oligonucleotides corresponding to each of the 43 spacers. Each strain of M. tuberculosis produces a positive (black) or negative (white) signal at each spacer location. In this example, strain A is missing eight spacers and strain B is missing five. The resulting genotype pattern can be converted into a binary code for easy data sharing.
Книга в списке рекомендаций к покупке и прочтению сайта https://meduniver.com/

Genotyping methods 81
and can be recorded in binary or octal format to facilitate intralaboratory comparisons. The procedure is rapid and requires small amounts of DNA, which means it can be carried out on nonviable organisms. A disadvantage of spoligotyping is the lower discriminatory power,6,7 which occurs partly because spoligotyping focuses on the direct repeat region only. Spoligotyping can be used to detect lineages that are characterized by spacer deletions, such as Beijing strains that have lost 34 spacer sequences.8 In combination with other genotyping methods, spoligotyping can provide a highly accurate discriminatory system.6,9
MIRU-VNTR typing detects the number of tandem repeats at multiple loci in the genome (Figure 5.3). The discriminatory power of MIRU-VNTR increases in proportion to the number of loci that are included.10–12 It is rapid, can be carried out on very early cultures, shows excellent reproducibility between laboratories,13,14 and is cheaper than other typing methods. The results are produced as a numerical string, so they can easily be compared on a national and international level, when loci are reported in the same order. The proposed international standard is 24 locus MIRU-VNTR,10 and has been implemented prospectively for public health use in the United States,9,15 the Netherlands, and the United Kingdom.16 Studies have shown that the discriminatory power of MIRU-VNTR typing is slightly lower than IS6110-RFLP for identifying molecular clusters10,17 but is more discriminatory for low IS6110 copy strains.18–20 The discriminatory power is higher than spoligotyping9,21–23 and, if used in combination, is comparable to IS6110-RFLP for detecting clusters in both low9,21,22,24 and high11,25 TB incidence settings.
Strain A
Locus 1 |
Locus 2 |
3 copies |
4 copies |
Strain B
3 copies |
2 copies |
Strain A
M 1 2 3 4
Digital VNTR profile |
3 |
4 |
2 |
3... |
Whole-genome sequencing
The M. tuberculosis genome was first sequenced in 1998 using the dideoxy-chain-termination method;26 however, time and cost considerations precluded large-scale WGS of M. tuberculosis isolates for molecular surveillance purposes. Next-generation sequencing technologies have allowed WGS of M. tuberculosis isolates to become more rapid and affordable. Unlike genotyping methods that examine only a small portion ( 1%) of the M. tuberculosis genome, WGS analysis examines 90% of the genome. Approximately 10% of the remaining M. tuberculosis genome is comprised of PE and PPE genes; homology among members of this large gene family make these genes difficult to analyze accurately. By expanding the genomic coverage and examining variation at the nucleotide level, WGS analysis captures much more of the genetic diversity among M. tuberculosis isolates and allows for greater resolution to distinguish differences among strains.
WGS data can be used to perform single nucleotide polymorphism (SNP) analyses. Using SNP data, a phylogenetic tree can then be generated showing the evolutionary relationships among the isolates in the analysis (i.e., the direction of genetic change) in relation to a most recent common ancestor (MRCA). The MRCA is a hypothetical genome type from which all isolates on the tree are descended and serves as a reference point for examining the direction of SNP accumulation (Figure 5.4). For reference, Walker et al. estimated the rate of change in M. tuberculosis DNA sequences is approximately 0.5 SNPs per genome per year (95% CI 0.3–0.7), and the rate of change was rarely more than five SNPs
Locus 3 |
Locus 4 |
|
|
Locus 12+ |
|
2 copies |
3 copies |
|
|
|
|
3 copies |
|
|
1 copy |
|
|
|
|
|
Strain B |
|
|
Loci 1–4 |
M |
1 |
2 |
3 |
4 |
3 2 3 1...
Figure 5.3 MIRU-VNTR. Portions of the DNA from two hypothetical strains of M. tuberculosis are depicted. Only four of the standard 24 loci are illustrated. In this example, strains A and B have three copies of the repeat at locus 1, whereas strain A has four copies at locus 2 and strain B has only two copies. In the lower half of the figure, the loci are depicted along the top of the gels. There is a molecular weight standard (M) on the left side of each gel. The loci move down the gel, based on molecular weight, so those at the top of the gels are larger pieces of DNA that contain more copies of the repeat than those at the bottom of the gel. This information can be digitized to provide an easy way to share information between laboratories. For example, strain A would be given the identifier 3423 and strain B would be given the identifier 3231.

82 Using Genotyping and Molecular Surveillance to Investigate Tuberculosis Transmission
Reference-based assembly and SNP identification
|
|
|
||
|
A T G C T G G C A G T C G A C T |
|
||
Isolate A |
A T G C A |
|
T C G A C T |
|
T G C A G |
C A G T C G |
|||
|
C A G G C A |
T C G A C T |
||
|
|
A G T C G A |
||
|
|
|
||
|
A T G C T G G C A G T C G A C T |
|
||
Isolate B |
A T G C T G |
|
T T G A C |
|
|
T G C T G G C A G T T G |
|||
|
C T G G C |
T T G A C T |
||
|
|
A G T T G A |
||
|
|
|
|
|
SNP filtering |
|
SNPs mapped to |
||
|
phylogenetic tree |
|||
|
|
|
||
|
|
|
|
|
SNPs relative to |
|
|
MRCA |
|
reference |
|
|
|
|
|
Filter |
|
1 |
1 |
|
|
|||
|
out |
|
||
|
|
|
|
|
|
|
|
|
|
SNPs in all isolates |
|
|
|
|
SNPs due to assembly errors |
|
Isolate A |
Isolate B |
|
Low confidence SNPs |
|
|||
|
|
|
||
|
|
|
|
|
Figure 5.4 Whole-genome single nucleotide polymorphism (wgSNP) analysis. The first step of the analysis is reference-based assembly and SNP identification (left of figure). Isolate sequence reads are first aligned to a reference genome (shown in gray) and SNPs relative to the reference genome are identified (bold). Isolate A has a T → A SNP and isolate B has a C → T SNP. SNPs are then filtered to produce a list of informative, high-quality SNPs (middle of figure). High-quality SNPs can then be mapped to a phylogenetic tree to diagram the direction of genetic change in relation to a MRCA. The MRCA is a hypothetical genome type from which all isolates on the tree are descended. Isolates A and B differ by two SNPs and each has diverged one SNP from the MRCA (right of the figure).
in a three-year period.27 Other studies have produced remarkably similar estimates of the “molecular clock” (e.g., 0.3 or 0.4 SNPs per genome per year).28–30 Thus, investigators can assess whether it is likely that recent transmission has occurred by examining the number of SNP differences between isolates from individuals in a cluster. However, since there is no standard method for SNP analysis, SNP thresholds for assessing recent transmission will vary (e.g., ≤5 or ≤12 SNPs), making them difficult to compare across studies. Furthermore, because the mutation rate may be lower during latent infection,31 closely related isolates could also result from reactivation cases from a transmission event in the remote past. Based on U.S. experiences, relatively large SNP differences can rule out isolates from apparent clusters as very unlikely to be related by recent transmission. In contrast, isolates that are closely related may be related by recent transmission, but these isolates cannot be distinguished from isolates from cases due to reactivation based on WGS data alone. In addition, phylogenetic trees can provide some insights into plausible chains of transmission, but they are not the same as transmission diagrams. This limitation is due to many factors, including intra-host genetic diversity, asynchrony of transmission and sample collection, and because some cases that are involved in transmission will not have an isolate included in the phylogenetic analysis. For these reasons, phylogenetic trees are best understood when augmented with epidemiological and clinical data when making inferences about directionality of transmission.
The United Kingdom and United States both have recently implemented prospective WGS for all M. tuberculosis isolates for molecular surveillance purposes, which should allow for further insights via population-based surveillance studies. In addition, multilocus sequence typing (MLST) based on sequencing of the whole genome offers an opportunity to standardize a classification scheme. In one example, Kohl et al. used this gene-by-gene allele numbering approach to develop a core genome MLST (cgMLST) scheme that discriminated between isolates with a comparable resolution to that of whole-genome SNP analysis.32 Aside from use in epidemiological investigation, WGS has the additional advantage of providing species identification and detection of mutations that confer drug resistance. Although WGS of M. tuberculosis currently requires culturing, methods for sequencing directly from
patient samples are being developed that will greatly reduce the time from sample collection to molecular epidemiology and antibiotic susceptibility results for a patient.33,34
RECENT TRANSMISSION
For decades, genotyping has enabled epidemiologists to estimate the amount of TB arising in communities due to recent transmission and identify associated risk factors. Most studies measured the proportion of clustered cases in a population. Many of these studies have been conducted in low-incidence, high-income countries where it is possible to genotype the majority of TB isolates from culture-confirmed cases. By detecting and monitoring transmission, TB control programs can assess the effectiveness of interventions that target groups at higher risk. A common outbreak investigation goal is to combine genotyping data with different sources of clinical, epidemiological, and programmatic data through partnerships that lead investigators to the best conclusions and public health action for control of recent transmission.
Clustering and risk factors for recent transmission
As a proxy for recent transmission, studies have examined the proportions of clustered cases in a population within a specific period. A cluster includes two or more patients with the same genotype; the remaining cases with unmatched genotypes are considered unique. Key assumptions are made that clustered cases are in the same chain of transmission, and that unique cases arise because of reactivation of infection acquired in the remote past.35,36 The proportion of clustering can be estimated either by the “n method,” which calculates the proportion of cases that are clustered out of all culture-confirmed cases with a genotype. Alternatively, the “n−1 method” assumes that the index case has arisen as a result of reactivation; therefore, one case is subtracted from each cluster. Model predictions of transmission suggest that the proportion of clustering using the n−1 method underestimates recent transmission in high-incidence countries where the annual risk of infection remains stable over time.37 This is because
Книга в списке рекомендаций к покупке и прочтению сайта https://meduniver.com/

Recent transmission 83
most cases will have arisen due to recent infection rather than the assumption that the first case results from a reactivation.
Many past studies conducted in Europe, North America, and South Africa have used conventional genotyping methods to show that the proportions of clustered TB cases vary substantially (11%– 72%).35,38–50 A meta-analysis by Fok et al.51 found similar variability in the proportions of clustered cases (7%–72%). Irrespective of incidence rates, demographic and clinical risk factors for clustering were being native born, experiencing homelessness, and having pulmonary, sputum smear-positive disease. Male sex, younger age, and social risk factors, such as alcohol and substance use, were also frequently associated with clustering.
Associations between younger age and clustering may be due to increased interactions within social networks of similar age, the higher likelihood of reactivation in older patients who are more likely to have a unique genotype, or both. An association between clustering of multidrug-resistant TB (MDR TB) and bacteriologic factors also has been suggested.55
Molecular surveillance studies have allowed investigators to characterize patient factors associated with cluster size and growth. A surveillance period of >2 years is generally required for accurate estimates to avoid time censoring and because the periods from infection until progression to disease vary.56,57 For example, a cluster analysis by De Vries et al.58 found that 52% of patients in Rotterdam who were linked to an index case developed TB within one year, 19% in the second year, and 29% in two to five years subsequently. A study period of one year would have missed almost half of the secondary cases. In another Dutch study, Kik et al.46 found that 9% of all clustered cases were part of a large cluster and the remaining 91% were part of small clusters in a two-year period. The authors compared the characteristics of the first two patients in small and large clusters and found that independent predictors for being in a large cluster were younger age, if both patients lived in an urban area or were born in subSaharan Africa, and if the time between diagnosis of the first and second case was less than three months. Similarly, reporting of the first two cases within three months of each other was associated with large cluster size in London.44,59 In British Columbia, large clusters occurred more frequently among Canadian-born patients, residents of rural areas, persons reporting drug use, and the Euro-American lineage of M. tuberculosis.60 In France and the United States, patients experiencing homelessness were often part of larger clusters and outbreaks.42,61 Because these studies demonstrate how to identify specific populations at risk for cluster growth and outbreaks, TB control programs can prioritize certain clusters for further investigation and public health interventions.
Yet, TB transmission occurs when populations occupy settings and communities that facilitate transmission.62 Studies have used geospatial software (e.g., geographic information systems, or GIS) to determine if cases cluster by residence, and, if so, where transmission is occurring. Investigators identified hotspots of TB transmission in China63 and Brazil64 as well as MDR TB hotspots in Moldova65 and Peru.66 To estimate the impact of addressing community transmission, a study in Rio de Janeiro used a steady-state compartmental transmission model.67 They found that when 6% of residents lived in a hotspot, with the assumption that each active TB case in the hotspot caused 0.5 secondary
cases in the community, then targeting individuals in the hotspot with TB control interventions had the same impact on reducing TB incidence as targeting the whole community. This suggests that interventions that target specific transmission settings may be more efficient and cost effective at reducing transmission than an approach that aims to target the entire population. Although spatial analyses of TB case distributions are common, they are heterogeneous in their methods and findings.68
The central problem with using genotype clustering to estimate recent transmission has been that clustered cases are not necessarily part of the same chain of transmission. When an endemic strain is circulating in the population (i.e., a common genotype), cases may have the same genotype without actually being epidemiologically linked by transmission. In low-inci- dence countries, individuals migrating from the same country or region where predominant strains circulate may lead to the importation of common strains; this migration pattern results in molecular clustering that may actually reflect transmission abroad, coincidental reactivations with the same genotype, or both. To help detect possible outbreaks within endemic U.S. clusters, Althomsons et al. developed a statistical method to identify unexpected growth.69 Defining clusters based not only on matching genotypes, but also on geographic proximity, can often serve as a better proxy for recent transmission. A progression of U.S. studies of recent transmission is illustrative. In the United States, Moonan et al.70 found that clustering based on geospatial concentrations not subject to artificial political boundaries gave the most conservative estimate (25%) of recent transmission. France et al. developed a plausible-source case method,71 which further refined estimates of recent transmission using clinical and demographic criteria in addition to genotype-matched clustering of cases that are proximal in time and space. Applying this method, Yuen et al. estimated that 14% of U.S. cases were attributed to recent transmission.72 Similar to past studies of clustering, transmission was associated with native birth, homelessness, and belonging to a minority race. Because molecular clustering is a function of the discriminatory power of the genotyping method, another strategy is to improve the method itself. In fact, the progression of studies coincides with a transition from using 12 to 24 loci MIRU-VNTR for genotyping in combination with spoligotyping.73 The U.S. transition to prospective WGS for molecular surveillance is therefore expected to further lower recent transmission estimates based on the enhanced discriminatory power of WGS.
Another important issue is that only cases that are culture positive will have an M. tuberculosis isolate available for genotyping. Even in countries with robust surveillance systems, a significant proportion of cases will not be culture confirmed (e.g., 22% in the United States in 2017).74 Exclusion of clinically diagnosed cases can lead to underestimates of recent transmission and may prevent timely identification of transmission chains. Estimates may be particularly affected where there are pediatric or extrapulmonary cases in clusters because these cases are more often culture negative.75 De Vries et al.40 showed that culture negative cases in the Netherlands frequently had a contact to a pulmonary case, which suggests that they are likely part of a recent chain of transmission.

84 Using Genotyping and Molecular Surveillance to Investigate Tuberculosis Transmission
Cluster and outbreak investigation
National and regional TB control programs can design molecular surveillance systems to detect clusters of TB cases prospectively, as early indicators of transmission and possible outbreaks that might otherwise be undetected. However, these systems have several necessary requirements to function effectively as a public health intervention, which means that all aspects of a system need to be planned. These requirements include a public health laboratory service to genotype an isolate from each culture-confirmed case, timely isolate submission and linkage of genotyping results with case report data (i.e., surveillance data with basic clinical, demographic, and risk factor information), some precision locating cases geographically, and commitment to an information system for efficient dissemination and investigation of clusterrelated data. For purposes of cluster detection, alerting, and investigation, programs can use a surveillance database to apply standardized classification schemes that designate new strains based on unique results of conventional genotyping or MLST, and identify matches to existing results. For example, the U.S. Centers for Disease Control and Prevention (CDC) sponsors the TB Genotyping Information Management System (TB GIMS), which detects genotype-matched clusters that are geospatially concentrated.76 Weekly alerts are automatically sent to state and local TB program staff for cluster prioritization and possible public health action.77 Similarly, MIRU-VNTR strain typing data are integrated within a web-based national TB surveillance system in the United Kingdom, allowing for cluster detection and investigation.78 Although universal genotyping services and information systems require major investments, low-incidence countries could consider establishing them to help progress toward TB elimination. As an alternative, programs can selectively apply retrospective genotyping to help determine if cases in an apparent cluster are likely to be part of the same chain of transmission if cultures are routinely performed and isolates can be obtained. Retrospective genotyping results may still allow programs to make informed decisions as to whether further public health action is required, but delays obtaining this information can lead to unnecessary expenditures (e.g., extended contact tracing and screening).
When review of molecular surveillance data suggests that a cluster should be prioritized for further action, an epidemiological investigation can help determine if transmission among reported cases occurred recently and locally.79 Early twenty-first century examples illustrated the particular challenge of determining whether transmission events were missed by an investigation or whether genotyping imprecision had falsely detected clustering that did not represent actual transmission. Using IS6110-RFLP, for example, investigations found epidemiological links in less than half of clustered cases in Germany and the Netherlands.48,80 Studies in Canada and the U.K. demonstrated that isolates with matching MIRU-VNTR genotyping patterns were further discriminated using WGS, which indicates that recent transmission has also been overestimated by MIRU-VNTR.27,81 A study in Switzerland used WGS to show that clustering based on MIRUVNTR differentially misestimated recent transmission depending on nativity. WGS confirmed three quarters of clusters involving Swiss-born patients, but only one quarter of clusters involving
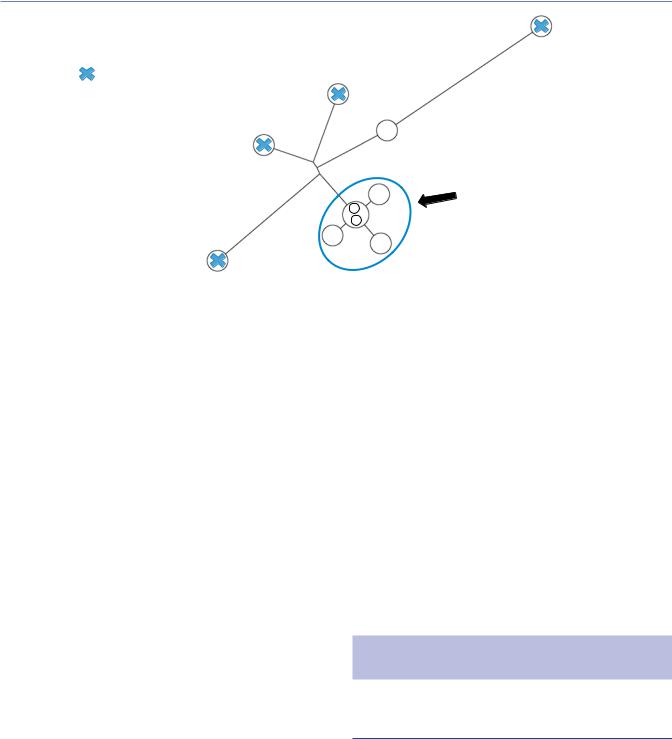
non-native patients.82 On the other hand, Walker et al. found that some cases with isolates that differed by one MIRU-VNTR locus were epidemiologically linked and considered to be in the same chain of transmission by WGS, meaning that clustering based on MIRU-VNTR typing where all 24 loci match can also underestimate recent transmission. However, cases with 24 loci MIRU-VNTR profiles with more than one locus mismatch mostly were not closely genetically related or epidemiologically linked (Figure 5.5).27
Several published investigations have also evaluated the use of WGS for investigating clustering and transmission of specific lineages. Jamieson et al. reported that WGS provided greater resolution for distinguishing isolates in the Manila sublineage, for which conventional genotyping methods had resulted in large clusters that were not epidemiologically meaningful.83 A genomic epidemiology study of TB cluster investigations in Hawaii, where Beijing and Manila lineages are predominant, concluded that WGS is necessary because of the relatively low specificity of MIRU-VNTR for cluster identification.84 Gurjav et al. reached a similar conclusion with SNP analyses of East-African and Beijing lineage isolates in Australia that falsely clustered by 24 loci MIRU-VNTR.85 In Greenland, a population-based comparison of genotyping showed that SNP analyses discriminated 182 isolates of Euro-American lineage from five MIRU-VNTR clonal complexes (≤2 loci differences) to four genomic clusters with further diversity described by phylogenetic branching and sub-lineage assignations.86
The added discriminatory resolution of WGS analyses now offers a far more powerful public health tool for investigating outbreaks of recent transmission. A 2018 Bayesian phylodynamics analysis conducted in Kinshasa, Democratic Republic of Congo quantitatively estimated how different genotyping methods performed for isolates collected from TB treatment clinics.87 WGS allowed for discerning recent transmission within a 10-year time period (e.g., with a five SNP threshold), while time spans for clustering based on 24 loci MIRU-VNTR (several decades) and spoligotyping (hundreds of years) were far greater. Although isolates that are closely related by WGS may help provide valuable evidence of recent transmission, other types of data are usually required to distinguish these isolates from isolates due to reactivation. Furthermore, phylogenetic trees representing directionality in SNP accumulation are not equivalent to network visualizations that depict directionality of transmission, for reasons described previously (see Whole-genome sequencing). In a large outbreak investigation of isoniazid (INH)-resistant TB in London, for example, Casali et al. showed that nearly all of the 344 isolates from cases identified over a 14-year period were closely related or indistinguishable (≤5 SNPs).88 The investigators noted the occurrence of multiple transmission events without SNP accumulation and an inability to infer transmission directionality for most cases. Such limitations may be particularly challenging in closed populations and settings where transmission is ongoing,89 such as isolated communities and congregate facilities (e.g., homeless shelters and prisons). Newer mathematical methods show promise for resolving some of the limitations of reliance on non-stan- dardized SNP data and thresholds, such as incorporating detailed clinical and time data,90,91 but have not yet been widely adopted into practice.
Книга в списке рекомендаций к покупке и прочтению сайта https://meduniver.com/

Recent transmission 85
SNPs
1001–2000
701–1000
501–700
401–500
301–400
201–300
101–200
71–100
51–70
41–50
31–40
21–30
13–20
8–12
7
5
4
3
1
0
0 |
2 |
4 |
6 |
8 |
10 |
12 |
14 |
16 |
18 |
20 |
22 |
MIRU-VNTR loci
Figure 5.5 All isolates with complete 24-locus MIRU-VNTR profiles were compared. As each isolate was compared to every other isolate, the number of SNPs and MIRU-VNTR loci at which they diverge was recorded. The results are plotted on a log scale. Circle sizes are proportionate to the number of pairs diverging by a specific number of loci and SNPs. The dashed box includes isolates that differ by five or fewer SNPs. SNP = single-nucleotide polymorphism; MIRU-VNTR = mycobacterial interspersed repetitive unit-variable number tandem repeat. (Adapted from Walker TM et al. Lancet Infect Dis. 2013;13(2):137–46.)
Integrating WGS data with different sources of clinical, programmatic, and epidemiological data is a standard of public health practice for outbreak investigations. By interpreting WGS data in the context of these other data, TB control programs can make inferences that are not possible with any single data source. Basic clinical data on timing and degree of infectiousness for pulmonary cases (e.g., sputum smear positivity and grade, cavitation on chest radiograph), or lack of infectiousness for exclusively extrapulmonary and pediatric cases, are informative. Latent TB infection screening results from contact investigations can help determine if recent transmission has occurred (e.g., conversion rates for tuberculin skin testing or interferon-gamma release assays). This strategy is advantageous because many local TB control programs in high-income countries routinely ensure identification, screening,
and treatment of contacts of infectious cases for active disease and latent infection. Graphical representations of clustered cases can be useful to visualize epidemiological links, results of WGS analysis, common risk factors, and settings that are relevant for characterizing transmission (Figure 5.6). Yet, WGS analysis results should be reviewed as soon as available to rule out genetically distant isolates and exclude clustered cases that are unlikely to be related by recent transmission. An apparent cluster can often be redefined as one or more sub-clusters (Figure 5.7), which may narrow or refine the scope, focus, and goals of the investigation. This strategy can save considerable time and resources in subsequently pursuing epidemiological links. Estimates of efficiency gains from a Dutch study of 535 isolates genotyped by MIRU-VNTR and WGS are compelling.92 WGS analyses reduced clustering by 50% and doubled the
ve ti Rela
Relative
2004–2013
|
Drugs |
|
Dr |
|
|
|
ugs |
|
Congregate |
site |
|
|
|
|
|
site |
Church |
ngregate |
||
Co |
|
il |
|
|
Ja |
|
|
ngregate |
Drugs |
|
|
e |
C |
|
friend |
||
|
o |
|
|
|
|
sit ngre |
|
si |
|
|
|
|
a Co |
|
Family |
|
|
|
g |
|
|
||
|
te |
|
|
|
|
|
Relati |
|
Fri |
|
|
|
|
|
|
end |
|
|
|
ve |
|
|
|
|
|
|
|
Shared |
|
|
|
|
|
t |
|
|
|
|
|
contac |
|
Spouse
2014–2016
Year of diagnosis
|
d |
|
oo |
h |
|
Neighbor |
|
Figure 5.6 Plausible transmission network showing integrated wgSNP, clinical, and epidemiological data for a large cluster of patients with genotype-matched isolates. Patients in the pre-outbreak period (2004–2013) are shown in gray. Patients in the outbreak investigation period (2014–2016) are color coded, as orange (closely related by wgSNP analysis), blue (distant by wgSNP analysis), and yellow (highly infectious, presumed source case for most secondary cases). Solid lines denote definite epidemiological links; dashed and dotted lines denote probable and possible links, respectively. Social relationships and shared risk factors and presumed transmission settings are overlaid.
86 Using Genotyping and Molecular Surveillance to Investigate Tuberculosis Transmission
= genetically distant, and unlikely to be involved in recent transmission
|
|
|
|
24 |
|
9 |
|
|
MRCA |
|
|
|
|
|
6 |
11 |
|
10 |
|
|
|
|
|
|
|
|
6 |
|
Closely related isolates, which |
|
|
|
1 |
|
|
|
|
may be involved in recent |
|
|
|
|
|
|
18 |
|
1 |
|
transmission |
|
|
2 |
||
|
|
|
|
Figure 5.7 Phylogenetic tree showing wgSNP analysis results for a hypothetical cluster of genotype-matched isolates. SNPs are mapped to diagram the direction of genetic change in relation to a MRCA. In this example, a sub-cluster of five isolates that are closely related (0–2 SNPs) may be involved in recent transmission. The remaining four genetically distant isolates are unlikely to be involved in recent transmission (i.e., they can be ruled out).
proportion of epidemiological links subsequently identified. In Oxfordshire, United Kingdom, Walker et al. showed that investigators’ understanding of transmission improved from 42% to 69% of 26 “transmission events” within clusters defined by WGS.93
Using epidemiological links to investigate transmission can be problematic because they are not necessarily equivalent to transmission events.94,95 In Norway, an investigation of a community outbreak of 14 TB cases found that the patients all had social contact with each other and had a common link through a church, but six different genotypes were identified.96 In fact, several studies have shown that contacts with TB disease do not necessarily have the same genotype as the index case, even if they live in the same household.97–99 This appears to be more common in high-inci- dence settings where the risk of infection is higher. In Cape Town, South Africa, less than half of secondary cases were found to have the same genotype as other TB cases in the household.99 Using WGS, Glynn et al. showed that less than 10% of TB cases in rural Malawi could be attributed to close contacts.100 Another issue is that, even with rigorous investigation, epidemiological links can be elusive in communities where TB is stigmatized or patients are otherwise unwilling to name contacts or provide information on their social activities and relationships. Information may not be divulged by a patient because of many factors, such as the way that the questions are asked, the questions themselves, insufficient training in interviewing techniques, language barriers, and lack of trust. Nevertheless, identification of higher risk groups, social networks, and community settings can help target public health actions to prevent transmission, so various strategies that use genotyping data have been developed. Sintchenko et al. found that a second interview for patients with indistinguishable genotypes was more effective than other methods in detecting recent secondary cases.101 Jackson et al. effectively used a combination of genotyping results and a social networking questionnaire that consisted of open-ended questions and themes relating to causes of TB and understanding transmission.102 Gardy et al. used WGS
results and social networking questionnaires with open-ended questions, which was also very successful in identifying settings where confirmed transmission had occurred.81
In conclusion, genotyping results should be used in tandem with clinical, programmatic, and epidemiological data to detect and investigate TB transmission. WGS can reduce estimates of molecular clustering that do not actually represent transmission, and help avoid identification of epidemiological links that are spurious. However, WGS data also have key limitations, including an inability to characterize the relatedness of cases that are not culture-confirmed. Therefore, the most sensible strategy is to detect outbreaks early using available genotyping data and work iteratively to combine other data sources that help ensure that epidemiological information is sufficiently collected to identify transmission risk factors and settings.
CLINICAL AND PUBLIC HEALTH
APPLICATIONS
TB lineage, severity of disease, and transmission
In 2002, Fleischmann et al. reported the first whole-genome sequence comparison of two M. tuberculosis isolates, which identified genetic variation in the form of long sequence polymorphisms (LSPs) and SNPs.103 In 2006, Gagneux et al. used LSPs to classify M. tuberculosis into six main lineages and 15 sublineages, and a significant association between lineage and world region was identified.104 Furthermore, the study found that lineage was associated with place of birth and ethnicity in a random sample of TB cases in San Francisco. For example, East Asian lineage, which is most common in East Asia, was found in patients born in China, the Philippines, and Vietnam as well as in American-born
Книга в списке рекомендаций к покупке и прочтению сайта https://meduniver.com/

Clinical and public health applications 87
citizens of Chinese or Filipino descent. The geographical distribution of lineages defined by Gagneux and colleagues is supported by other studies,105–113 and there is generally good concordance for lineage assignation between SNP analysis and MIRU-VNTR,114 spoligotyping,115,116 and IS6110-RFLP.117 Free web-based bioinformatics tools that facilitate assignation of TB strains to lineages based on spoligotype or MIRU-VNTR are available. These include MIRU-VNTR-plus118 (http://www.miru-vntrplus.org), SpolDB4116 (http://www.pasteur-guadeloupe.fr), and TB-Insight119 (http:// tbinsight.cs.rpi.edu/run_tb_lineage.html).
The identification of an M. tuberculosis phylogenetic framework has allowed for study of the effects of lineage on transmission and severity of TB disease. Several studies have demonstrated that Beijing/East Asian strains (also known as lineage 2) are more transmissible and may be more virulent compared to strains of other lineages. Beijing/East Asian strains comprise 13% of all global TB isolates and are the most widely disseminated across the world.116 A study of 4,987 Beijing/East Asian lineage isolates from 99 countries that used MIRU-VNTR typing combined with WGS showed that this lineage originated in the Far East and had multiple expansions into other regions of the world.120 The Beijing/East Asian lineage has been associated with pulmonary disease and sputum smear positivity as well as increased rates of molecular clustering when compared to other lineages.121–124 The virulence of Beijing/East Asian strains has been attributed to production of a phenolic glycolipid (PGL) that is able to modulate the host immune response.125 Beijing/East Asian strains are able to produce PGL because they have an intact polyketide synthase gene (pks1–15), but this gene is disrupted in other lineages. However, expression of PGL varies among Beijing/East Asian strains and effect of PGL on host immune response seems to depend on the genomic context of the strain.126
Strains of the Beijing/East Asian lineage can also be further divided into sublineages based on presence or absence of genomic regions of difference (RD) or SNP analysis. In epidemiological studies, modern Beijing sublineages have increased molecular clustering and ability to cause disease compared to ancestral Beijing sublineages.127,128 This difference is apparent in animal models as well, with modern sublineages of Beijing/East Asian strains inducing a lower proinflammatory response and resulting in increased mortality in mice compared to ancestral Beijing sublineages.129–131
Conversely, there is also evidence to suggest that non-East Asian lineages are associated with extrapulmonary disease, lower transmissibility, or both. For example, the East African-Indian lineage, which is the predominant lineage in the Indian subcontinent, has been shown to have lower rates of transmission and cause less severe forms of TB compared with other lineages.132,133 Indo-Oceanic and East African-Indian lineages were found to be associated with exclusively extrapulmonary disease, even when controlling for host factors.122 Guerra-Assuncao et al. used WGS to conduct a population-based analysis of clustering and transmissibility in Malawi and found that Indo-Oceanic strains had the lowest measures of transmissibility.134 Furthermore, EuroAmerican sublineages were found to vary in transmissibility, with the RD145 sublineage having the highest frequency of new infections and sublineage RD219 having the lowest.135 On the other
hand, Lee and colleagues concluded that successful transmission of Euro-American lineage M. tuberculosis in Nunavik, Québec was likely driven by environmental and social factors (i.e., not strain characteristics).136
Given the established association between lineage and geographical region, changing trends in the lineage distribution in a population are likely to be driven either by shifting demographic or migration patterns or by the introduction of foreign strains into the population that replace less transmissible native strains.41 Therefore, the prevalence of these strains in the population should be monitored because this could have important implications for TB control strategies. For example, an increase in the frequency of Beijing strains could hypothetically lead to a higher number of rapidly growing outbreaks; active case finding to ensure early diagnosis and treatment of secondary cases and contacts may be important to control transmission and prevent additional cases. Conversely, if circulating strains are more likely to cause extrapulmonary disease, then it may be more important to raise healthcare providers’ awareness of atypical disease presentations to ensure timely diagnosis.
Transmission of drug-resistant TB
The number of drug-resistant cases of TB continues to increase globally.137 To predict future trends, it is important to understand the transmission dynamics of drug-resistant TB. The spread of drug-resistant strains will depend on their relative fitness compared to drug-susceptible strains, measured by their ability to reproduce and be transmitted. Mutations that confer resistance to antibiotics usually occur in genes that are essential for bacterial growth and thus could result in a “fitness cost” to the bacteria, causing them to have a lower transmission rate or reproductive rate (R0).138 In order to compensate for such mutations, bacterial populations can acquire secondary mutations to restore the original level of fitness.139 If drug-resistant strains are less transmissible, then the majority of drug-resistant TB cases would be expected to result from acquired resistance.140 However, studies using molecular and epidemiological data and modelling have indicated that primary transmission of drug-resistant strains is the main driver of increasing rates of multidrug-resistant (MDR) TB worldwide.141,142
There is some experimental evidence to suggest that drugresistant strains have reduced fitness compared to sensitive strains, but conflicting results have been found in epidemiological studies. Using animal models, experiments in the 1950s showed that INH-resistant strains were less virulent than susceptible strains.143,144 However, more recent studies found that the most common mutation in the katG gene, S315T, which confers INH resistance, does not affect bacterial fitness.145,146 This finding is supported by several epidemiological studies. A large study in the Netherlands showed there was no difference between the proportion of clustering of INH-resistant strains compared to sensitive strains, and increased clustering was observed for isolates with the S315T mutation compared to INH-resistant strains with other mutations.147 In rural China, INH-resistant strains with the S315T mutation also showed a higher proportion of clustering compared to sensitive strains.148 In San Francisco, patients infected with INH-resistant TB only transmitted to secondary cases if isolates

88 Using Genotyping and Molecular Surveillance to Investigate Tuberculosis Transmission
had this particular mutation.149 Similarly, the S531L mutation in the rpoB gene, which is the most common rifampin resistanceconferring mutation in clinical isolates, had the lowest fitness cost of any of the experimentally derived rpoB mutations tested in a competitive fitness assay. Furthermore, clinical isolates with this mutation showed no measurable fitness cost when compared to rifampin-susceptible ancestor isolates from the same patient.150
Primary transmission of MDR TB has been documented in both high and low incidence countries.121,151–154 Studies to estimate the relative contributions of primary transmission vs. acquired resistance to the overall burden of MDR and extensively drug-resistant (XDR) TB can be difficult because resistance can arise independently multiple times in the same strain, so estimates will depend on the discriminatory power of the genotyping method that is used.155 Also, ruling out patients as having primary transmission based on past history of treatment may overestimate the contribution of acquired resistance. A study of previously treated patients in Shanghai, China found that 59% of patients with increasing drug resistance resulted from exogenous reinfection.156 Many epidemiological studies of MDR and XDR TB transmission have been conducted in South Africa, where the burden is one of the highest globally. In KwaZulu-Natal province, where co-infection of TB and HIV is high, the majority of XDR TB cases were likely due to transmission.157 Epidemiological links for these cases indicated that local hospitals, which typically have poor infection control measures, are an important transmission setting. This demonstrates that MDR and XDR TB are able to spread easily in settings that facilitate transmission, particularly in populations with a high prevalence of HIV and other risk factors for the development of active TB disease.
An association between MDR TB and the Beijing lineage has been consistently found globally.106,107,158–162 It has been hypothesized that this association could be due to a biological mechanism and that Beijing strains may have a higher mutation rate compared to those of other lineages, but an in vitro study that compared mutation rates between lineages found that there were no differences.163 It has also been suggested that the association between MDR TB and Beijing lineage is coincidental because Beijing strains are more common in areas of the world where the emergence of MDR TB has occurred due to poor TB treatment and control programs. Furthermore, if Beijing strains transmit more readily than other lineages, then it will appear that they have acquired mutations more easily in areas of a high incidence of MDR TB.127 Indeed, epidemiological studies have provided some evidence that Beijing MDR TB strains are more transmissible than non-Beijing MDR TB strains.124,162 If the combination of MDR TB and Beijing strain does lead to higher rates of transmission, the emergence of Beijing strains in South Africa164 and the recently identified association with XDR TB is worrisome.152
Current evidence suggests that the fitness of drug-resistant strains may be dependent on particular mutations or lineage. However, factors associated with geographical region, host factors, and the transmission setting also appear to play an important role in predicting the likelihood of transmission and outbreaks of drug-resistant strains. Large epidemiological studies combining clinical, social risk factor, and demographic data with molecular information and contact tracing and screening results are required to further investigate the transmissibility of drug-resistant strains.
Reactivation vs. reinfection
Recurrent episodes of active TB disease in the same patient can occur because of reactivation of the previous episode of TB disease following incomplete treatment or relapse, or by exogenous reinfection during a new transmission event.165 This distinction is programmatically important for TB control in a population because different interventions are required. Cases of recurrent TB due to relapse imply that enhanced efforts are needed to ensure treatment efficacy, possibly through greater attention to adherence, longer duration of therapy, or attention to drug choice and dosing. Recurrent TB due to reinfections indicates ongoing transmission. To help identify recurrences, some programs may add a time component to account for the period when completion of therapy or cure (e.g., sputum culture conversion to negative) is expected for the earlier episode. For example, the U.S. National TB Surveillance System (NTSS) counts in national incidence reporting a case of recurrent TB disease only ≥12 months after the last clinical visit for TB treatment.166 Because most relapses occur within a year following treatment completion,167 NTSS recurrences are sometimes described as “late recurrences.”168 NTSS also collects information on cases with recurrence within 12 months; however, these cases are not counted in national surveillance for incidence.
TB control programs can use conventional genotyping and WGS data to help differentiate between reactivation and reinfection if historical isolates are available from previous TB episodes. Genotyping results should be indistinguishable or very similar for cases of recurrent TB due to reactivation, and are expected to differ for cases of reinfection. Using conventional genotyping, numerous studies have found that reinfection is common in countries with a high incidence of TB,169–172 presumably because the likelihood of contact with an infectious individual is high. Furthermore, HIV co-infection is associated with increased susceptibility to recurrent disease following reinfection (i.e., immunodeficiency due to untreated, advanced HIV). More recently, studies using clinical trial data from Malaysia, South Africa, and Thailand have demonstrated that SNP analyses of WGS data are superior to MIRUVNTR for differentiation.173,174 Population-based studies using WGS will allow for refined estimates of the proportions of TB cases arising from reinfections. In rural Karonga in Malawi, for example, 20 (27%) of 75 recurrences with paired WGS or IS6110- RFLP data were due to reinfections.175 Reinfections were associated with HIV co-infection; the study also suggested Beijing lineages were overrepresented in cases of reinfection. Conversely, only two instances of reinfection were identified by a MIRU-VNTR and WGS study of the Nunavut, Canada outbreak where M. tuberculosis strains are closely related.89 In low-incidence countries such as Australia, Finland, and the United States, several studies using MIRU-VNTR and WGS have shown that significant proportions (13%–15%) of TB cases arise from reinfection.165,176,177 Using a network model, Cohen et al. found that transmission among individuals who are part of close social networks (i.e., non-random mixing) can result in certain individuals becoming infected multiple times even in low incidence settings.176 This finding is consistent with findings by Interrante et al., showing that a majority of recurrent TB cases among recent U.S. immigrants from Africa (50%) and Mexico (60%) were due to reinfections.165
Книга в списке рекомендаций к покупке и прочтению сайта https://meduniver.com/

Clinical and public health applications 89
However, historical isolates may be unavailable for genotyping. Moreover, even when complete genotyping data are available, distinguishing exogenous reinfections from reactivations depends on an assumption that reinfections are more likely due to transmission of a new M. tuberculosis strain (i.e., a genotype that is different from the previous episode). In geographical areas or transmission settings where a single strain predominates, it is possible for an individual to be repeatedly reinfected with the same strain. These recurrent cases may be misclassified as due to reactivation, which could lead to underestimates of recent transmission. Thus, other data sources are important for characterizing recurrent disease. Based on clinical trial data, predictors of treatment failure or relapse include cavitary disease and smear positivity at completion of 2 months of treatment.178,179 U.S. surveillance data suggest that risk factors for late recurrences differed for non-U.S.- born (HIV infection and smear positivity) and U.S.-born patients (aged 25–44 years, substance use, and treatment supervised by health departments).168 These risk factors may also contribute to the higher mortality observed during recurrent episodes.166 It is important to note that regardless of whether an infectious TB case is believed to have arisen due to primary infection, reactivation, or exogenous reinfection, vigorous contact tracing procedures should be initiated.
Within-host genetic diversity
Most studies on TB transmission have been based on the assumption that individuals are infected with one strain of M. tuberculosis. However, M. tuberculosis genetic diversity within a single host can result from simultaneous infection with two different strains (the so-called mixed infections) or microevolution of a single strain.
Conventional genotyping methods are able to detect simultaneous infection with two different strains within the same TB episode. MIRU-VNTR typing was shown to be more sensitive at detecting mixed infections compared with RFLP or spoligotyping.180 Different genotypes have been isolated from different sites within the body181 and the lungs.182 In high-incidence settings, the proportion of TB cases with mixed infections has been shown to vary between 1% and 19%.183–191 Studies carried out in Shanghai185 and Cape Town,190 which are urban areas of high TB incidence, found that mixed infections were more common in retreatment cases compared to new cases. This finding highlights the importance of exogenous reinfection in recurrent episodes of TB. Conversely, Huyen et al.180 reported that in rural South Vietnam, which has a lower TB incidence, 4.8% of TB cases had mixed infections, and these were associated with cases that were not previously treated.
Within-host genetic diversity can also result from microevolution of a single strain. Although the conventional genotyping methods IS6110 RFLP and MIRU-VNTR have been used to detect microevolution,3,192 these methods greatly underestimate the extent of genetic diversity because they only examine a small portion of the genome. In contrast, WGS has greatly enhanced the ability to detect M. tuberculosis genetic diversity within a single host. Microevolution of M. tuberculosis has been documented when examining a single specimen, specimens from
different sites of disease within the same patient, and specimens collected over time from the same patient. Comparison of WGS data for single colonies from M. tuberculosis isolates revealed that subpopulations of bacteria with unique SNPs are present within an M. tuberculosis isolate.155 A study by Liu et al. of a patient with MDR TB showed the patient had six anatomically distinct lesions in the lung that responded to treatment differently.156 WGS of serial isolates found three dominant subpopulations of M. tuberculosis that differed by 10–14 SNPs, including mutations that are known to confer antibiotic resistance. Walker et al. performed WGS analysis on pulmonary and extrapulmonary isolates from the same patients.27 Of 48 patients, 37 had isolates from the pulmonary and extrapulmonary sites that were identical by WGS analysis and 11 had isolates that differed by one to 11 SNPs, indicating that genetic diversity within a single infecting strain existed in these patients. The same study also examined longitudinal isolates collected from the same patients at intervals ranging from 6 to 102 months; 17 of 28 patients had isolates that differed by one to 10 SNPs.
Intra-host genetic diversity involving mutations that confer antibiotic resistance could have serious implications for patient treatment. If an individual is infected with subpopulations of M. tuberculosis that have different drug-resistance patterns, resistance may not be detected at diagnosis,193 especially if the majority of the bacterial population is fully sensitive. The subsequent emergence of drug-resistant strains within an individual can then lead to treatment failure in the absence of repeated drugsensitivity testing and also transmission of drug-resistant strains to others.183,194,195 WGS could be used to identify individuals with a mixture of drug-resistant and drug-susceptible M. tuberculosis at the start of treatment who may be at higher risk of treatment failure. These individuals would then be monitored more closely throughout treatment and have their regimens modified in response to drug sensitivity results to improve their chances of treatment success.
False-positive cultures and cross-contamination
Culture confirmation of M. tuberculosis is the gold standard for diagnosing active TB disease. Multiple European and U.S. studies conducted using conventional genotyping during the 1990s and 2000s have shown that false-positivity rates can be as high as 4%.196–202 False-positive results are important to identify and prevent misdiagnoses, which can lead to unnecessary patient isolation, treatment, hospitalization, stigma, and costs as well as false clustering and misguided public health actions.202–205 If patients are admitted to the same hospital ward, failure to detect false-positive results can also lead to erroneous inferences that nosocomial transmission has occurred. Causes of false-positive results may include clerical errors (e.g., mislabeling), contamination of medical devices and equipment (e.g., bronchoscopes), and cross-contamination of laboratory samples when M. tuberculosis is inadvertently inoculated into a specimen not containing the bacilli.204 Contamination is more likely to occur during sample processing when samples are batch processed on the same day.206