

86 |
9 Visual Elements and Fonts |
and thus raise living standards. At the same time the audience learned something about one of the world’s biggest (but probably not very well known) countries.
9.9 Choose fonts, characters, and sizes with care
The major organizations on the Internet (e.g., Google, Firefox, Amazon, YouTube) use Arial, or a similar font. Research has shown that if you use an easy-to-read font such as Arial or Helvetica, people are more likely to be persuaded about what you are saying.
Comic sans gives the idea of fun and children, and is thus probably not appropriate in a presentation. Presenters sometimes choose it because they think that by doing so they automatically give their presentation a fun element—but it is actually more difficult to read and does not look very professional. Times Roman is possibly the most common font used for writing documents, but it is more difficult to read than fonts like Arial.
If you use a font size smaller than 28 points, the audience may not be able to read your slide. Use 40 points for titles. But avoid putting complete sentences in capital letters. Signs in airports, highways, and metropolitans are all in lower case letters. Why? Because capital letters are much more difficult to understand.
It may be tempting to use lots of formatting because it makes slide preparation seem more creative. However, your text will be easier to read if you limit underlining, italics, shading, and other forms of formatting to the minimum.
9.10 Use color to facilitate audience understanding
Only use color to help audience understand your visuals, not simply to make them look nice. Be consistent with color; use the same color for the same purpose throughout the presentation.
Website designers know that the background of a website can have a significant effect on whether a surfer is likely to stay and look, and possibly buy. This implies that the background color of your slides may also affect how willing the audience will be to spend time looking at them. The experts suggest using dark text such as blue or black on a medium-light, but not bright background, or light colors on a medium-dark background. Dark colors on a dark background are very hard to read.
A lot of people have problems distinguishing red and green (and also, brown/green, blue/black, and blue/purple); so don’t use those colors in combination. Avoid red as it has associations with negativity—it is the color often used by teachers to make corrections and in finance it indicates a loss.
If you project your slides you will see how different they look from on your laptop. The audience’s ability to see your slides very much depends on the internal and external lighting of the room. If the sun is shining directly onto the screen it makes light colors (particularly yellow) almost impossible to see. Some beamers make red look like blue. Also, bright light considerably reduces the strength of color in photos.
9.11 Choose the most appropriate figure to illustrate your point |
87 |
9.11Choose the most appropriate figure to illustrate your point
Imagine you want to present the following information:
1.the number of different words used in a presentation does not rise significantly with the length of the presentation
2.this means that even in a long presentation the number of words whose pronunciation you may have to practice does not increase very much.
With regard to point (1), a 10-minute presentation will contain a total of 1200– 1800 words, of which 300–450 will be different. The words are “different” in the sense that a presenter may use a total of 300 different words to express himself/herself, but many of these 300 words he/she will use more than once (for example, an, the, this, then), which then gives the total number of words (total words). In a 20-minute presentation the “total words” will be twice as many as in a 10-minute presentation, but the percentage of “different words” will only rise slightly from 300–450 to 320–470. Likewise in a 40-minute presentation.
With regard to point (2), only a small number (around 20) of the “different words” will be words that a presenter does not know how to pronounce, as the vast majority of words should already be familiar to the presenter. In addition, this number does not rise significantly with the length of the presentation—for example, in a 20-minute presentation it may only rise from 20 to 22.
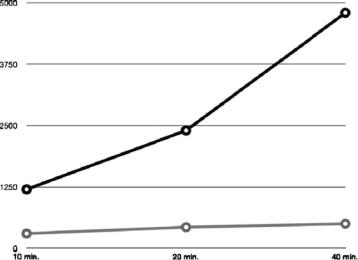
Below is a graph that is designed to illustrate the information given above.
88 |
9 Visual Elements and Fonts |
The presenter could say
This graph clearly shows that the total number of words, which is shown in the black line, in a presentation changes in direct relation to the number of minutes of the presentation. On the other hand, the number of different words, which is represented by the gray line, does not increase very much.
However, there are some problems with the graph and the explanation:
•there are no labels, either for the y-axis or for the two lines, so initially the audience will be confused and the presenter is forced to explain what the axes mean
•the most interesting information is contained in the gray line (which represents the total different words), but the way the y-axis has been scaled does not make it clear how many different words are used for each type of presentation
•the audience will be left thinking “what does this all mean?” or “why are you telling me this?”
In fact, there is nothing said about what the connection is with pronunciation (point 2 above), which is supposed to be the key fact that the presenter wants to give to the audience. If you choose the wrong type of illustration, you may find it more difficult to talk about your key points.
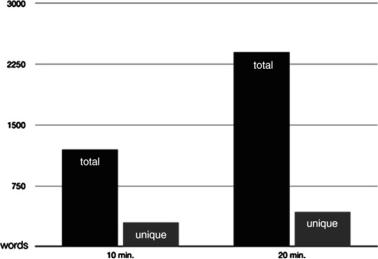
The bar chart below shows the same information as in the graph, but perhaps in a more dramatic and immediate way:
But again, there is no connection with pronunciation. In any case, it would be impossible to illustrate the number of words that could create pronunciation problems, because the number would be barely visible as a bar.

9.11 Choose the most appropriate figure to illustrate your point |
89 |
|||
Below is a table that a presenter has cut and pasted from a paper |
|
|||
|
|
|
|
|
|
|
total: all words |
total: different words |
|
|
|
|
|
|
|
10-minute presentation |
1200–1800 |
300–450 |
|
|
20-minute presentation |
2400–3600 |
320–470 |
|
|
40-minute presentation |
4800–7200 |
340–490 |
|
|
|
|
|
|
There are a few problems with cutting and pasting from papers:
•readers of papers have, in theory, all the time they need to absorb detailed information; in a presentation the audience does not have this time frame
•by having so much information (i.e., the ranges of values and the coverage of three different lengths of presentation), the presenter may be tempted to describe everything, without telling the audience where they should focus. Clearly the more you describe, the longer you take, and potentially the more mistakes in English you will make
•the table in the paper may have been used for a slightly different purpose from what is needed for now—in fact this table tells us nothing about pronunciation
Generally, the best solution is to
•have a really clear idea of what it is that you want the audience to learn about (in this case, the number of words they will have to learn to pronounce)
•choose the minimal amount of data that will clearly convey this idea
•choose the most appropriate format for conveying this idea (the graph and bar chart did not really work well for our purposes in this case)
•use the simplest possible form of this format
So a good solution could be the following table:
|
all words |
different words |
words difficult to pronounce |
|
|
|
|
10 minute |
1200 |
300 |
10–20 |
20 minute |
2400 |
320 |
12–22 |
|
|
|
|
This table is quick for the audience to read and absorb. The significance of the very slight rise in the total number of different words is very easy to see. Also, the data on a 40-minute presentation has been removed and just the lower value of the number of words is given.
And it also contains a new column “difficult words to pronounce.” The information given in the second column is interesting, but the key information for someone