

Глава из книги Случаи УЗДиагностики
.pdfOpening Round
1

C A S E 1
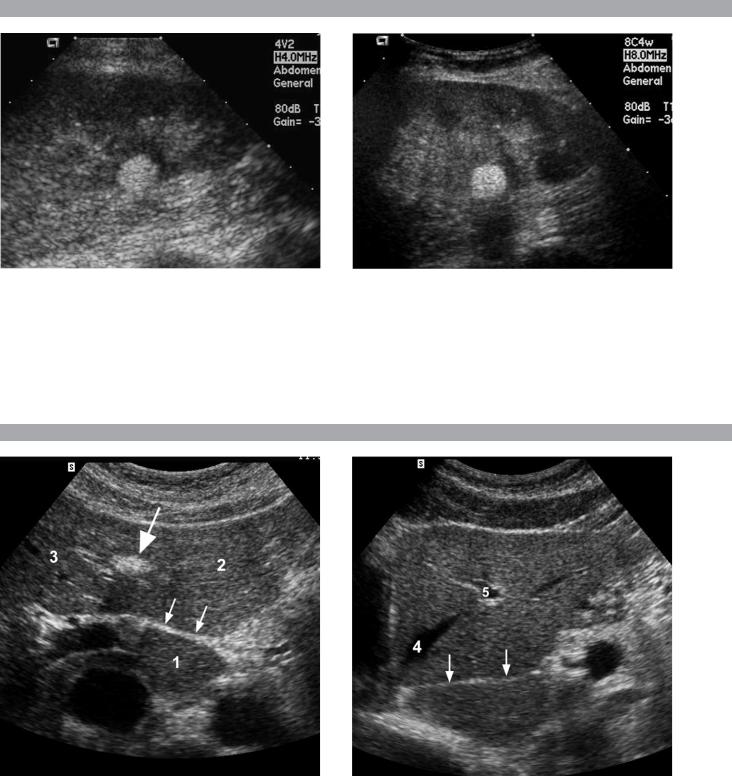
Longitudinal views of the kidneys from the same patient.
1.Do these kidneys appear normal or abnormal?
2.Which is the right kidney and which is the left?
3.What are the arrows pointing to in the kidneys?
4.What is the normal length for an adult kidney?
C A S E 2
Longitudinal and transverse views of the gallbladder.
1.Should the abnormality shown on these images move when the patient rolls?
2.What causes the echogenicity of the bile in this condition?
3.Is surgery indicated?
4.What less common causes are there for this sonographic appearance?
3

A N S W E R S
C A S E 1
Normal Kidneys
1.The kidneys shown in this case are normal.
2.The first image is the right kidney and the second image is the left kidney. The only way to tell the difference is to compare the echogenicity of the adjacent liver and spleen. The normal liver is usually similar or slightly more echogenic than the right kidney. The spleen is considerably more echogenic than the left kidney.
3.The arrows are pointing to the renal pyramids.
4.The normal adult kidney is approximately 11 ± 2 cm.
Reference
Thurston W, Wilson SR: The urinary tract. In Rumack CM, Wilson SR, Charboneau JW (eds): Diagnostic Ultrasound, 3rd ed. St. Louis, Elsevier/Mosby, 2005, pp 322–325.
Cross-Reference
Ultrasound: THE REQUISITES, 2nd ed, pp 103–105.
Comment
Unlike most of the other solid organs in the abdomen, the kidneys have a relatively complex sonographic appearance. The central renal sinus contains a combination of fat and soft tissue and appears echogenic. The renal parenchyma, on the other hand, is hypoechoic. In many patients, including the one shown in this case, it is possible to visualize the renal pyramids as structures even slightly less echogenic than the renal cortex. Normally, the renal parenchyma is the least echogenic solid organ in the upper abdomen, followed by the liver, the spleen, and the pancreas.
When performing scans of the kidneys, it is important to compare their echogenicity to that of the liver and the spleen. This allows for detection of abnormally echogenic kidneys as well as abnormalities in hepatic and splenic echogenicity. Therefore, views including a portion of the liver and spleen, such as those shown in this case, are important to obtain. Given the size of the liver, it is typical to view the right kidney using the liver as a window, so comparison of the right kidney with the liver is generally easy. Since the spleen is much smaller than the liver, comparison of the spleen with the left kidney is more difficult. Nevertheless, a high posterior and lateral approach with the patient supine will work for almost all patients except those with unusually small spleens. It is also helpful to scan both kidneys from a posterior and lateral approach without using the liver or spleen as windows since this will provide a closer approach to the kidneys and in some cases will allow you to identify abnormalities that might otherwise be overlooked.
C A S E 2
Gallbladder Sludge
1.Sludge should move to the dependent portion of the gallbladder when the patient changes position.
2.The echogenicity of sludge is due to crystals, especially cholesterol and calcium bilirubinate.
3.Sludge will usually resolve without any complications, so surgery is usually not indicated.
4.Blood and pus can simulate sludge.
Reference
Pazzi P, Gamberini S, Buldrini P, Gullini S: Biliary
sludge: the sluggish gallbladder. Dig Liver Dis 2003;
35(Suppl. 3):39–45.
Cross-Reference
Ultrasound: THE REQUISITES, 2nd ed, pp 34–35.
Comment
Gallbladder (GB) sludge consists of viscous bile that contains cholesterol crystals and calcium bilirubinate granules. It appears as echogenic material in the lumen of the GB. Since it is not attached to the GB wall, sludge should be mobile. However, if the bile is very thick and viscous, mobility may be very slow. Usually, sludge will layer into the dependent portion of the GB, and a straight line will form between the sludge and the rest of the bile in the GB. In some patients, sludge will completely fill the lumen of the GB. Sludge is usually homogeneous but occasionally will contain areas of heterogeneity. Blood and pus both can simulate sludge but are much less common. Unlike GB stones, sludge does not shadow. If even slight shadowing is detected within sludge, it indicates the presence of associated stones.
The pathogenesis of sludge is believed to be a combination of impaired gallbladder motility and altered nucleation factors. The most common conditions that provoke sludge formation are pregnancy, prolonged fasting, total parenteral nutrition, rapid weight loss, and critical illnesses. Some medications, including ceftriaxone, cyclosporine, and octreotide, are also associated with sludge formation.
The natural history of sludge is variable. Although good long-term studies are limited, it appears that in approximately 50% it is asymptomatic and resolves spontaneously when the precipitating cause is corrected. In 40% it is cyclic and periodically waxes and wanes. In the remainder it progresses to gallstone formation. Sludge can cause symptoms even in the absence of gallstones. It has been associated with biliary colic, acalculous cholecystitis, and pancreatitis.
4
C A S E 3
Two longitudinal views of the lower pole of the same kidney.
1.What important finding is seen on the second image but not on the first?
2.Why doesn’t the first image show this important finding?
3.Does this lesion require further evaluation?
4.What is the major complication of this lesion?
C A S E 4
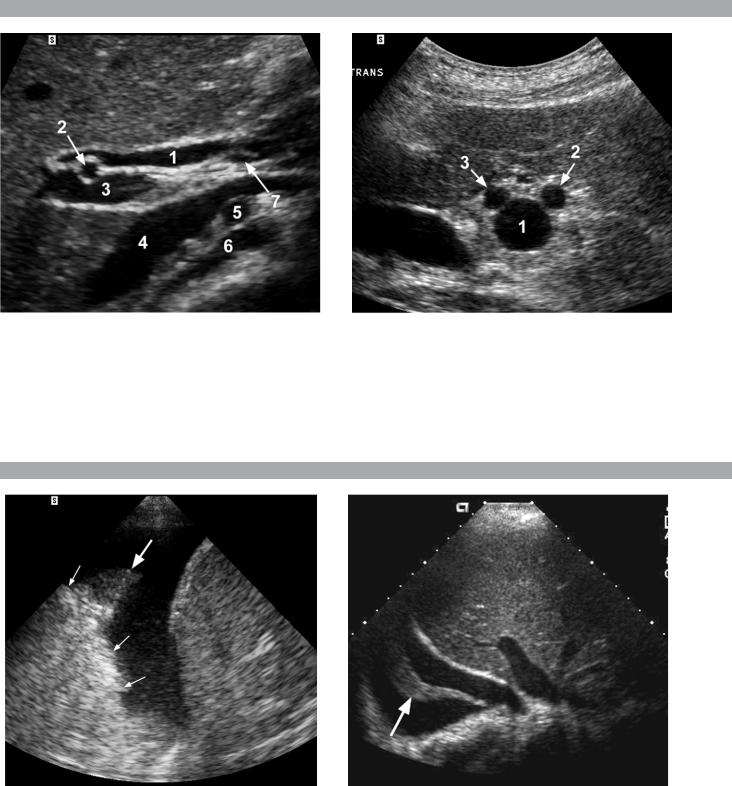
Transverse and longitudinal views of the liver.
1.What structure is the large arrow pointing to in the first image?
2.What structure are the small arrows pointing to in both images?
3.What embryologic remnant travels in the structures indicated by the arrows?
4.What liver segments are indicated by the numbers 1, 2, and 3 in the first image, and what vessels are indicated by the numbers 4 and 5 in the second image?
5

A N S W E R S
C A S E 3
Angiomyolipoma
1.Both images show a hyperechoic mass. The second image shows slight posterior shadowing. These findings are typical of an angiomyolipoma (AML).
2.Because it was taken with a lower frequency transducer (4 versus 8 MHz).
3.This is controversial. Since renal cell carcinoma is occasionally similarly hyperechoic, it is not unreasonable to recommend either a noncontrast CT or MRI to prove that the lesion contains fat or followup sonography to prove stability.
4.The major complication of an AML is bleeding.
Reference
Siegel CL, Middleton WD, Teefey SA, McClennan BL:
Angiomyolipoma and renal cell carcinoma: Ultrasound
differentiation. Radiology 1996;198:789–793.
Cross-Reference
Ultrasound: THE REQUISITES, 2nd ed, pp 127–128.
Comment
AML is a benign renal tumor that contains fat, smooth muscle, and vessels. These occur either sporadically or in association with tuberous sclerosis. Sporadic AMLs typically occur in middle-aged women and are solitary. AMLs in tuberous sclerosis are usually multiple, small, and bilateral and show no gender predilection.
The great majority of AMLs are asymptomatic. Large AMLs (> 4 cm) may cause bleeding into the subcapsular or perinephric space. This bleeding may be related in part to the abnormal vessels and microaneurysms that are present in these tumors. Some urologists advocate removal of these large lesions.
The sonographic appearance of an AML is usually very typical. In approximately 80% of cases, an AML appears as a homogeneous hyperechoic mass similar in echogenicity to renal sinus or perinephric fat. A small percentage of AMLs are less echogenic than fat but more echogenic than renal parenchyma.
Although the usual appearance of an AML is very characteristic, it does overlap with the appearance of renal cell cancer (RCC). Approximately 10% of all RCC appears echogenic enough to simulate an AML. This is most common in small RCC. Some features can help in the differentiation of echogenic RCC and AML. If any cystic elements or a hypoechoic halo or calcification are seen, then the mass is much more likely to be RCC. On the other hand, if there is attenuation of the sound so that there is slight posterior acoustic shadowing (other than shadowing caused by calcification), then the mass is much more likely to be an AML than RCC.
C A S E 4
Normal Anatomy of the Liver
1.Large arrow = ligamentum teres.
2.Small arrows = fissure for ligamentum venosum.
3.Umbilical vein > ligamentum teres.
Ductus venosus > fissure for ligamentum venosum.
4.1 = Caudate segment, 2 = Left lateral segment, 3 = Left medial segment, 4 = Left hepatic vein, 5 = Branch of the left portal vein.
Reference
Wilson SR, Withers CE: The liver. In Rumack CM, Wilson SR, Charboneau JW (eds): Diagnostic Ultrasound, 3rd ed. St. Louis, Elsevier/Mosby, 2005, pp 78–82.
Cross-Reference
Ultrasound: THE REQUISITES, 2nd ed, pp 49–51.
Comment
The ductus venosus is the embryologic vessel that provides communication between the umbilical vein and the inferior vena cava. It runs between the umbilical segment of the left portal vein and the most superior aspect of the inferior vena cava. It is embedded in the liver via a deep fissure that can be seen on both longitudinal and transverse images of the left lobe of the liver. This fissure separates the caudate lobe from the lateral segment of the left lobe. Whenever the fissure for the ligamentum venosum is seen, the portion of the liver seen anteriorly must be the lateral segment of the left lobe. Therefore, in the longitudinal view, the portal vein branch and hepatic vein branch that are seen must be branches of the left portal vein and hepatic vein that supply the lateral segment.
The ligamentum teres is the remnant of the umbilical vein. On transverse views such as those shown in this case, it appears as a round, echogenic structure that often produces some posterior shadowing. It attaches to the most anterior aspect of the left portal vein. In the fetus, blood flow from the umbilical vein travels into the liver, through a short segment of the left portal vein, and then into the ductus venosus. The segment of the left portal vein that connects the umbilical vein to the ductus venosus is called the umbilical segment of the left portal vein. The ligamentum teres and the umbilical segment of the left portal vein both separate the medial and lateral segments of the left lobe.
6
C A S E 5
Longitudinal and transverse views of the porta hepatis.
1.Name the numbered normal structures on the longitudinal view.
2.Name the numbered normal structures on the transverse view.
3.Are measurements of the common duct obtained from the inner wall or the outer wall?
4.What segment of the bile duct is usually the largest?
C A S E 6
Longitudinal view of the right posterior hemithorax and transverse view of the right upper quadrant obtained in different patients.
1.What is the diagnosis in these two patients?
2.To what is the large arrow pointing?
3.To what are the small arrows pointing?
4.When the abdomen is scanned, is this abnormality easier to detect on the right side or on the left side?
7

A N S W E R S
C A S E 5
Normal Anatomy of the Common Bile Duct
1.1 = Common hepatic duct, 2 = Right hepatic artery, 3 = Portal vein, 4 = Inferior vena cava, 5 = Right renal artery, 6 = Crus of the right diaphragm,
7 = Cystic duct insertion.
2.1 = Portal vein, 2 = Proper hepatic artery, 3 = Common hepatic duct.
3.Bile duct diameter is measured from inner wall to inner wall. This is done to allow for better correlation with measurements taken during cholangiography.
4.The bile duct diameter is usually greatest in its mid segment (i.e., between the porta hepatis and the pancreatic head).
Reference
Middleton WD: The bile ducts. In Goldberg BB (ed): Diagnostic Ultrasound. Baltimore, Williams & Wilkins, 1993, pp 146–172.
Cross-Reference
Ultrasound: THE REQUISITES, 2nd ed, pp 87–90.
Comment
The left and right hepatic ducts join each other to form the common hepatic duct. The common hepatic duct joins the cystic duct to form the common bile duct. Although it is visualized in this case, the insertion of the cystic duct is usually difficult to visualize. Therefore, it is usually not possible to precisely determine where the junction of the common hepatic duct and the common bile duct is located. For this reason, many ultrasonologists refer to the common hepatic duct and the common bile duct together as the “common duct.”
In most views of the porta hepatis, it is easy to identify the portal vein and to identify tubular structures anterior to the portal vein that represent the hepatic artery and the common duct. The common hepatic artery arises from the celiac axis. Following the takeoff of the gastroduodenal artery, it ascends into the porta hepatis as the proper hepatic artery. Therefore, the proper hepatic artery is usually what is visualized in the porta hepatis.
As shown in the transverse view, the proper hepatic artery is usually more to the left and the common duct to the right. This is easy to remember since the artery arises from the aorta (a left-sided structure) and the bile duct arises from the liver (a right-sided structure). After the proper hepatic artery bifurcates into the right and left hepatic arteries, the right hepatic artery crosses between the portal vein and the common duct. This produces the classic view showing the bile duct in long axis, the right hepatic artery in short axis, and the portal vein in an oblique axis, as shown in the longitudinal image.
C A S E 6
Pleural Effusion
1.Both patients have pleural effusions.
2.The large arrow is pointing to atelectatic lung floating in the pleural fluid.
3.The small arrows are pointing to aerated lung and the associated posterior shadow.
4.Pleural effusions are easier to see on the right side because the liver provides a better window to the costophrenic angle than does the spleen.
Reference
Brant WE: The thorax. In Rumack CM, Wilson SR, Charboneau JW (eds): Diagnostic Ultrasound, 3rd ed. St. Louis, Elsevier/Mosby, 2005, pp 603–609.
Cross-Reference
Ultrasound: THE REQUISITES, 2nd ed, pp 269–271.
Comment
Pleural effusions are frequently seen as incidental findings on abdominal scans. Normally, the aerated lung is closely applied to the diaphragm so that sound cannot penetrate to the posterior structures of the chest. Pleural effusions displace aerated lung enough to provide a window to the posterior surface of the costophrenic sulcus. When the effusion is small, this produces a triangular-shaped collection. When the effusion is larger, there is usually associated compressive atelectasis of the lung, producing a mobile, curvilinear soft tissue structure floating within the fluid. Aerated lung, appearing as hyperechoic tissue with dirty posterior shadowing, is often seen above the atelectatic lung. On longitudinal views, pleural effusions are distinguished from perihepatic ascites by noting the triangular costophrenic sulcus. On transverse views, the bare area of the liver prohibits ascites from extending to the posterior medial aspect of the liver. Pleural effusions typically do extend to the most medial aspect of the liver, near the vena cava.
As shown on the first image, pleural effusions can also be seen by scanning directly over the chest wall in the region of the effusion. This scanning is commonly done when performing ultrasound-guided thoracentesis. The fluid is seen separating the parietal and visceral layers of the pleura. In the longitudinal plane, the ribs are seen as shadowing echogenic structures and the parietal pleura as a smooth, linear reflection deep to the ribs. Pleural effusions that appear simple on sonography may be either transudative or exudative. Complex effusions that contain septations and/or internal floating reflectors are usually exudative.
8
C A S E 7
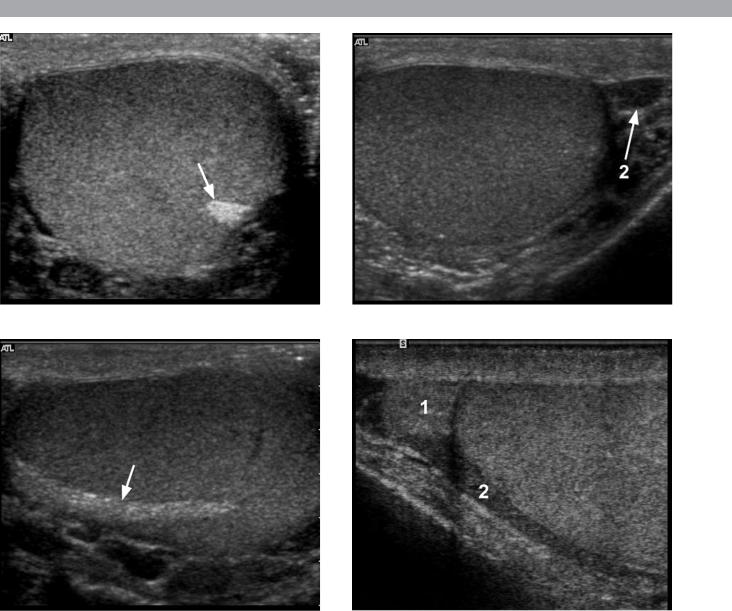
Two transverse and two longitudinal views of the scrotum.
1.What is the normal echogenic structure (arrow) shown on the first transverse view and the first longitudinal view?
2.What are the normal peritesticular structures labeled 1 and 2 on the second transverse view and the second longitudinal view?
3.What is the normal relative echogenicity of the testis and of the head of the epididymis?
4.What is the normal relative echogenicity of the testis and of the body of the epididymis?
9

A N S W E R S
C A S E 7
Normal Scrotal Anatomy
1.The peripheral echogenic structure is the mediastinum of the testis.
2.1 = Head of the epididymis, 2 = Body of the epididymis.
3.The head of the epididymis is normally isoechoic to the testis.
4.The body of the epididymis is normally hypoechoic to the testis.
Reference
Feld R, Middleton WD: Recent advances in sonography of the testis and scrotum. Radiol Clin North Am 1992; 30:1033–1051.
Cross-Reference
Ultrasound: THE REQUISITES, 2nd ed, pp 152–153.
Comment
The testes are paired ovoid organs residing within the two halves of the scrotum. Six scrotal layers (the skin, dartos, external spermatic fascia, cremasteric muscle, internal spermatic fascia, and the tunica vaginalis) surround them and the testicular capsule called the tunica albuginea. The two scrotal sacs are divided by a midline median raphe.
Each testis is divided into approximately 300 lobules. Each lobule contains up to four extremely convoluted seminiferous tubules. As they converge to exit the testis, the seminiferous tubules join together to form the straight tubules. The straight tubules then join to form a plexus of channels called the rete testis that is located within an infolding of the tunica albuginea called the mediastinum. The mediastinum is the hilum of the testis. The rete testes empty into the head of the epididymis via 10 to 15 efferent ductules. In the head of the epididymis, the efferent ductules join together to form a single convoluted ductus epididymis. The epididymis is a crescent-shaped structure that rests on the surface of the testis near the mediastinum. It is divided into the head superiorly, the tail inferiorly, and the body in between.
The normal testis has a lowto medium-level echogenicity and a homogeneous echotexture. It measures approximately 4 cm in length and 2 cm in width and thickness. The mediastinum is an elongated, echogenic structure at the periphery of the testis that runs from the upper third to the lower third of the testis. In some testes it is very prominent, and in others it is not visible at all. The epididymal head rests on the upper pole of the testis and has an echogenicity similar to that of the testis. Often, a faint posterior refractive shadow arises from the interface between the testis and the epididymal head.
This is present on the second longitudinal image. During real-time scanning, the epididymal head can usually be followed into the body of the epididymis, which is slightly less echogenic than the testis. The location of the epididymal body is variable because the testis is somewhat mobile within the scrotal sac. Most often, the epididymal body is seen along the anterior and lateral aspect of the testis, as shown on the second transverse image. In some patients, the epididymal body is located posterior to the testis, as shown on the second longitudinal image.
The tail of the epididymis connects to the vas deferens. The inferior aspect of the vas deferens is very tortuous and can be visualized in some individuals. As the vas ascends in the spermatic cord, it straightens and becomes easier to identify. It is typically a thick-walled structure (total diameter approximately 2 mm) with a tiny lumen. Unlike the other structures in the spermatic cord, the vas is avascular and does not compress.
A small amount of fluid is often seen in the scrotal sac, usually around the epididymal head. Occasionally, the appendix of the testis and/or epididymis can be seen when they are surrounded by fluid. They typically appear as tiny ovoid structures attached to the testis or epididymis.
10
C A S E 8
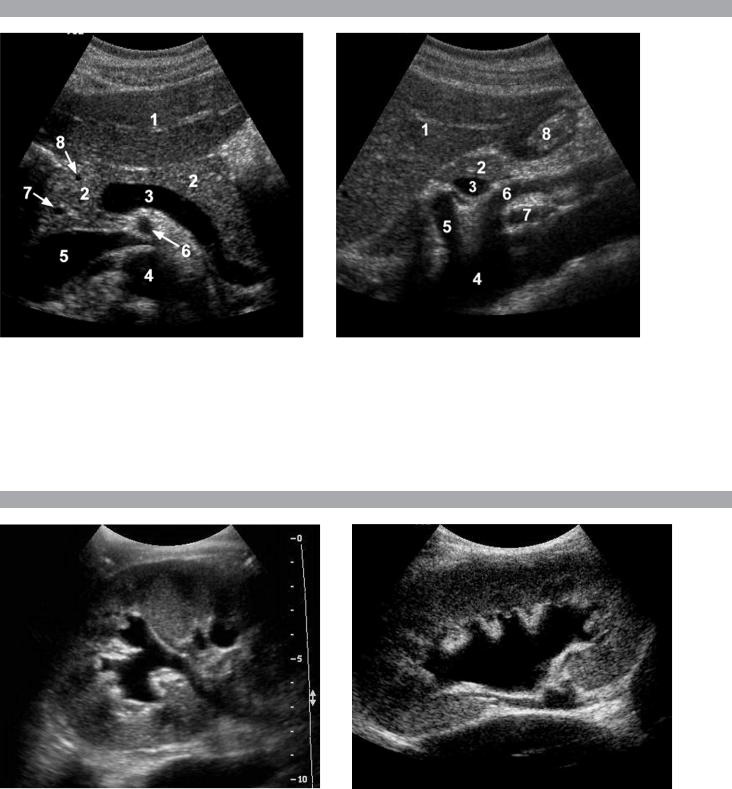
Transverse and sagittal views of the upper abdomen.
1.Name the normal numbered structures on the transverse scan.
2.Name the normal numbered structures on the sagittal scan.
3.Is the pancreatic body normally round or oval-shaped on sagittal scans?
4.Is the superior mesenteric artery or the superior mesenteric vein closer to the pancreas?
C A S E 9
Longitudinal views of different patients with the same abnormality.
1.What is wrong with these kidneys?
2.In what circumstances is this condition a medical emergency?
3.How would you grade the abnormality shown here?
4.In what plane are these images acquired?
11