

Глава из книги Случаи УЗДиагностики
.pdfA N S W E R S
C A S E 4 7
Pancreatic Pseudocysts
1.In patients with cystic lesions of the pancreas, it is important to know whether they have a history of pancreatitis.
2.Cystic areas are rare in adenocarcinoma of the pancreas.
3.Women have a higher risk of cystic pancreatic neoplasms.
4.The large majority of pseudocysts are due to alcoholic pancreatitis.
Reference
Ros PR, Hamrick-Turner JE, Chiechi MV, et al: Cystic masses of the pancreas. Radiographics 1992;12: 672–686.
Cross-Reference
Ultrasound: THE REQUISITES, 2nd ed, pp 196–197.
Comment
Pancreatitis has a number of potential complications. The list of local complications potentially seen on sonography includes fluid collections, pseudocysts, abscesses, necrosis, pseudoaneurysms, venous thrombosis, and biliary obstruction. Fluid collections within or around the pancreas occur in 40% to 50% of patients with pancreatitis. The majority of fluid collections resolve spontaneously. If the collection organizes and forms a fibrous capsule, it is referred to as a pseudocyst. It takes approximately 6 weeks for a fluid collection to mature into a well-encapsulated pseudocyst. Approximately 2% to 10% of patients with acute pancreatitis ultimately develop a pseudocyst.
Pseudocysts can occur almost anywhere, but they are most commonly seen within or immediately adjacent to the pancreas. They appear as well-defined masses that are usually anechoic or hypoechoic. Pseudocysts may contain internal debris, hemorrhage, or septations. In such cases, the differential diagnosis often includes a cystic neoplasm such as a mucinous macrocystic neoplasm. The key to the correct diagnosis is the history of prior episodes of pancreatitis. Follow-up examinations are also useful since the intraluminal echoes in a complex pseudocyst will usually clear over time. In some cases, aspiration is necessary to make the distinction, with increased levels of amylase expected in a pseudocyst and increased levels of carcinoembryonic antigen in mucinous cystic neoplasms. Endoscopic retrograde cholangiopancreatography can also be valuable because it may demonstrate changes of pancreatitis that are not evident sonographically. It may also demonstrate communication between pseudocysts and the pancreatic duct in up to 70% of cases.
C A S E 4 8
Variant Relationship of Right Hepatic Artery
and Bile Duct
1.In both cases, the bile duct is located between the portal vein and the right hepatic artery. Normally, the right hepatic artery is located between the portal vein and the bile duct.
2.This variant occurs in up to 20% of patients.
3.The bile duct is straighter than the artery.
4.The bile duct is more variable in diameter than the artery.
Reference
Middleton WD: The bile ducts. In Goldberg BB (ed): Diagnostic Ultrasound. Baltimore, Williams & Wilkins, 1993, pp 146–172.
Cross-Reference
Ultrasound: THE REQUISITES, 2nd ed, pp 87–89.
Comment
Anatomic variations around the porta hepatis are relatively common. The variant shown in these images, in which the right hepatic artery crosses anterior to the duct, is reported to occur in up to 20% of individuals. However, it is not commonly documented on sonography. Since the hepatic artery may cross in front of the bile duct, or the bile duct may pass in front of the hepatic artery, identification of the bile duct can sometimes be confusing. One clue that is helpful is that the bile duct is usually straighter than the hepatic artery. Therefore, it is easier to get a view of the bile duct that shows it over several centimeters, whereas the hepatic artery is too tortuous to see over a significant length. In addition, the hepatic artery maintains a fairly constant diameter, whereas the bile duct varies in diameter from proximal to distal. In many patients, the hepatic artery will indent the bile duct, but the bile duct never indents the artery.
In addition to the right hepatic artery, occasionally the cystic artery (the artery that supplies the gallbladder) can be seen near the common bile duct. This artery usually arises from the right hepatic artery to the right of the common duct. When it arises to the left of the common duct, it must cross the common duct on its way to the gallbladder. In some patients it passes in front and in others it passes behind the common duct. Therefore, it is possible to see two arteries behind the duct, an artery in front of and behind the duct, and two arteries in front of the duct.
52
C A S E 4 9
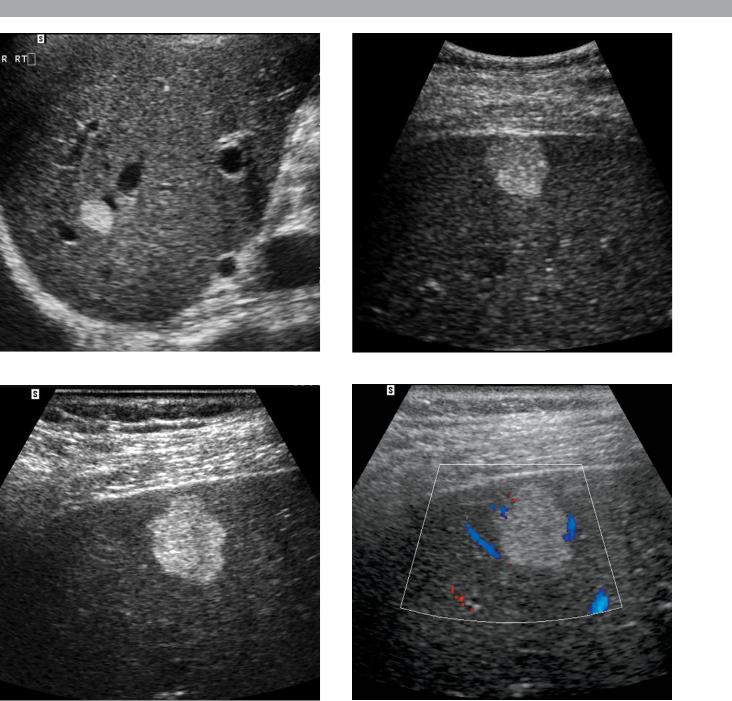
Magnified views of the liver in three patients. The bottom images are corresponding gray-scale and color Doppler views from the same patient.
1.What is the differential diagnosis in these three patients with the same abnormality?
2.What factors determine the management of these patients?
3.Would the presence of increased through transmission affect your approach to this lesion?
4.Does the absence of detectable internal flow in the last image affect your differential?
53

A N S W E R S
C A S E 4 9
Hepatic Hemangioma
1.All images show a hyperechoic, homogeneous mass. Hemangioma is the most likely diagnosis. Metastasis, hepatocellular cancer, and nodular focal fat are other considerations. Focal nodular hyperplasia and hepatic adenoma are much less likely possibilities.
2.Management depends on the patient’s risk factors for hepatic malignancy.
3.Hemangiomas occasionally have increased through transmission, but this can be seen with other solid lesions as well, so it should not affect your differential diagnosis significantly.
4.Usually hemangiomas have no detectable flow. Although some of the other lesions mentioned previously (hepatocellular cancer, hypervascular metastasis, focal nodular hyperplasia, and hepatic adenoma) might have detectable flow and may be hypervascular, in some cases it is not possible to detect flow in these other lesions also. Therefore, lack of detectable flow may make the diagnosis of hemangioma more likely, but it does not exclude the other possibilities.
Reference
Leifer DM, Middleton WD, Teefey SA, et al: Follow-up of patients at low risk for hepatic malignancy with a characteristic hemangioma at US. Radiology 2000;214: 167–172.
Cross-Reference
Ultrasound: THE REQUISITES, 2nd ed, pp 53–57.
Comment
Hemangiomas are the most common solid, benign liver lesion, occurring in approximately 7% of adults. They are composed of multiple, small, blood-filled spaces that are separated by fibrous septations and lined by endothelial cells. They are most common in women. Approximately 10% are multiple. With the exception of cysts, they are the most common incidental lesion detected on hepatic sonography.
It is unusual for hemangiomas to cause symptoms. Giant hemangiomas may cause enough mass effect to be symptomatic, and rarely a hemangioma will bleed enough to cause symptoms. Platelet sequestration and destruction by hemangiomas has been reported as an extremely rare cause of thrombocytopenia (called Kasabach–Merritt syndrome).
The classic sonographic appearance, seen in approximately 60% to 70% of hemangiomas, is a well-marginated, homogeneous, hyperechoic mass. Hemangiomas are
usually round (as shown on the first two images), but they may have scalloped margins (as shown on the second two images). The majority are less than 3 cm in size. Atypical appearances tend to occur in larger lesions due to fibrosis, thrombosis, and necrosis. A significant percentage of atypical hemangiomas have a hyperechoic periphery and a hypoechoic center. This “atypical” appearance is actually fairly characteristic of hemangioma and is seen only rarely in malignant disease. Another finding occasionally seen in hemangioma is increased through transmission. A common misconception is that through transmission is an important characteristic necessary to make a confident diagnosis of hemangioma. This is certainly not true, since the majority of hemangiomas do not have through transmission, and many other tumors can have through transmission.
As expected for benign lesions, hemangiomas are usually stable over time. However, they will occasionally change in appearance over time. Typically, they will convert from hyperechoic to hypoechoic. Rarely, they will change echogenicity over a matter of minutes or even seconds. No other hepatic mass has been observed to have this behavior.
The proper management of a homogeneous, hyperechoic hepatic mass depends on the patient’s clinical history. In patients at increased risk for hepatic malignancy (prior history or current evidence of an extrahepatic malignancy or chronic liver disease), the presumed sonographic diagnosis of hemangioma should be confirmed. MRI is the preferred method for confirming the diagnosis of hemangioma. For patients who are not at increased risk for hepatic malignancy, recommendations for the management of suspected hemangiomas are divergent. Some authorities have recommended no further evaluation. Others have recommended periodic sonographic follow-up. Still others have recommended confirmation with further tests such as MRI. We analyzed this group of patients at our institution and found that the risk of malignancy in this group of patients is extremely low. Out of more than 200 patients, only 1 was subsequently found to have a malignant hepatic lesion. Therefore, we recommend no further evaluation of typical-appearing hemangiomas provided the patient has no prior history or current evidence of extrahepatic malignancy or chronic liver disease.
Occasionally, noninvasive tests do not establish the diagnosis of hemangioma, and it is necessary for the patient to have a biopsy. Biopsy can be performed safely; however, the needle should pass through normal liver parenchyma before entering the hemangioma in order to achieve some tamponade effect. Fine needle aspirations generally obtain only blood and are not sufficient to make the diagnosis. Core biopsy needles can obtain sufficient tissue for diagnosis in the majority of cases.
54
C A S E 5 0
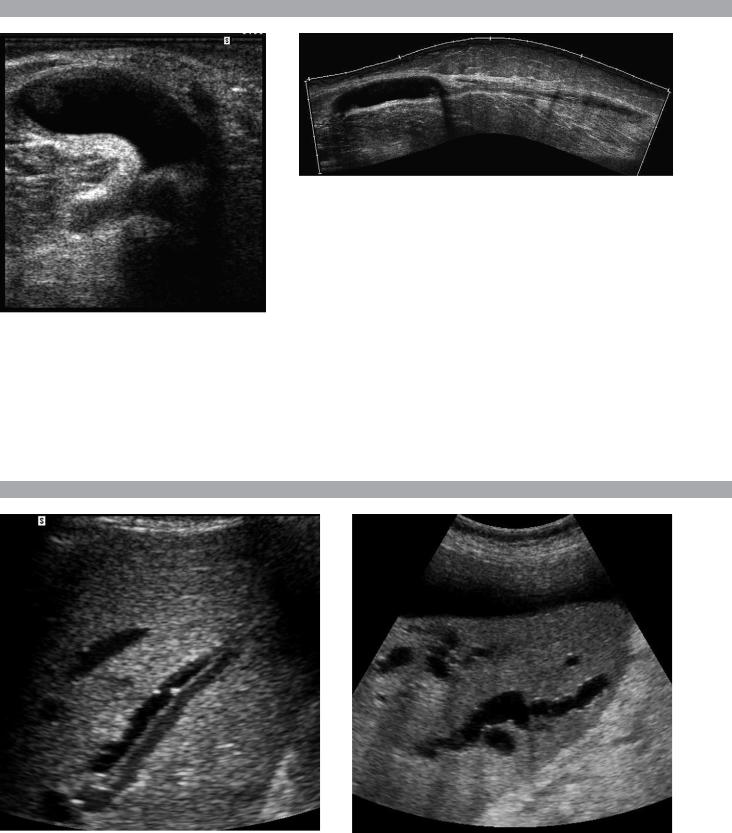
Transverse view of the posterior knee and extended-field-of-view scan of the posterior knee and calf.
1.Describe the abnormal findings.
2.Where does this condition occur?
3.How can this lesion be distinguished from other knee cysts?
4.Does this abnormality typically communicate with the joint space?
C A S E 5 1
Views of the liver in different patients.
1.Is either of the images shown in this case abnormal?
2.Do the intrahepatic ducts run anterior or posterior to the portal veins?
3.On gray-scale imaging, what can closely simulate the abnormality shown in the first image?
4.Should a 3-mm intrahepatic duct be considered dilated?
55

A N S W E R S
C A S E 5 0
Ruptured Baker’s Cyst
1.The transverse view shows a cystic lesion with a curved beak-like extension heading toward the deep tissues. The longitudinal view shows the cystic lesion in the knee and a more complex-appearing fluid collection extending into the calf. These features are typical of a Baker’s cyst that has ruptured.
2.Baker’s cysts occur in the medial aspect of the posterior knee. The cyst arises from fluid accumulation in the bursa between the medial head of the gastrocnemius and the semimembranosus tendon.
3.The location in the medial posterior knee and the beaked extension that wraps around the medial aspect of the medial head of the gastrocnemius muscle are the best confirmation that a knee cyst is a Baker’s cyst.
4.Baker’s cysts typically communicate with the joint.
Reference
Ptasznik R: Ultrasound in acute and chronic knee injury.
Radiol Clin North Am 1999;37:797–830.
Cross-Reference
Ultrasound: THE REQUISITES, 2nd ed, pp 286–287.
Comment
One of the earliest applications of musculoskeletal ultrasound was in the evaluation of patients with posterior knee pain and swelling due to a suspected Baker’s cyst. Even prior to the advent of high-resolution linear array transducers, ultrasound was shown to be effective in identifying Baker’s cysts and in distinguishing them from other posterior knee masses such as popliteal artery aneurysms.
Baker’s cysts contain fluid distending the bursa between the medial head of the gastrocnemius and the semimembranosus tendon. They usually occur as a result of abnormalities that increase intraarticular fluid. They can also occur as a result of inflammatory conditions that affect the synovium of the joint and communicating bursae.
Baker’s cysts may be filled with anechoic fluid and have thin, imperceptible walls. However, it is not uncommon to see internal septations; thick, irregular walls; nodular synovial proliferation; and loose bodies. The diagnostic feature that is most characteristic is the neck that extends between the medial gastrocnemius and the semimembranosus tendon. This usually appears as a beak when the knee is extended or as a channel when the knee is slightly flexed. Rupture of a Baker’s cyst should be suspected whenever the inferior aspect of the cyst converts from a round to a pointed appearance, or when there is detectable fluid tracking from the inferior aspect of the cyst.
C A S E 5 1
Intrahepatic Biliary Ductal Dilatation
1.Both images show dilated intrahepatic bile ducts. The first image shows the dilated bile duct running adjacent to the portal vein. The second image shows tortuous, dilated ducts with associated posterior enhancement.
2.The relationship of intrahepatic bile ducts and portal veins is variable.
3.Enlarged hepatic arteries can simulate dilated bile ducts on gray-scale imaging. This is particularly common in patients with cirrhosis.
4.The upper limit of normal for peripheral intrahepatic ducts is 2 mm.
Reference
Bressler EL, Rubin JM, McCracken S: Sonographic parallel channel sign: A reappraisal. Radiology 1987;164: 343–346.
Cross-Reference
Ultrasound: THE REQUISITES, 2nd ed, pp 90–92.
Comment
The intrahepatic bile ducts travel in the portal triads adjacent to the portal veins and hepatic arteries. Although the extrahepatic ducts are located anterior to the portal vein and hepatic artery, the relationship of the intrahepatic ducts and the vessels is quite variable. In normal circumstances, the portal vein is the largest vessel in the portal triads. A tubular structure adjacent to the portal vein may be either the hepatic artery or the bile duct. In the central aspect of the liver, it is usually possible to trace the arteries back to the proper hepatic artery and the bile ducts back to the common hepatic duct. When this is not possible, or when the peripheral aspect of the liver is being imaged, color Doppler can be used to distinguish the intrahepatic bile ducts from the intrahepatic arteries.
In the past, any time an intrahepatic duct was seen as a tubular structure running parallel to the portal vein, it was considered abnormal. This was called the parallel channel sign. However, the normal intrahepatic ducts can now be seen relatively commonly with ultrasound. Therefore, current criteria used to diagnose intrahepatic dilatation are a duct that exceeds 40% of the diameter of the adjacent portal vein or a peripheral duct that is more than 2 mm in diameter. With marked intrahepatic ductal dilatation, the ducts become tortuous, assume a stellate configuration centrally, and are associated with increased through transmission.
56
C A S E 5 2
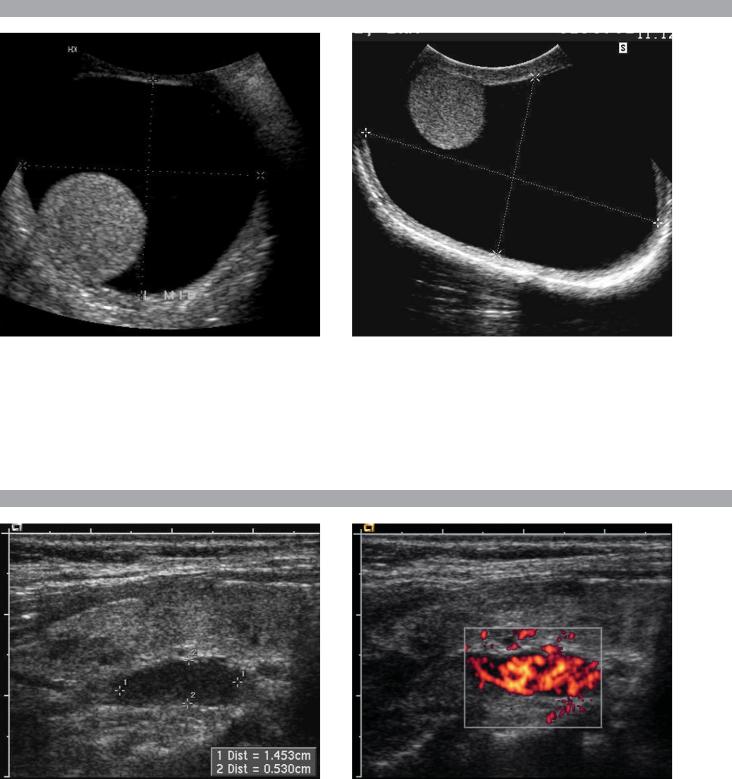
Transverse views of the scrotum in different patients with the same abnormality.
1.In this condition, is the location of the testis more typically anterior or posterior?
2.What is the likely cause of this condition?
3.What would you expect to see at increased gain settings?
4.In what anatomic space is this abnormality located?
C A S E 5 3
Longitudinal gray-scale and power Doppler views of the neck at the level of the right thyroid gland in a patient with renal stone disease.
1.Describe the abnormality.
2.What other test is useful in evaluating this condition?
3.Are these lesions usually hypervascular?
4.Are these lesions usually benign or malignant?
57

A N S W E R S
C A S E 5 2
Hydrocele
1.The testis is usually attached to the posterior aspect of the scrotal wall (first image). However, this is variable (second image).
2.Hydroceles of this size are usually idiopathic.
3.Crystals often develop in chronic hydroceles and can be seen as low-level reflectors floating in the fluid when the gain is increased.
4.The scrotal sac formed by the tunica vaginalis.
Reference
Feld R, Middleton WD: Recent advances in sonography of the testis and scrotum. Radiol Clin North Am 1992; 30:1033–1051.
Cross-Reference
Ultrasound: THE REQUISITES, 2nd ed, pp 153–155.
Comment
A hydrocele is a collection of increased fluid in the sac formed by the tunica vaginalis. A small amount of fluid around the testis is normal and is commonly seen on sonography. Collections that exceed approximately 1 cm in maximum dimension are less common. Hydroceles surround the testis over approximately 75% of their circumference on transverse views and over approximately 50% on longitudinal views. The remainder of the testis is adherent to the wall of the scrotum so that hydrocele fluid cannot flow around the entire testis. Although variable, hydroceles typically collect in the anterior aspect of the scrotum and displace the testis posteriorly. An unusual form of a hydrocele occurs when there is a fluid collection in a focally unobliterated portion of the processus vaginalis within the spermatic cord. This appears as a supratesticular cystic mass and is called a funiculocele or a hydrocele of the spermatic cord.
Causes of hydrocele include infections, torsion of the testis or one of its appendages, trauma, and testicular tumors. These conditions typically cause relatively small hydroceles. Large, simple-appearing hydroceles such as the ones shown in these patients are usually idiopathic.
In patients with large hydroceles, it is usually difficult to palpate the testis on physical examination. Therefore, one of the important roles of sonography is to image the testis and exclude testicular pathology. When the testis is displaced posteriorly, it can be difficult to get a good image of the testis from the typical anterior approach. Instead, a posterior approach brings the probe closer to the testis, allowing for a more detailed view.
C A S E 5 3
Parathyroid Adenoma
1.An oval-shaped, hypoechoic, hypervascular mass is located posterior to the thyroid.
2.Sestamibi scans.
3.Parathyroid adenomas are usually hypervascular.
4.The vast majority are benign.
Reference
Shawker TH, Avila NA, Premkumar A, et al: Ultrasound evaluation of primary hyperparathyroidism. Ultrasound Q 2000;16:73–87.
Cross-Reference
Ultrasound: THE REQUISITES, 2nd ed, pp 254–257.
Comment
The most common cause of primary hyperparathyroidism is a solitary parathyroid adenoma. Approximately 15% of cases are caused by multiple enlarged glands (usually parathyroid hyperplasia and, less commonly, multiple adenomas). Parathyroid cancer is rare and causes less than 1% of cases of hyperparathyroidism. Primary hyperparathyroidism is more common in women.
Parathyroid adenomas are typically solid but very hypoechoic lesions. They are usually oval shaped, with the long axis in the craniocaudal direction. On color Doppler imaging, many adenomas are hypervascular. Vascularity may be difficult to detect in deep lesions and small lesions. The typical location for parathyroid adenomas arising from the superior gland is behind the mid aspect of the thyroid. Adenomas arising from the inferior glands are typically located close to the inferior aspect of the thyroid or a few centimeters below the thyroid.
Sensitivity of ultrasound for detecting parathyroid adenomas is approximately 80%, although both higher and lower values have been reported. False-negative examinations generally arise as a result of a small adenoma, an adenoma in an ectopic location, or in a patient with a large, multinodular thyroid gland. Falsepositive results are less of a problem but do occur. Lymph nodes can be misinterpreted as parathyroid adenomas. A useful clue is that parathyroid adenomas are almost always located medial to the carotid arteries. Lymph nodes can be located in a variety of locations but are usually located lateral to the carotids. Posteriorly located thyroid nodules can also simulate parathyroid adenomas. Usually, there is a bright line that separates a parathyroid adenoma from the thyroid, whereas there is no such line between thyroid tissue and thyroid nodules.
58
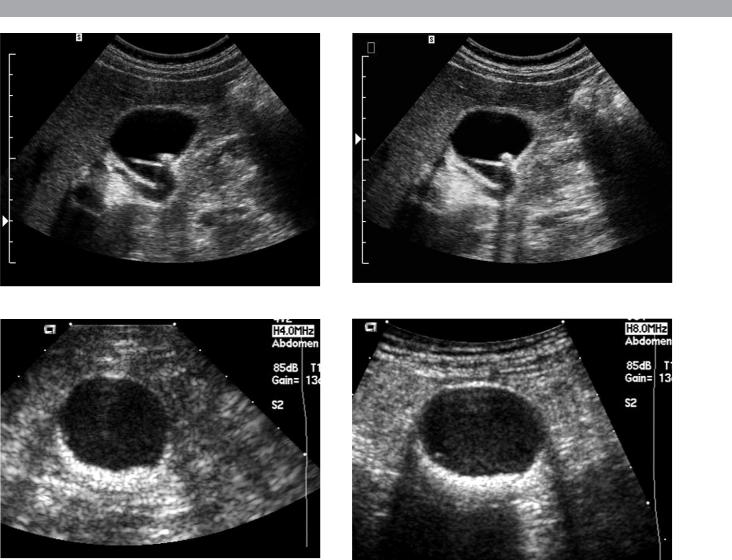
C A S E 5 4
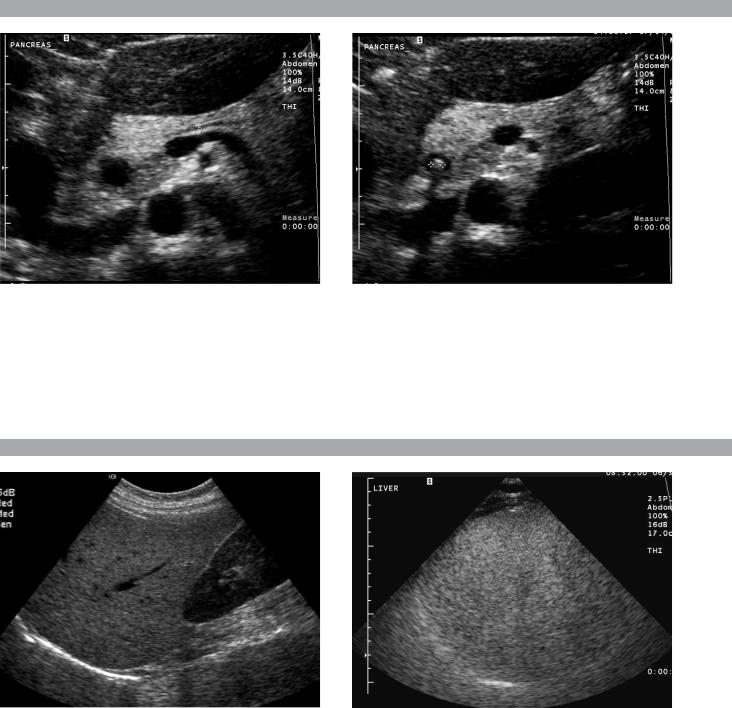
Magnified transverse views of the pancreatic head.
1.What are the two important findings on these scans?
2.Where is this abnormality usually located?
3.How good is ultrasound in visualizing this abnormality?
4.What is the treatment of this abnormality?
C A S E 5 5
Longitudinal views of the right upper quadrant in different patients.
1.List the echogenicity of liver, kidney, spleen, and pancreas from most to least echogenic.
2.What is the most common cause of the abnormality shown in these images?
3.In the first image, is the liver or the kidney more likely to be abnormal?
4.Why is the diaphragm so poorly seen in the second image?
59

A N S W E R S
C A S E 5 4
Choledocholithiasis
1.The most important findings are a dilated bile duct, best seen on the first image, and a shadowing echogenic structure in the lumen of the duct on the second image.
2.Common bile duct stones are usually located in the distal, intrapancreatic portion of the duct.
3.In the best series, ultrasound has a sensitivity of 75% in identifying common duct stones.
4.Common duct stones are treated with endoscopic retrograde cholangiopancreatography, balloon retrieval, and sphincterotomy.
Reference
Middleton WD: The bile ducts. In Goldberg BB (ed): Diagnostic Ultrasound. Baltimore, Williams & Wilkins, 1993, pp 146–172.
Cross-Reference
Ultrasound: THE REQUISITES, 2nd ed, pp 92–95.
Comment
Choledocholithiasis is the most common cause of biliary obstruction. Approximately 85% of cases arise from gallstones that pass through the cystic duct and into the common bile duct. In fact, approximately 15% of patients with cholecystitis have choledocholithiasis. Pigmented stones can form de novo in the bile duct. Usually, this is due to bile stasis or superimposed biliary infection. The majority of common duct stones are located in the distal, intrapancreatic portion of the duct. Only 10% are seen in the proximal portion of the common duct.
Ultrasound is frequently the initial imaging test used in patients with common duct stones. The primary finding that is usually observed is a dilated duct. This is typically the case in patients with jaundice due to choledocholithiasis. Unfortunately, a minority of patients with choledocholithiasis have an unobstructed or an intermittently obstructed duct so that ductal diameter is normal. This is often the case in patients with cholecystitis or biliary colic who have also passed a stone into the bile duct. Therefore, the sensitivity of using dilated ducts to predict choledocholithiasis varies with the patient population being scanned.
Visualization of common duct stones is much more difficult than visualization of stones in the gallbladder. When ductal stones are seen, they appear as echogenic structures in the bile duct lumen. Although acoustic shadowing is usually present, it is seen less commonly than with stones in the gallbladder.
In the best of hands, the sensitivity of sonography in visualizing common duct stones is 70% to 80%. In many reported series, however, the sensitivity is less than 50%.
The primary reason for this low sensitivity is that most common duct stones are located in the most distal aspect of the duct, and this segment is often not completely seen on sonograms. Using the gallbladder as a window, scanning through a fluid-filled stomach, and scanning the patient in an upright position are all techniques that can help to improve visualization of the distal duct.
C A S E 5 5
Fatty Infiltration of the Liver
1.Pancreas → spleen → liver → kidney.
2.Fatty infiltration is by far the most common cause of hepatic hyperechogenicity.
3.Because fatty infiltration of the liver is so common, when there is a large discrepancy in the echogenicity of the liver and the kidney, it is much more likely that the liver is too echogenic than that the kidney is too echolucent.
4.Sound attenuation by the fatty liver limits visualization of the deeper structures, including the diaphragm.
References
Mergo PJ, Ros PR, Buetow PC, Buck JL: Diffuse disease of the liver: Radiologic–pathologic correlation. Radiographics 1994;14:1291–1307.
Zweibel WJ: Sonographic diagnosis of diffuse liver disease. Semin US CT MRI 1995;16:8–16.
Cross-Reference
Ultrasound: THE REQUISITES, 2nd ed, pp 68–70.
Comment
Normally, the liver and the right kidney are very similar in echogenicity or the liver is just slightly more echogenic than the kidney. In this case, the difference in echogenicity between the liver and the kidney is abnormal. In the majority of cases, this is due to fatty infiltration. A large number of processes can cause fatty infiltration of the liver, but the most common cause is obesity. Other common causes include alcohol abuse, total parenteral nutrition, diabetes, malnutrition, steroid use, hepatic toxins, nonalcoholic steatohepatitis, and chemotherapy.
In addition to increased echogenicity, the fatinfiltrated liver appears to have a finer and more compact parenchymal echo pattern than normal liver. More severe fatty infiltration also causes sound attenuation so that the deeper aspects of the liver are difficult to penetrate. This may manifest as decreased echogenicity of the deep liver, poor definition of the diaphragm, or poor visualization of the hepatic vessels. These latter findings are seen in the second image.
60
C A S E 5 6
Paired longitudinal views of the gallbladder in one patient (above) and paired transverse views of the gallbladder in another patient (below).
1.In each patient, which image is more diagnostic for gallstones?
2.What technical parameter causes the difference in the images of the first patient?
3.What technical parameter causes the difference in the images of the second patient?
4.Is there a significant difference between the sonographic appearance of calcified and noncalcified gallstones?
61