

Глава из книги Случаи УЗДиагностики
.pdfA N S W E R S
C A S E 5 6
Technical Parameters Important in
Producing Shadowing from Small
Gallstones
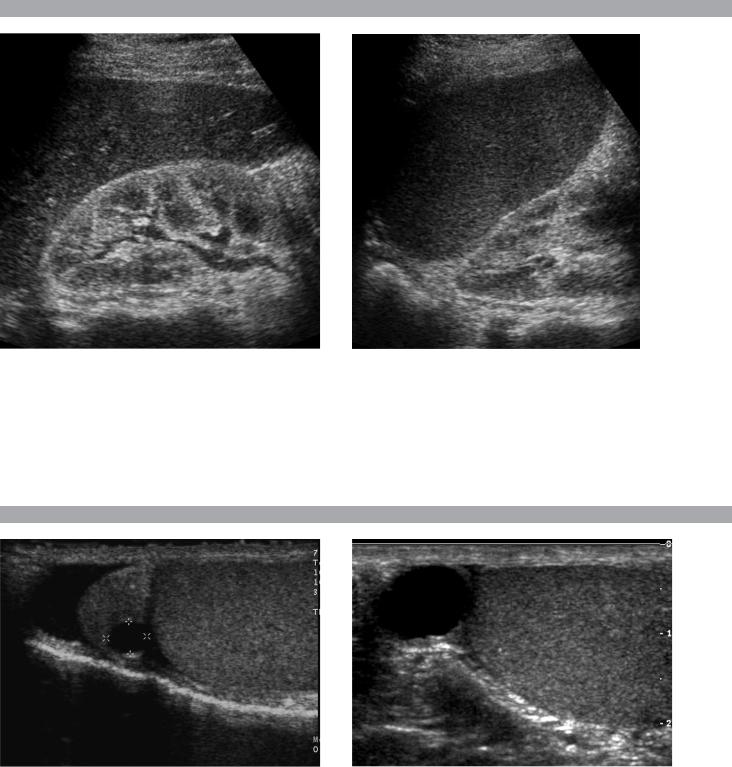
1.In each patient, the second image is most diagnostic of gallstones because it shows shadowing.
2.In the first patient, the focal zone is properly positioned at the level of the stone in the second image. In the first image, the focal zone is located deep to the stone.
3.In the second patient, a higher frequency (8 MHz) probe has been used in the second image. A 4 MHz probe was used in the first image.
4.Calcified and noncalcified stones appear the same on sonography.
Reference
Middleton WD: Right upper quadrant pain. In Bluth EI, Benson C, Arger P, et al (eds): The Practice of Ultrasonography. New York, Thieme, 1999, pp 3–16.
Cross-Reference
Ultrasound: THE REQUISITES, 2nd ed, pp 19–20, 29–33.
Comment
The sonographic criteria for gallstones include (1) echogenic structure in the gallbladder lumen, (2) mobility demonstrated by moving the patient into different positions, and (3) posterior acoustic shadowing. Sludge balls can appear as mobile, echogenic, intraluminal structures, but they do not shadow. Polyps can appear as echogenic, intraluminal structures, but they do not move and do not shadow. Rarely, gallstones are nonmobile because they are adherent to the gallbladder wall, are trapped behind a fold, or are embedded in a gallbladder full of viscous sludge.
Shadowing is related to sound attenuation, which in turn is related to reflection, refraction, scattering, and absorption of the sound. With gallstones, absorption of the sound is the key factor in producing shadowing. Shadowing is related to the size of the stone and is largely independent to the composition of the stone. In other words, noncalcified stones (approximately 85% of total stones) shadow just as much as calcified stones. Stones in the 3 mm or less size range may not shadow regardless of their composition.
In attempting to produce shadowing in small stones, it is important to optimize scanning technique. Focus the transducer at the level of the stone so that the beam profile is minimized and the stone blocks as much of the beam as possible. Also, use as high a probe frequency as possible because penetration through the stone will
be minimized. Finally, if there are multiple, small, nonshadowing stones, change the patient position so that the stones are aggregated together and therefore act as a single larger stone.
62
C A S E 5 7
Longitudinal views of the right and left kidney.
1.What abnormal finding do both of these kidneys demonstrate?
2.What is the specificity of this finding?
3.What next test will help the most in establishing the diagnosis?
4.How well does normal renal echogenicity exclude renal dysfunction?
C A S E 5 8
Longitudinal views of the scrotum in two patients.
1.Do these patients have anything in common?
2.Is this abnormality likely to be palpable?
3.Is this abnormality commonly or uncommonly seen on ultrasound?
4.What does this lesion contain?
63

A N S W E R S
C A S E 5 7
Renal Parenchymal Disease
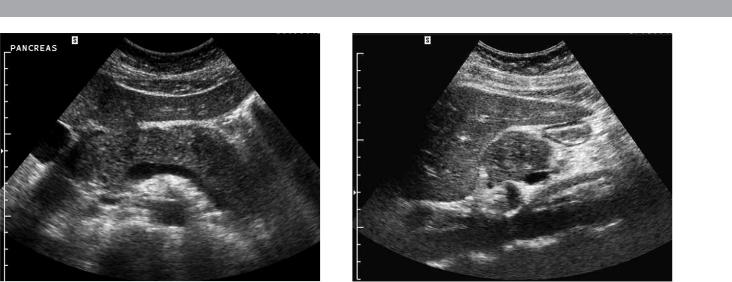
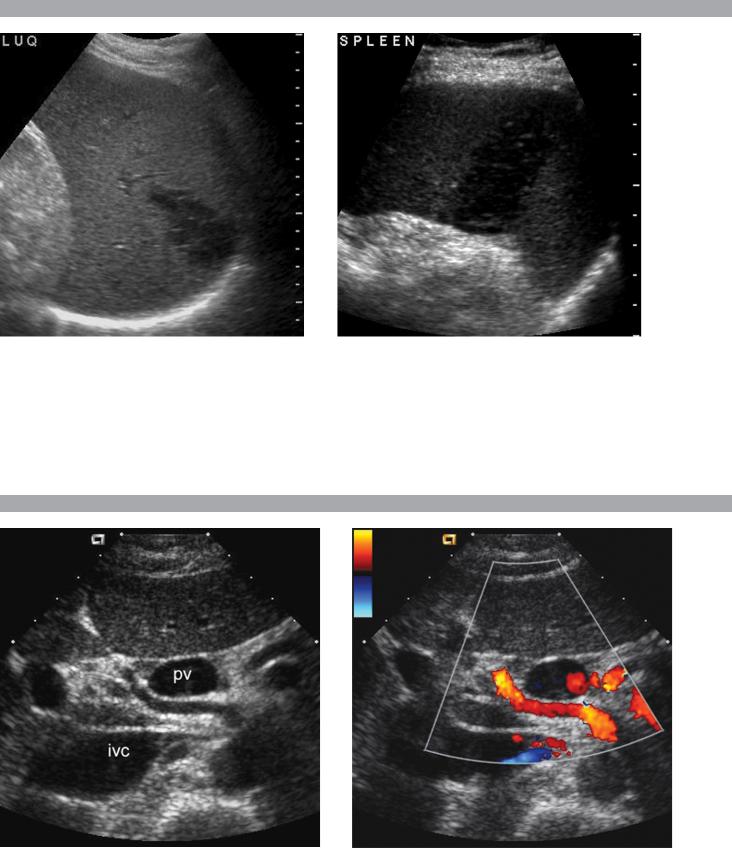
1.Both kidneys demonstrate increased echogenicity.
2.Increased renal echogenicity is relatively specific for renal parenchymal disease, but it does not predict the type of parenchymal disease.
3.The only effective way to distinguish the different types of parenchymal disease is to use clinical information or to do a biopsy.
4.Normal renal echogenicity does not exclude renal parenchymal disease.
Reference
Platt JF, Rubin JM, Bowerman RA, Marn CS: The inability to detect kidney disease on the basis of echogenicity. Am J Roentgenol 1988;151:317–319.
Cross-Reference
Ultrasound: THE REQUISITES, 2nd ed, p 137.
Comment
Abnormalities of renal echogenicity can be detected by comparing the kidneys to the liver and the spleen. The right kidney is usually slightly less echogenic than the liver, although it can be isoechoic to the liver and still be normal. If the right kidney is more echogenic than the liver, it should be considered abnormal. Since the spleen is more echogenic than the liver, the left kidney should be considered abnormal if its echogenicity is equal to or greater than that of the spleen.
When comparing renal, hepatic, and splenic echogenicity, it is important to adjust the distance gain compensation curve so that the hepatic and splenic echogenicity is uniform throughout. If this is not possible, then be sure to compare the kidney to regions of the liver and spleen that are at equivalent depths.
In some patients, it is not possible to directly compare the kidney to the liver and spleen. This might occur when the spleen is small, when there is abundant ascites separating the kidneys from the liver and spleen, or when the liver and spleen are not normal. In particular, in the setting of fatty infiltration of the liver, the kidney may be abnormally echogenic and still appear hypoechoic compared to the liver. In such cases, the renal cortex can be compared to the medullary pyramids. When the cortex is hyperechoic, the pyramids often appear unusually hypoechoic, and this can be used as a soft indicator of renal cortical disease.
Although increased renal echogenicity indicates renal parenchymal disease, it is extremely nonspecific. Many different processes produce the same appearance. Therefore, in a patient with renal dysfunction and echogenic kidneys, biopsy is frequently performed in order to determine the nature of the parenchymal disease.
C A S E 5 8
Spermatocele
1.Both patients have simple-appearing extratesticular cysts located above the testis. In the first image, the cyst is clearly arising within the head of the epididymis. In the second image, the cyst obscures the epididymal head.
2.Spermatoceles are palpable unless they are very small.
3.Spermatoceles are very common.
4.The fluid in a spermatocele contains spermatozoa.
Reference
Feld R, Middleton WD: Recent advances in sonography of the testis and scrotum. Radiol Clin North Am 1992; 30:1033–1051.
Cross-Reference
Ultrasound: THE REQUISITES, 2nd ed, pp 152–154.
Comment
Cysts of the epididymis are extremely common. With improvements in resolution that have occurred since the mid-1990s, it is actually uncommon not to see a cyst in the epididymis. An epididymal cyst is the most common cause of a palpable mass in the scrotum. These cysts are called spermatoceles when they are filled with spermatozoa. They are called epididymal cysts when they contain serous fluid. In the majority of cases, spermatoceles and epididymal cysts both appear as simple cysts without internal echoes, so it is not possible to tell one from the other. Statistically, spermatoceles are more common. Spermatoceles most often occur in the head of the epididymis. They may contain internal septations, especially when they become large. It is uncommon to have symptoms related to a spermatocele, although they may become a cosmetic problem when they are large.
The differential diagnosis of a spermatocele is limited. Hydroceles are usually easily differentiated from spermatoceles because they surround the testis on all sides except for the bare area where the testis is anchored to the scrotal wall. Spermatoceles push the testis rather than surround the testis. An unusual form of hydrocele is called a funiculocele. This represents fluid that accumulates within a focally unobliterated portion of the processus vaginalis in the spermatic cord. Like a spermatocele, a funiculocele is located superior to the testis and may displace the testis inferiorly. If a supratesticular cyst is clearly separate from a normal epididymal head, then it is unlikely to be a spermatocele and more likely to be a funiculocele.
64
C A S E 5 9
Transverse and longitudinal views of the pancreas.
1.What are the abnormal findings?
2.What are the two most common causes of this disorder?
3.What is the primary role of ultrasound in this disorder?
4.Are most abnormalities in the pancreas hypoechoic or hyperechoic?
65

A N S W E R S
C A S E 5 9
Acute Pancreatitis
1.Both images show an enlarged and hypoechoic pancreas.
2.Gallstones and alcohol abuse are the most common causes of pancreatitis.
3.Ultrasound is used to look for gallstones or bile duct obstruction and to help resolve questions raised by CT.
4.Most pancreatic pathology is hypoechoic.
Reference
Balthazar EJ, Freeny PC, van Sonnenberg E: Imaging and intervention in acute pancreatitis. Radiology 1994; 193:297–306.
Cross-Reference
Ultrasound: THE REQUISITES, 2nd ed, pp 194–196.
Comment
Either gallstones or alcohol abuse causes approximately 75% of cases of acute pancreatitis in the United States. Other, less common causes include drugs, hyperlipidemia, ischemia, viral infections, pancreas divisum, and trauma. Approximately 10% of cases are idiopathic. Many of the idiopathic cases may be due to biliary sludge. Obstruction of the pancreatic duct is believed to be responsible for increased intraductal pressure and release of pancreatic enzymes into the interstitial tissues. Alcohol causes precipitation of proteins that obstruct the ducts, and gallstones produce obstruction when they pass through the bile duct and lodge at the ampulla. The severity of pancreatitis ranges from the mildest interstitial (edematous) form, in which there is edema isolated to the pancreas, to necrotizing pancreatitis, in which there is extensive necrosis of the pancreatic parenchyma and adjacent tissues.
The role of sonography in patients with pancreatitis is primarily to evaluate the biliary tract for the presence of gallstones as a possible etiology and the bile duct for possible obstruction. Evaluation of the pancreas is certainly possible with ultrasound, but CT, especially contrast-enhanced CT, is superior in determining the severity and extent of pancreatitis.
Many patients with pancreatitis have a sonographically normal pancreas. When present, the sonographic signs of pancreatitis include increased size and decreased echogenicity of the pancreas, and slight enlargement of the pancreatic duct. Echogenicity is somewhat unreliable since the baseline echogenicity of the pancreas is variable and since it is compared to the echogenicity of the liver, which varies depending on the presence and degree of fatty infiltration. The detection of pancreatic
enlargement is also rather subjective. To further complicate the matter, the pancreas may be difficult to visualize owing to an associated ileus (which causes overlying gas-filled bowel loops) and pain (which precludes compression of the epigastrium). Therefore, it is important to look other places as well. Fortunately, edema and fluid collections frequently dissect into the anterior pararenal fascia, which is usually visible sonographically. In fact, detection of otherwise unexplained fluid around the kidney should always raise the suspicion of pancreatitis. Fluid may also dissect around the splenic hilum and the peripancreatic vessels. Tiny amounts of fluid may accumulate between the body of the pancreas and the portosplenic confluence. This is sometimes referred to as perivascular cloaking.
66
C A S E 6 0
Longitudinal color Doppler views of the left scrotum.
1.What was the patient asked to do when the second color Doppler image was taken?
2.What is the etiology of this condition?
3.What symptoms are related to this lesion?
4.Are these lesions typically unilateral or bilateral?
C A S E 6 1
Longitudinal views of the gallbladder.
1.What is the differential diagnosis based only on the first image?
2.How does the second image help in establishing the diagnosis?
3.How can follow-up studies help?
67

A N S W E R S
C A S E 6 0
Varicocele
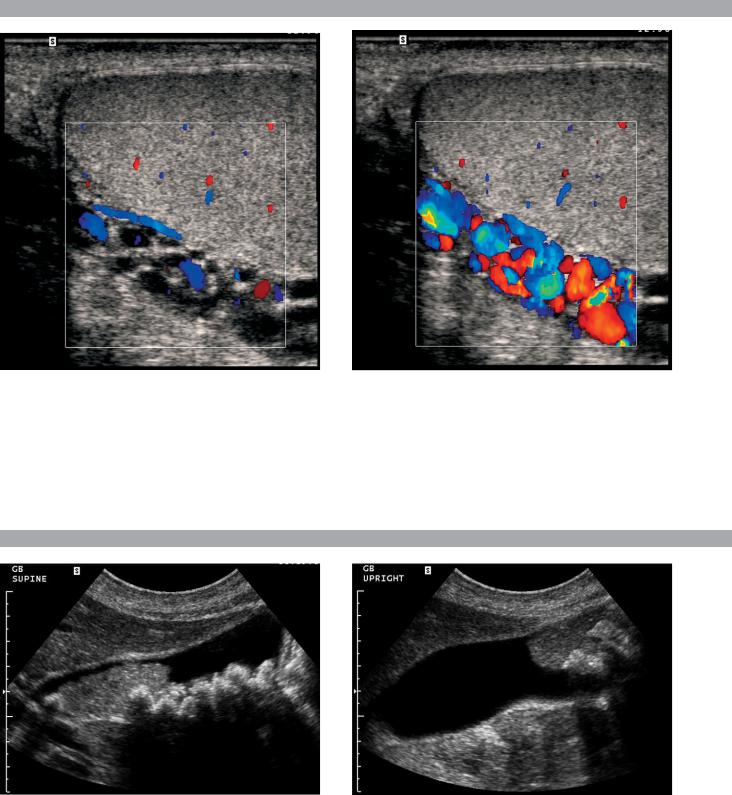
1.Flow is augmented and becomes detectable when the patient performs a Valsalva maneuver.
2.Incompetent valves in the spermatic vein cause varicoceles.
3.Varicoceles can potentially contribute to infertility. When large, they can cause pain.
4.Eighty-five percent are unilateral on the left; 10% to 15% are bilateral. Unilateral right varicoceles are rare.
Reference
Feld R, Middleton WD: Recent advances in sonography of the testis and scrotum. Radiol Clin North Am 1992; 30:1033–1051.
Cross-Reference
Ultrasound: THE REQUISITES, 2nd ed, pp 155–157.
Comment
The veins of the pampiniform plexus enter the spermatic cord and drain into the internal spermatic veins. The left spermatic vein empties into the left renal vein, and the right empties into the inferior vena cava. Varicoceles are dilated veins of the pampiniform plexus. They are almost always caused by incompetent valves within the internal spermatic vein. Incompetent valves allow increased hydrostatic pressure when the patient is upright, which results in gradual enlargement of the veins. Varicoceles predominate on the left because compression of the left renal vein as it passes between the superior mesenteric artery and the aorta causes higher pressure on the left side. In rare instances, varicoceles can be due to obstruction of the spermatic veins secondary to processes such as masses, retroperitoneal fibrosis, or venous tumor invasion.
Although controversial, most investigators believe that even small, subclinical varicoceles may contribute to abnormal semen analysis results, and that treatment of varicoceles may improve fertility. Therefore, the diagnosis of a varicocele is especially important in the investigation of male infertility.
Varicoceles appear as an increased size, number, and tortuosity of the veins around the testis. When small, they are usually seen most prominently at the superior or lateral aspect of the testis. Large varicoceles extend to the posterior and inferior aspect of the scrotum. Reports indicate that normal peritesticular veins should be less than 2 or 3 mm in diameter. In my experience, they seldom exceed 2 mm. On color Doppler scanning, venous flow in varicoceles is generally too slow to be detected with the patient at rest. Sometimes, this slow flow is apparent on gray-scale imaging. With a Valsalva
maneuver, there is augmented retrograde flow in the varicocele that is readily detectable on color Doppler imaging. This augmented flow usually lasts longer than 1 second. In a patient with infertility, if augmented flow is not seen when the patient is in the supine position, the patient should perform a Valsalva maneuver while being scanned in an upright position.
C A S E 6 1
Tumefactive Sludge (Sludge Ball)
1.In addition to gallstones, the first image shows well-formed, nonshadowing echogenic material. The differential diagnosis includes sludge, clotted blood, and neoplasm.
2.The second image excludes neoplasm because it documents mobility.
3.In some patients tumefactive sludge does not move. In such cases, it is useful to obtain follow-up scans because the sludge usually changes over time.
Reference
Middleton WD: The gallbladder. In Goldberg BB (ed): Diagnostic Ultrasound. Baltimore, Williams & Wilkins, 1993, pp 116–142.
Cross-Reference
Ultrasound: THE REQUISITES, 2nd ed, pp 34–35.
Comment
In most cases, sludge forms a layer of echogenic material along the dependent aspect of the gallbladder lumen. Occasionally, sludge forms a more mass-like aggregate referred to as a sludge ball or as tumefactive sludge. As is true with typical sludge, sludge balls are mobile and do not cast an acoustic shadow. The lack of shadowing helps to distinguish sludge balls from stones, and the mobility helps to distinguish sludge balls from tumors or polyps. Internal vascularity can be detected in many large polyps and polypoid cancers but is not present in sludge. Therefore, color Doppler can occasionally help in the differential diagnosis.
In some cases, tumefactive sludge forms in the presence of bile so viscous that it is impossible to document mobility. In such cases, a follow-up scan several weeks later can be useful since sludge may resolve, regress, or change in some other way.
68
C A S E 6 2
Longitudinal gray-scale view and pulsed Doppler waveform of the groin.
1.How does the waveform shown in this case differ from the normal triphasic waveform of extremity arteries?
2.What is the significance of this type of waveform?
3.What is the differential diagnosis for hypoechoic groin masses?
4.What is the initial treatment of choice for this lesion?
C A S E 6 3
Two color Doppler images of the same vessel.
1.What is the direction of blood flow in the two images?
2.What does a positive Doppler frequency shift indicate?
3.Would you usually expect it to be easier to determine flow direction at a Doppler angle of 5 degrees or of 85 degrees?
4.In what circumstance would your answer to the preceding question be different?
69

A N S W E R S
C A S E 6 2
Postcatheterization Pseudoaneurysm
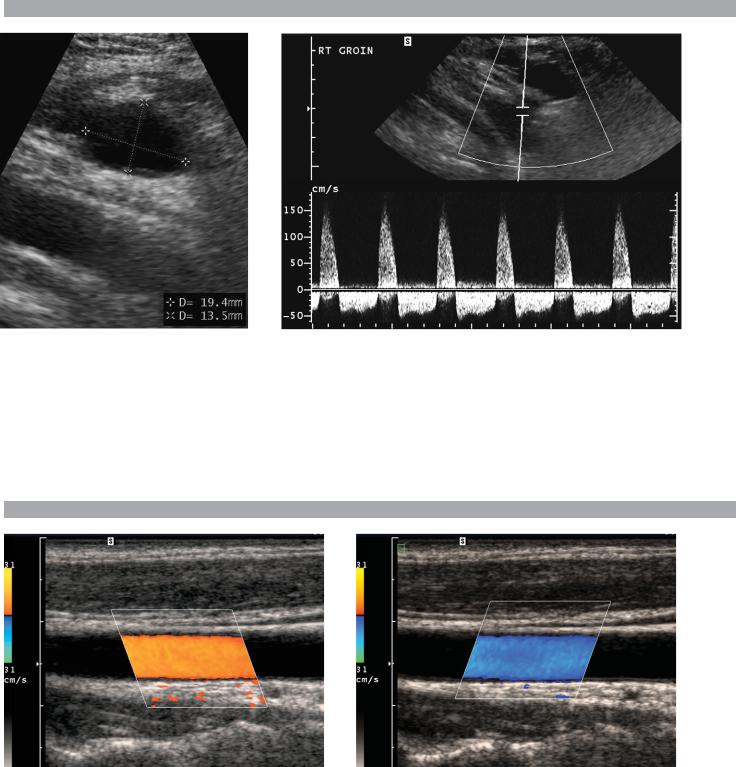
1.The waveform exhibits pandiastolic flow reversal. The normal triphasic pattern has only a short period of flow reversal in early diastole.
2.It comes from the neck of a pseudoaneurysm and reflects flow into the aneurysm during systole and flow out of the aneurysm during diastole.
3.The differential includes hematoma, abscess, adenopathy, and hernia.
4.Initial treatment is ultrasound-guided thrombin injection.
Reference
Middleton WD, Dasyam A, Teefey SA: Diagnosis and
treatment of iatrogenic femoral artery pseudo-
aneurysms. Ultrasound Q 2005;21:3–17.
Cross-Reference
Ultrasound: THE REQUISITES, 2nd ed, pp 295–297.
Comment
The frequency of postcatheterization pseudoaneurysm (PA) increased in the 1990s due to increased use of large catheters and anticoagulation during vascular interventions. PA typically manifests with swelling and ecchymosis in the first day or two following the procedure. In this setting, a PA basically is a hematoma that maintains an internal area of extravascular blood flow via a patent neck that communicates with the femoral artery. With time, a fibrous capsule may develop around the PA.
On sonography, a PA appears as a collection of fluid adjacent to the injured artery. With gray-scale imaging, it is often possible to see the collection expand during systole and contract during diastole. Otherwise, it is not possible to distinguish a PA from a simple hematoma. A PA may or may not have a significant amount of clotted blood at the periphery. It is not uncommon to see several adjacent PAs connected to each other via thin tracts.
With color Doppler, it is possible to detect flowing blood in the lumen of a PA. Typically, blood flow into the PA concentrates along one wall, and flow out of the PA concentrates along the opposite wall. This produces the typical swirling, or “yin-yang” appearance, in which one half of the lumen appears red and the other half appears blue. There are many variations on this pattern depending on the direction of the inflow jet into the aneurysm lumen. The key point is not the pattern of luminal flow but simply the presence of flow. Another classic characteristic of PAs is the “to and fro” waveform in the neck. This refers to systolic flow (into the PA) on
one side of the Doppler baseline and diastolic flow (out of the PA and back into the artery) on the other side of the baseline. As in this case, the reversed flow is pandiastolic.
C A S E 6 3
Beam Steering and Color Assignment
1.Blood flow is from the right to the left.
2.Flow is toward the origin of the Doppler pulse.
3.Flow direction should be easiest to determine at a Doppler angle closest to 0 degrees.
4.The preceding answer changes if there is extensive Doppler aliasing at the lower Doppler angles.
Reference
Middleton WD: Color Doppler image optimization and interpretation. Ultrasound Q 1998;14:194–208.
Cross-Reference
Ultrasound: THE REQUISITES, 2nd ed, pp 12–15.
Comment
The most basic aspect of color Doppler image interpretation is the determination of flow direction. Blood flow going toward the origin of the Doppler pulse produces a positive shift, whereas flow away from the Doppler pulse produces a negative shift. Once the sign of the Doppler frequency shift is known, it is possible to determine which direction blood is flowing in a given vessel.
The color Doppler scale displays positive shifts on the top and negative shifts on the bottom. In general, red is assigned to positive shifts and blue to negative shifts. When the color assignment is inverted, the color scale displays red on the bottom and blue on the top. Another method of changing the color assignment in a vessel is to change the direction of the Doppler pulse. With linear array transducers, this can be done by electronically steering the beam, as was done in this case. With phased array sector or curved array probes, the Doppler pulse can be redirected by repositioning or reangling the probe. When a vessel is curved or tortuous, different segments may have different color assignments owing to variation in the direction of blood flow with respect to the transmitted Doppler pulse.
70
C A S E 6 4
Transverse views of the spleen in different patients.
1.Describe the abnormality seen in these patients.
2.Is this likely to be acute or chronic?
3.Would other tests be valuable in further characterization of this abnormality?
4.What are the common causes of this abnormality?
C A S E 6 5
Transverse gray-scale and color Doppler view of the portal vein (PV) and inferior vena cava (IVC).
1.What type of Doppler signal would you expect from the vessel running between the PV and the IVC?
2.From where does this vessel usually arise?
3.How often is this vessel located in this location?
4.What is the normal course of this vessel?
71