

Глава из книги Случаи УЗДиагностики
.pdfA N S W E R S
C A S E 6 4
Splenic Infarction
1.Peripheral, wedge-shaped, hypoechoic with a coarsened echotexture.
2.This is probably fairly acute since infarcts tend to become more hyperechoic with age.
3.Contrast enhanced CT may be helpful since the wedge shape may be more apparent and other infarcts may be seen.
4.Common causes of splenic infarction include emboli of cardiac or atherosclerotic origin, lymphoproliferative disease, arteritis, pancreatitis, sepsis, and sickle cell anemia.
Reference
Goerg C, Schwerk WB: Splenic infarction: Sonographic patterns, diagnosis, follow-up, and complications. Radiology 1990;174:803–807.
Cross-Reference
Ultrasound: THE REQUISITES, 2nd ed, pp 218–219.
Comment
Infarcts are one of the most common causes of focal splenic lesions. When they are small, they usually produce no clinical symptoms or only minor symptoms. Therefore, it is not unusual to see them as incidental findings. Pain, fever, and diaphragmatic irritation can occur with large infarcts.
Classically, splenic infarctions appear as multiple or solitary wedge-shaped, peripherally located lesions, as shown in this case. They are usually hypoechoic, but have also been reported as anechoic. They can also appear as spherical masses that are impossible to distinguish from neoplastic processes. In most cases, the clinical history will suggest the correct diagnosis. In addition, the coarsened echotexture of infarcted splenic parenchyma is very characteristic and can be a valuable clue to the proper diagnosis. In some patients, imaging with CT may help in further characterization. If there is a contraindication to iodinated contrast, then MRI is an alternative approach.
C A S E 6 5
Replaced Right Hepatic Artery
1.A Doppler waveform would show an arterial signal with flow toward the liver.
2.Most often, an artery running between the PV and the IVC is an anomalous right hepatic artery coming from the superior mesenteric artery. Occasionally, a hepatic artery may arise normally from the celiac axis and then travel anomalously behind the PV prior to entering the liver.
3.Replaced or accessory right hepatic arteries occur in approximately 20% of the population.
4.Normally, the hepatic artery runs anterior to the PV.
Reference
Lafortune M, Patriquin H: The hepatic artery: Studies using Doppler sonography. Ultrasound Q 1999;15(1):9–26.
Cross-Reference
Ultrasound: THE REQUISITES, 2nd ed, pp 51–52.
Comment
Normally, the celiac axis divides into the splenic artery, the left gastric artery, and the common hepatic artery. The first branch of the common hepatic artery is the gastroduodenal artery. Beyond the gastroduodenal, the name of the hepatic artery changes to the proper hepatic artery. The proper hepatic artery then divides into the right and left hepatic artery. Some variation of this standard anatomy is present in slightly less than half of the population.
An artery is called a replaced artery if the entire artery arises from an anomalous source. An artery is called an accessory artery if one branch originates from its usual origin and another branch arises from some other vessel. Replaced or accessory right hepatic arteries arising from the superior mesenteric artery are present in approximately 20% of patients. Unlike the normal hepatic artery, they travel behind the PV and then ascend to the liver in the hepatoduodenal ligament. After the replaced hepatic artery passes to the right behind the PV, it then wraps around the right side of the PV and eventually is located anterior to the PV and lateral to the common duct. This can produce a situation in which there are three round structures anterior to the PV on transverse views, with the common duct placed between the normal left hepatic artery and the replaced right hepatic artery.
72
C A S E 6 6
Views of the gallbladder in different patients.
1.What is unusual about both of these patients?
2.Is it possible to predict the composition of stones in these patients?
3.Is this a common finding?
4.In what circumstance does this occur?
C A S E 6 7
Transverse views of the volar surface of the wrist in different patients.
1.What normal structure is being shown?
2.What term is used to describe the normal appearance of this structure?
3.On the transverse view, what accounts for the multiple, small, circular hypoechoic regions?
4.Are tumors of this structure typically hypovascular or hypervascular?
73

A N S W E R S
C A S E 6 6
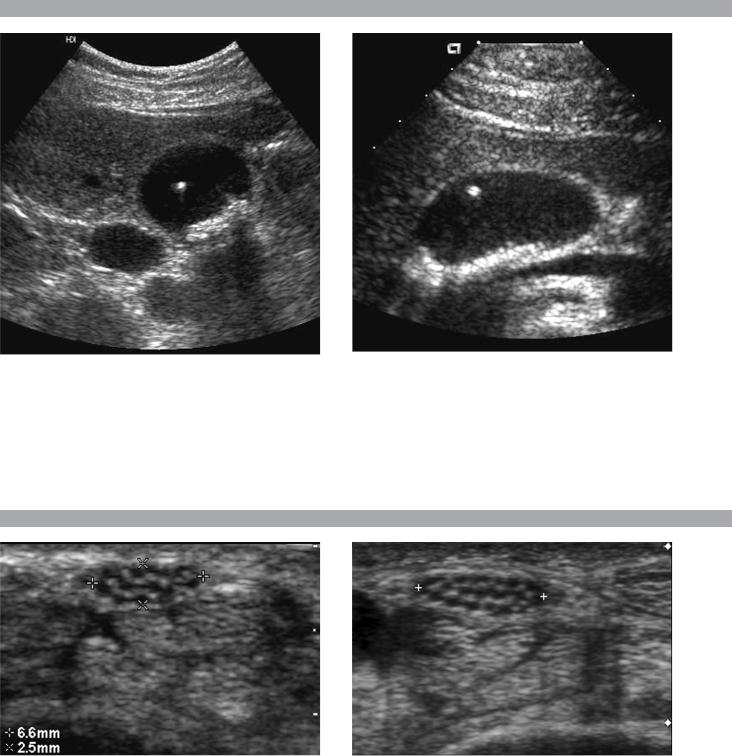
Floating Gallstones
1.In both cases, stones are seen layering in the dependent portion of the gallbladder, but a stone is also seen floating in the middle of the gallbladder.
2.In most circumstances, it is not possible to predict gallstone composition. However, only cholesterol stones float, so in this case prediction is possible.
3.This is a very uncommon finding.
4.Gallstones float only when the specific gravity of the bile is greater than the specific gravity of the stone.
Reference
Yeh HC, Goodman J, Rabinowitz JG: Floating gallstones in bile without added contrast material. Am J Roentgenol 1986;146:49–50.
Cross-Reference
Ultrasound: THE REQUISITES, 2nd ed, pp 33–34.
Comment
In the age of oral cholecystography, it was not uncommon to see gallstones floating in the nondependent portion of the gallbladder. This was because the opacification of the bile caused by the medication also caused an increase in the specific gravity of the bile. If the specific gravity of the stones is less than that of the bile, then the stones will float.
Today, oral cholecystography is no longer performed, so it is very uncommon for the specific gravity of bile to exceed that of gallstones. One exception is when there is some degree of vicarious biliary excretion of iodinated intravenous contrast material. One of the patients shown in this case had a contrast-enhanced CT prior to the ultrasound.
Regardless of the reason, when stones are seen to float in the nondependent portion of the gallbladder, it is safe to say that they are unusually buoyant and, therefore, to predict that they are composed of cholesterol.
C A S E 6 7
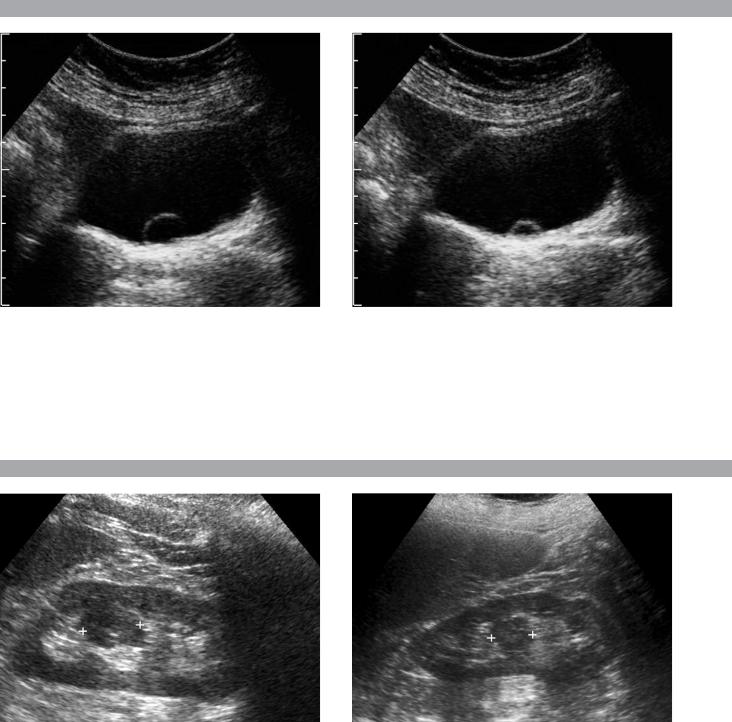
Normal Median Nerve
1.Peripheral nerve.
2.Fascicular.
3.Nerve fascicles.
4.Hypervascular.
References
Martinoli C, Bianchi S, Derchi LE: Ultrasonography of
peripheral nerves. Semin Ultrasound CT MRI 2000;21:
205–213.
Peer S, Kovacs P, Harpf C, Bodner G: High-resolution
sonography of lower extremity peripheral nerves:
Anatomic correlation and spectrum of disease.
J Ultrasound Med 2002;21:315–322.
Cross-Reference
Ultrasound: THE REQUISITES, pp 278–280.
Comment
Peripheral nerves are relatively superficial structures and in most areas they can be visualized quite well with sonography. They are composed of multiple internal neuronal fascicles that appear hypoechoic on highresolution scans. On transverse views, internal nerve fascicles are roughly round in shape and are surrounded by the hyperechoic epineurium, a loose connective tissue composed of collagen and adipose. Peripheral nerves can simulate tendons, but the echoarchitecture of nerves is more fascicular, whereas the architecture of tendons is more fibrillar.
74
C A S E 6 8
Two transverse views of the urinary bladder in the same patient.
1.What is the diagnosis?
2.Is this more readily seen on sonography or cystography?
3.What would you expect to see if you scanned this over several minutes?
4.Would you expect the kidneys to be hydronephrotic?
C A S E 6 9
Longitudinal views of the left kidney in two patients.
1.What is the most likely diagnosis?
2.What is the other primary differential diagnosis?
3.What test could be used to confirm the diagnosis?
4.Are other tests usually necessary in this situation?
75

A N S W E R S
C A S E 6 8
Ureterocele
1.Ureterocele.
2.This is more easily seen on sonography than on cystography.
3.With ureteral peristalsis, ureteroceles transiently expand.
4.No. Simple ureteroceles are typically not associated with obstruction.
Reference
Madeb R, Shapiro I, Rothschild E, Halachimi S:
Evaluation of ureterocele with Doppler sonography.
J Clin Ultrasound 2000;28:425–429.
Cross-Reference
Ultrasound: THE REQUISITES, 2nd ed, pp 179–180.
Comment
Ureteroceles are focal dilatations of the intramural portion of the distal ureter. Simple ureteroceles are typically seen in adults and are located at the normal ureteral orifice. Ectopic ureteroceles are associated with duplicated collecting systems and arise from the upper pole system.
Ureteroceles vary in size. The walls are uniformly thin and concentric. As the ureter peristalses, urine enters the ureterocele and it transiently enlarges. Then the urine in the ureterocele empties into the bladder and the ureterocele decompresses. This explains the difference in size of the ureterocele shown in this case. Urinary jets can be well visualized exiting ureteroceles exactly like they can with normal ureteral orifices.
Pseudoureteroceles refer to lesions in the bladder that either simulate a ureterocele on urography or that secondarily cause a ureterocele. Distal ureteral stones, bladder tumors, focal cystitis, perivesicular tumors, and perivesicular inflammatory processes can all produce a pseudoureterocele on urography or cystography. Sonography is an excellent way to evaluate all of these defects in the region of the ureteral orifice. Stones, tumors, perivesicular lesions, and simple ureteroceles all have very distinct sonographic appearances.
C A S E 6 9
Column of Bertin
1.Column of Bertin.
2.Renal neoplasm, especially renal cell cancer.
3.Contrast-enhanced examination (sonography, CT, or MRI) could be used. Scintigraphy could also be used to confirm that the mass consists of normally functioning renal parenchyma.
4.No. The diagnosis can typically be made with sonography. Further tests are only required if there is a strong clinical suspicion of renal neoplasm or if there is some atypical ultrasound feature.
References
Yeh HC: Some misconceptions and pitfalls in ultrasonography. Ultrasound Q 2001;17:129–155.
Yeh HC, Halton KP, Shapiro RS, et al: Junctional parenchyma: Revised definition of hypertrophied column of Bertin. Radiology 1992;185:725–732.
Cross-Reference
Ultrasound: THE REQUISITES, 2nd ed, pp 103–105.
Comment
A hypertrophied column of Bertin is a relatively common anatomic variant that has been referred to by a number of terms, including hypertrophied septum of Bertin, focal cortical hyperplasia, lobar dysmorphism, accessory renal lobe, and renal pseudotumor. Based on the embryology of the kidney and the appearance on sonography, Yeh et al. believe that it is the result of unresorbed parenchyma at the junction of the upper and lower pole embryologic renal subunits. These investigators propose that the most appropriate term for this finding is junctional parenchyma. As might be expected, this variant is often associated with a bifid or duplicated collecting system.
It typically appears as a mass that indents into the central renal sinus at the junction of the upper and middle third of the kidney. The anomaly is 2 or 3 cm in size and the outer contour of the kidney is undisturbed. The echogenicity is either similar to or slightly greater than the rest of the renal cortex. An embedded pyramid is seen occasionally as a small hypoechoic region within the junctional parenchyma. Recognition of an embedded pyramid makes the diagnosis even more certain.
76
C A S E 7 0
Longitudinal gray-scale view and transverse power Doppler view of the proximal fifth finger.
1.What are the pertinent findings?
2.What is the role of ultrasound in making this diagnosis?
3.What limits the ability of ultrasound to make this diagnosis?
4.How accurate is ultrasound in establishing this diagnosis in the hand and wrist?
C A S E 7 1
Waveforms from the portal vein in different patients.
1.Which of these portal vein waveforms is abnormal?
2.What is the normal blood flow velocity in the portal vein?
3.Is portal flow normally hepatofugal or hepatopetal?
4.Which portal vein tributary normally has hepatopetal flow?
77

A N S W E R S
C A S E 7 0
Foreign Body
1.The gray-scale view shows a small echogenic structure in the soft tissue of the finger with a faint posterior shadow. The power Doppler view shows a linear echogenic structure with intense surrounding hyperemia.
2.Ultrasound is used to look for radiolucent foreign bodies. These include wood, glass, and plastic. Ultrasound is also used to localize foreign bodies for resection.
3.Size, depth, and composition of the foreign body limit the ability of ultrasound to make this diagnosis.
4.Very good. Sensitivity is approximately 95%.
Reference
Bray PW, Mahoney JL, Campbell JP: Sensitivity and specificity of ultrasound in the diagnosis of foreign bodies in the hand. J Hand Surg 1995;20(A):661–666.
Cross-Reference
Ultrasound: THE REQUISITES, 2nd ed, pp 289–291.
Comment
Foreign bodies retained after trauma can be a source of chronic pain or infection. Many foreign bodies are radio-opaque and can be detected and localized with radiographs. Those that are not radio-opaque can usually be seen with ultrasound. In the study of cadaveric hands and wrists referenced with this case, Bray and colleagues showed that sonographic detection of foreign bodies was excellent for objects between 1 × 4 and 2 × 5 mm. Visualization was 100% for all objects placed in the palm except for small glass particles. Visualization ranged from 79% to 100% for different types and sizes of foreign bodies placed in the fingers.
All foreign bodies appear as bright reflectors. They may or may not be associated with an adjacent hypoechoic inflammatory process or an adjacent abscess. Acoustic shadowing may be seen if the foreign body is large enough to block a significant amount of the ultrasound beam. Glass or metallic objects may show ringdown or comet-tail artifacts. If adjacent inflammation is present, color or power Doppler may demonstrate surrounding hyperemia, as seen in this case.
C A S E 7 1
Normal Portal Vein Waveforms
1.Neither is abnormal.
2.Fifteen to 30 cm/sec.
3.Hepatopetal (toward the liver).
4.All tributaries of the portal vein normally have hepatopetal flow.
Reference
Gallix BP, Taourel P, Duazat M, Bruel JM, Lafortune M: Flow pulsatility in the portal venous system: A study of Doppler sonography in healthy adults. Am J Roentgenol 1997;169:141–144.
Cross-Reference
Ultrasound: THE REQUISITES, 2nd ed, p 71.
Comment
Portal vein blood flow is normally the major blood supply to the liver. Approximately 75% of hepatic blood flow is contributed by the portal vein. Although the liver is very close to the heart, the hepatic parenchyma and its sinusoidal network effectively isolate the portal vein from the pressure fluctuations in the right heart. For this reason, the portal vein waveform is much less pulsatile than other centrally located veins. However, the normal portal vein waveform usually does have some gentle pulsatility related to the cardiac cycle. Since right heart dysfunction and tricuspid regurgitation can cause increased portal vein pulsatility, the question is how much pulsatility is too much? Using a venous pulsatility index defined as (maximum - minimum)/maximum, Gallix found that approximately 50% of normal individuals had an index greater than 0.5. This means that the maximum flow velocity was greater than twice the minimum velocity. In only one individual did the minimum velocity reverse or drop to zero. In their group, venous pulsatility index was inversely related to body mass index. In other words, thin individuals tend to have more pulsatile portal waveforms (the individual shown in the second image was thin). A good rule of thumb is that minimum flow velocities should not drop all the way to the baseline and certainly not below baseline.
78
C A S E 7 2
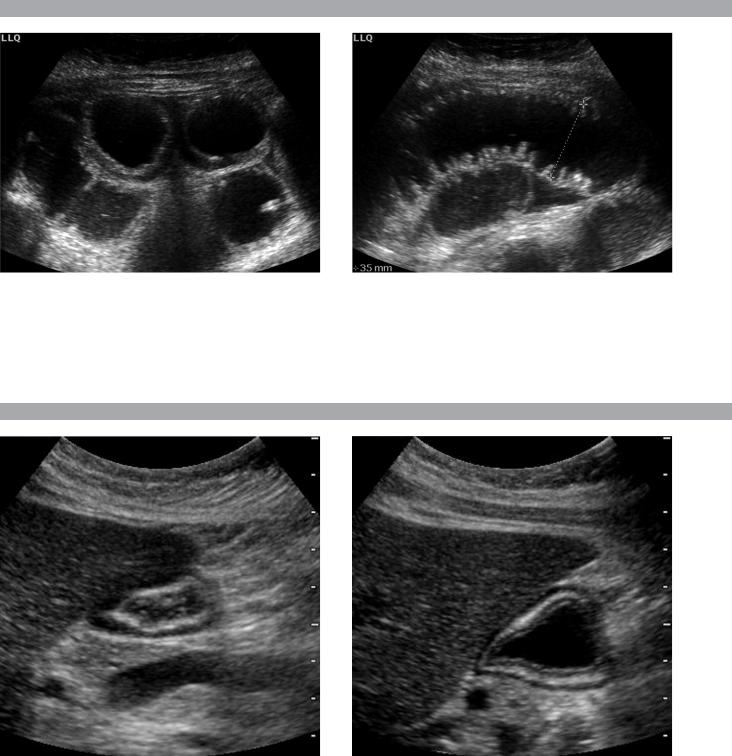
Images of the left lower quadrant in a patient with nausea and vomiting.
1.What organ is being imaged?
2.What is the upper limit of normal for the diameter of this structure?
3.What else should you do when you see this abnormality?
C A S E 7 3
Sagittal view of the stomach before and after drinking water.
1.Does this stomach appear normal or abnormal?
2.What constitutes the typical “gut signature” on transabdominal sonography?
3.How many layers of the gastric wall are potentially visible on sonography?
4.Are these same layers visible in other intestinal structures such as small bowel or colon?
79

A N S W E R S
C A S E 7 2
Small Bowel Obstruction
1.Small bowel.
2.Upper limit of normal is 3 cm.
3.Look for a potential cause of the obstruction.
Reference
O’Malley ME, Wilson SR: US of gastrointestinal tract abnormalities with CT correlation. Radiographics 2003; 23:59–72.
Cross-Reference
Ultrasound: THE REQUISITES, 2nd ed, pp 220–221.
Comment
The diagnosis of small bowel obstruction (SBO) is typically made with a combination of plain radiographs and fluoroscopic evaluation. Recently, CT has become important in the diagnosis and analysis of suspected SBOs. Although sonography is seldom requested in adult patients with suspected SBOs, it is often the initial study obtained in patients with abdominal pain of unclear etiology, and some of these patients inevitably have SBOs. Therefore, it is important to include a survey of the bowel as a routine part of the evaluation of patients with abdominal pain and distension.
Sonographic findings of SBO include dilated, fluidfilled intestinal loops. The presence of valvulae conniventes confirms that the loop is small bowel. During real-time evaluation, peristaltic activity is often evident as a to-and-fro motion of the bowel contents. However, with progressive obstruction, peristalsis may cease.
Once the diagnosis of obstruction is made, a survey of the abdomen should be undertaken to identify potential causes of obstruction, such as masses, fluid collections, hernias, or intrinsic bowel processes.
C A S E 7 3
Normal Layers of the Gastrointestinal Tract
1.This stomach is normal.
2.On cross-sectional transabdominal views the gut typically appears as a target with a central echogenic component and a hypoechoic outer rim.
3.Five layers can be seen on high-resolution views of the gastric wall.
4.These five layers can be seen on high-resolution views of all intestinal structures.
Reference
Wilson SR: Gastrointestinal tract sonography. Abdom Imaging 1996;21:1–8.
Cross-Reference
Ultrasound: THE REQUISITES, 2nd ed, p 220.
Comment
There are five visible intestinal wall layers that are visible on high-resolution views of the gut. Although these layers are generally only visible on endoscopic sonography, when the imaged bowel loop is superficial and the patient is not obese, they can also be seen on transabdominal scans such as the ones seen in this case. The inner hyperechoic layer is the interface reflection between the contents in the lumen and the surface of the superficial mucosa. The inner hypoechoic layer is the deep mucosa and the muscularis mucosa. The middle hyperechoic layer is the submucosa. The outer hypoechoic layer is the muscularis propria. The outer hyperechoic layer is the serosa/adventitia combined with the interface reflection between muscularis propria and the serosa. When resolution is more limited, as is often the case with transabdominal scans, the mucosa, muscularis mucosa, and submucosa appear as a single hyperechoic layer surrounded by the outer hypoechoic muscularis propria. This results in a bull’s-eye or target appearance that is the classic bowel signature on transabdominal scans.
80