

Глава из книги Случаи УЗДиагностики
.pdfA N S W E R S
C A S E 1 8
Complete Tear of the Achilles Tendon
1.Both scans show a complete gap in the normal continuity of the tendon located approximately 6 cm proximal to the calcaneus.
2.In a patient with a complete tear of the Achilles, the tendon should be scanned in both plantarflexion and dorsiflexion.
3.Tears usually occur 2 to 6 cm proximal to the insertion.
4.The gastrocnemius and soleus muscles form the Achilles tendon.
Reference
Fessell DP, Vanderschueren GM, Jacobson JA, et al: US of the ankle: Technique, anatomy, and diagnosis of pathologic conditions. Radiographics 1998;18:325–340.
Cross-Reference
Ultrasound: THE REQUISITES, 2nd ed, pp 279–280.
Comment
The Achilles tendon is the thickest and strongest in the body. As fibers from the soleus and gastrocnemius muscles descend toward the insertion on the posterior surface of the calcaneus, they spiral approximately 90 degrees so that the fibers that start in a medial location end up in a superficial location. This arrangement conveys some elastic property to the tendon.
Despite its size and strength, the Achilles tendon is the most commonly injured tendon in the ankle. It can tear when it is exposed to unusual stresses, when it is exposed to chronic low-grade stresses, or with agerelated attritional changes. Because the Achilles is easy to palpate, complete tears are usually diagnosed and managed effectively without imaging of any type. One role of sonography is to measure the gap between the proximal and distal fragments. When the fragments are closely apposed during plantarflexion, the tear can be treated conservatively with casting. When the gap is large, surgical repair is necessary.
On sonography, complete tears of the Achilles tendon appear as a focal total disruption of the normal fibrillar pattern. This disruption usually occurs in a relatively hypovascular zone 2 to 6 cm proximal to the Achilles insertion. In the acute setting, there is a heterogeneous, often solidand cystic-appearing hematoma at the site of the tear, as seen in this case. The retracted tendon ends may lose their fibrillar appearance, at least partially, because they are no longer stretched and the fibers are not straight. Refractive shadowing is often seen at the site of the retracted tendon ends. In the chronic setting, scar tissue and granulation tissue develop in the tear and are distinguished from normal tendon by their lack of fibrillar architecture.
C A S E 1 9
Orchitis
1.Blood flow to the right testis is dramatically increased. This degree of hyperemia is usually due to orchitis. Normal flow is present in the left testis.
2.Orchitis is usually associated with epididymitis.
3.Color Doppler shows increased blood flow to the testis before any gray-scale changes are apparent.
4.Testicular hyperemia may be present for a short period of time following spontaneous or manual detorsion.
Reference
Horstman WG, Middleton WD, Melson GL: Scrotal
inflammatory disease: Color Doppler ultrasonographic
findings. Radiology 1991;179:55–59.
Cross-Reference
Ultrasound: THE REQUISITES, 2nd ed, pp 171–174.
Comment
Orchitis typically occurs as a secondary event in patients with primary epididymitis. However, it can also be isolated, such as with mumps orchitis or other viral infections. Regardless of its cause, orchitis is manifest clinically as an enlarged and painful testis.
On sonography, orchitis appears as a hypoechoic, enlarged testis. On color Doppler, an inflammatory hyperemia will appear as increased blood flow to the affected side. Generally, the changes in blood flow precede the changes in testicular morphology. Therefore, color Doppler is more sensitive to the diagnosis than is gray-scale sonography.
In most cases, the entire testis is involved. When focal orchitis occurs, it appears as a focal area of decreased echogenicity and increased vascularity. This sonographic appearance can overlap with the appearance of testicular tumors. The easiest way to distinguish a tumor from focal orchitis is on clinical grounds. Tumors will usually be readily palpable and nontender, whereas focal orchitis is nonpalpable and tender. On sonography, it is helpful to look at the epididymis. Focal orchitis will usually be associated with epididymitis, and an enlarged hyperemic epididymis will be apparent. Testicular tumors usually do not involve the epididymis. It is also useful to look in the retroperitoneum since detectable adenopathy makes a tumor much more likely than a benign testicular process.
22
C A S E 2 0
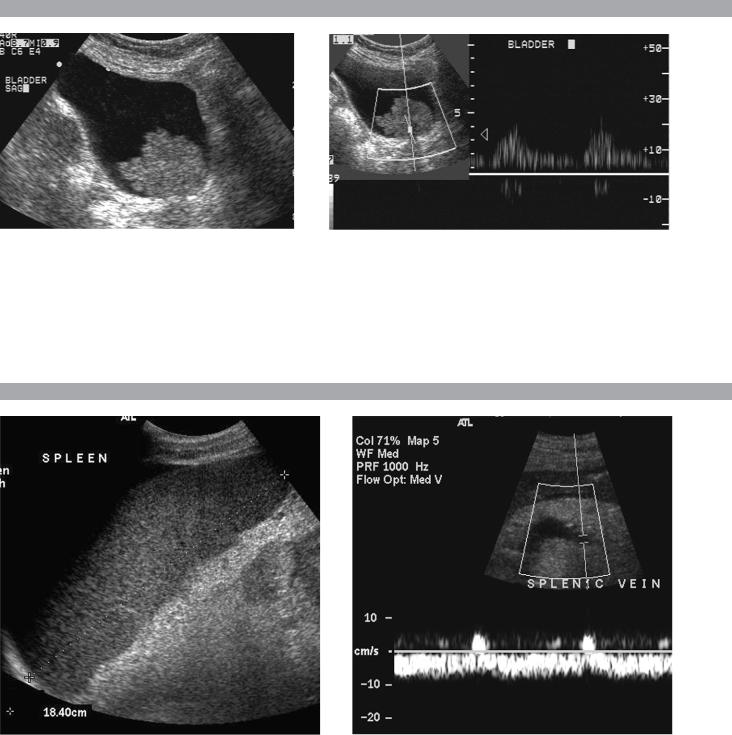
Longitudinal gray-scale view of the bladder and similar view with pulsed Doppler analysis.
1.Describe the abnormality.
2.What is the likely diagnosis?
3.Is this abnormality easier to detect on the anterior or posterior wall?
4.What is the most common location of this type of lesion?
C A S E 2 1
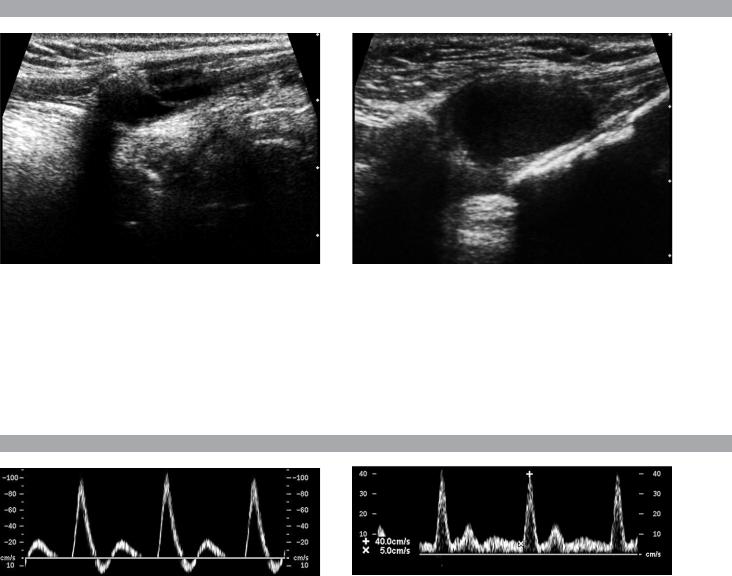
Longitudinal view of the spleen and transverse view of the epigastrium with pulsed Doppler waveform of the splenic vein.
1.What is the upper limit of normal for spleen length?
2.Is the flow in this patient’s splenic vein normal?
3.What is the likely cause of this patient’s splenic abnormality?
4.Does the spleen normally extend below the left kidney?
23

A N S W E R S
C A S E 2 0
Transitional Cell Carcinoma of the Bladder
1.A soft-tissue mass in the base of the bladder with internal arterial flow.
2.The most likely diagnosis is transitional cell carcinoma (TCC).
3.Tumors on the posterior wall are easier to detect sonographically. Near-field reverberation artifact can obscure anterior wall masses.
4.TCC of the bladder typically occurs on the lateral and posterior wall and near the trigone.
Reference
Karcnik TJ, Simmons MZ, Abujudea HA: Ultrasound
imaging of the adult urinary bladder. Ultrasound Q
1999;15:135–147
Cross-Reference
Ultrasound: THE REQUISITES, 2nd ed, pp 175–177.
Comment
Bladder cancer is the 11th most common cancer in the world. It occurs in men three times more often than in women. At least 90% of bladder cancers are TCC. Less than 5% are squamous cell, and an even lower percentage are adenocarcinomas, small cell carcinomas, and sarcomas. Smoking predisposes to TCC and contributes to approximately half of the cases seen in men. Certain occupational exposures also seem to predispose to bladder cancer, including the dye, rubber, and aluminum industries. Excessive exposure to diesel exhaust and excessive consumption of phenacetin and acetaminophen are also associated with TCC of the bladder.
The majority of patients with bladder cancer present with hematuria. Less commonly, they will have voiding symptoms such as urgency, dysuria, and frequency. Flank pain may develop in the setting of ureteral obstruction. Rarely, patients present with symptoms related to metastatic disease to the liver, lung, or bones.
Sonography is very good at identifying bladder cancers, with a sensitivity and specificity of approximately 90%. However, most of these patients have cystoscopy done as the primary means of finding and quantifying bladder cancer. Nevertheless, it is very important to look carefully at the bladder in patients with hematuria since ultrasound may be the first study that documents a tumor. Sonography may also be useful in patients with bladder diverticulae, in whom it may be difficult to pass the cystoscope past the neck of the diverticulum.
In patients with hematuria, bladder cancer must be distinguished from solid clots in the bladder. This is usually easy since clots move with changes in patient position. Color Doppler is also valuable since tumors
often have detectable internal vascularity and clots do not. In men, an enlarged prostate may produce a mass that indents the base of the bladder and simulates a primary bladder mass. This situation should be suspected whenever the mass is located in the midline adjacent to the prostate. Occasionally, perivesicular tumors or perivesicular inflammatory processes involve the bladder wall and simulate a bladder tumor. Therefore, careful correlation with clinical history and careful analysis of perivesicular structures are important.
C A S E 2 1
Splenomegaly
1.Upper limit of normal for splenic length is 13 cm. Upper limit of normal for splenic thickness is 6 cm.
2.Flow in the splenic vein is reversed.
3.Reversal of splenic vein flow and splenomegaly are both due to portal hypertension.
4.The spleen normally does not extend below the left kidney.
Reference
Permutter GS: Ultrasound measurements of the spleen. In Goldberg BB, Kurtz AB (eds): Atlas of Ultrasound Measurements. Chicago, Year Book, 1990, pp 126–138.
Cross-Reference
Ultrasound: THE REQUISITES, 2nd ed, pp 209–211.
Comment
Detection of splenomegaly is usually accomplished via physical examination of the abdomen. However, in some patients, physical examination may be limited by factors such as obesity, pain, and marked ascites. It can also be difficult to distinguish an enlarged spleen from other left upper quadrant masses. In these patients, sonography can be very valuable. Not only can ultrasound evaluate the size of the spleen but also, in some patients, it can determine the cause of an enlarged spleen and exclude other processes.
Because the spleen is a curved, disk-shaped organ, it is somewhat difficult to measure in standard planes. One measurement that is relatively easy to obtain and to reproduce is the maximum splenic length. For spleens that are not long but are thick, the short-axis thickness of the spleen is also a valuable measurement. The short axis needs to be measured perpendicular to the long axis of the spleen.
24
C A S E 2 2
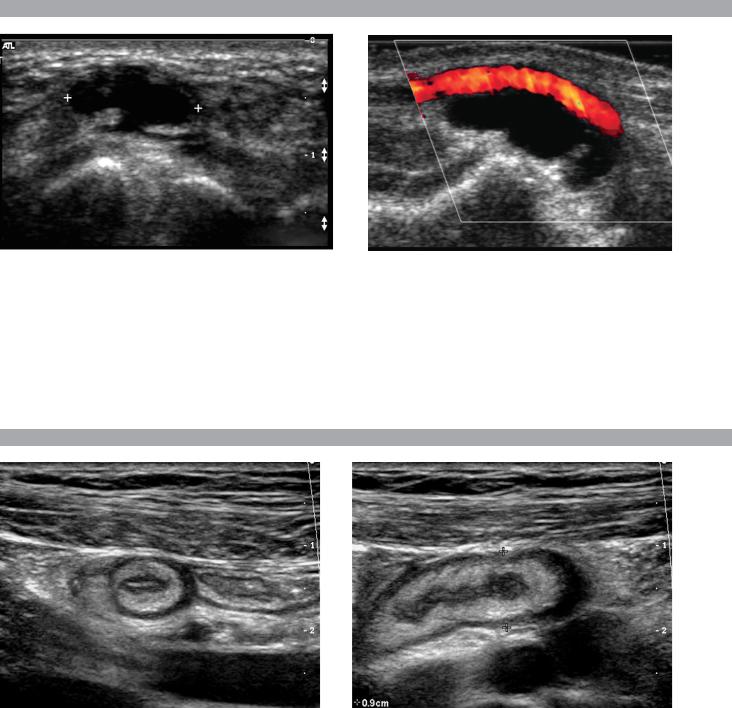
Longitudinal views of the neck between the thyroid cartilage and the hyoid bone from different patients with the same abnormality.
1.Is it common to see internal echoes in these lesions?
2.Is this a common location for this abnormality?
3.Is this lesion usually unilocular or multilocular?
4.Is this lesion likely to be cured with percutaneous aspiration?
C A S E 2 3
Pulsed Doppler waveforms from two arteries.
1.Would you characterize these waveforms as high or low resistance?
2.What arteries might display waveforms such as the ones shown in this case?
3.What causes the flow below baseline on the waveform on the left?
4.What is the resistive index of these waveforms?
25

A N S W E R S
C A S E 2 2
Thyroglossal Duct Cyst
1.The fluid within these cysts is usually complex appearing and internal echoes are common.
2.This is the classic location, between the thyroid cartilage and the hyoid bone.
3.Thyroglossal duct cysts are usually unilocular.
4.Aspiration will not cure a thyroglossal duct cyst. The cyst wall must be resected or it will recur.
References
Koeller KK, Alamo L, Adair CF, Smirniotopoulos JG:
From the archives of the AFIP: Congenital cystic
masses of the neck: Radiologic–pathologic correlation.
Radiographics 1999;19:121–146.
Cross-Reference
Ultrasound: THE REQUISITES, 2nd ed, pp 244–246.
Comment
Thyroglossal duct cysts are the most common of the congenital cysts of the neck. They arise along the tract of the thyroglossal duct. This tract extends from the foramen cecum at the base of the tongue to the hyoid bone and finally to the thyroid isthmus or to a pyramidal lobe. Normally, this tract involutes by the eighth week of fetal development. However, remnants of thyroid elements remain in approximately 5% of cases. These remnants can give rise to cysts, fistulae, or solid thyroid nodules. Histologically, the cyst wall is composed of squamous cell mucosa, although inflammatory changes may obscure this fact. Despite the pathogenesis, thyroid tissue is usually not detected on pathologic analysis of thyroglossal duct cysts. Thyroid cancer is even less common in these cysts (approximately 1%). When it occurs, it is usually papillary cancer.
Thyroglossal duct cysts typically manifest prior to age 10 years, although there is a second peak in the young adult years. They may be painful owing to hemorrhage or infection. However, many of these cysts are discovered as painless masses or as incidental findings on imaging studies done for other reasons. They are located in the midline, usually at the level of the hyoid bone (15%) or just below the level of the hyoid bone (65%). Cystic lesions in this location are almost always thyroglossal duct cysts. Only 20% of thyroglossal duct cysts are suprahyoid, and in this location they tend to be farther from the midline.
Unlike cysts elsewhere, thyroglossal duct cysts are usually not anechoic. Low-level internal echoes may be due to hemorrhage, infection, crystals, or proteinaceous material. Their usually intimate relationship to the hyoid bone is best seen on longitudinal scans (the hyoid bone is the echogenic shadowing structure at the superior
aspect of the cysts on these images). Although they are usually in the midline, slight pressure applied with the transducer can sometimes push them to one side or the other.
C A S E 2 3
High-Resistance Waveforms
1.Both of these waveforms are high-resistance-type waveforms.
2.High-resistance waveforms can arise from arteries that supply nonparenchymal structures, such as the extremities and the bowel. The first waveform came from the superficial femoral artery, and the second came from the radial artery.
3.The short phase of early diastolic flow reversal is caused by elastic recoil of the artery.
4.The resistive index (RI) is calculated as the difference of peak systole and end diastole divided by peak systole. The RI equals 1.0 whenever the end
diastolic flow is zero, as in the first image. In the second image, the RI equals (40 − 5)/40 = 0.88.
Reference
Nelson TR, Pretorius DH: The Doppler signal: Where does it come from and what does it mean? Am J Roentgenol 1988;151:439–447.
Cross-Reference
Ultrasound: THE REQUISITES, 2nd ed, pp 14–15, 293.
Comment
The waveforms shown in this case have very narrow and sharply pointed systolic peaks, rapid systolic deceleration into diastole, and little, if any, late diastolic flow. There is a short phase of early diastolic flow reversal seen on the first waveform. These are characteristics of a high-resistance waveform and typically come from vessels that supply nonparenchymal structures, such as the extremities. The first waveform is referred to as a triphasic pattern since there is a phase above the baseline, followed by a second phase below the baseline, followed by a third phase above the baseline. This is a classic appearance for an extremity artery. During systole, the vessel expands as the pressure increases. In early diastole, the elastic recoil properties of the vessel result in contraction of the lumen diameter. Resistance to forward flow is high enough that the majority of the blood filling the lumen is pushed backward during the period of elastic recoil, resulting in transient flow reversal. When the elastic recoil ceases, there is a short final phase of forward flow.
26
C A S E 2 4
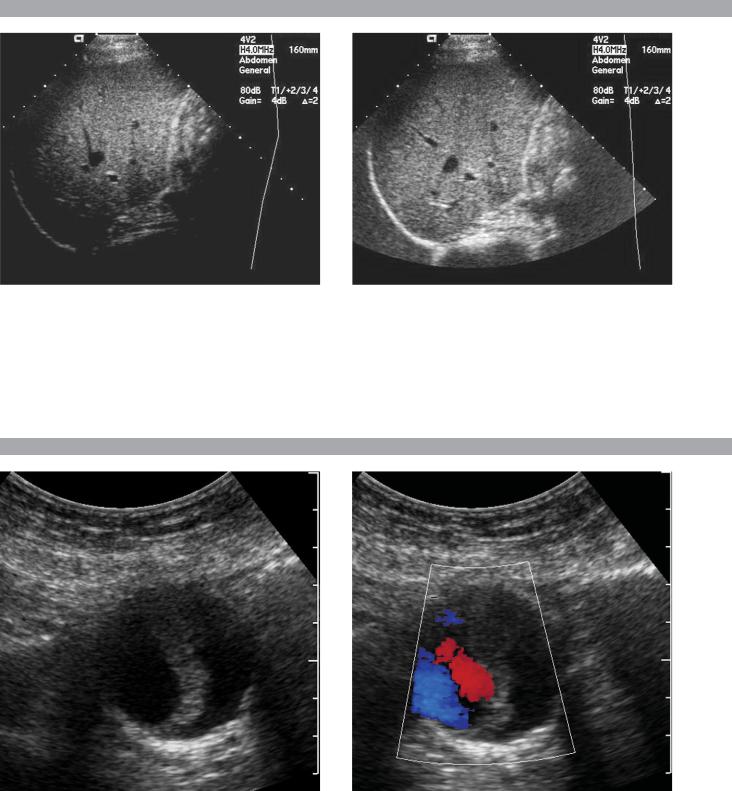
Transverse view of the dorsal surface of the wrist and longitudinal color Doppler view of the volar surface of the wrist in different patients with the same abnormality.
1.What is the most common cause of cystic lesions in the wrist?
2.Where do these lesions most often occur?
3.What are these lesions composed of?
4.What is the differential diagnosis?
C A S E 2 5
Transverse and longitudinal views of the right lower quadrant.
1.What is the sensitivity of ultrasound in making this diagnosis?
2.Is this diagnosis easier to make with ultrasound in children or in adults?
3.What are the sonographic criteria for this condition?
4.How do CT and ultrasound compare in evaluating patients suspected of having this condition?
27

A N S W E R S
C A S E 2 4
Ganglion Cyst of the Wrist
1.Ganglion cysts are the most common cause of cysts in the wrist and hand.
2.The most common location is the dorsal wrist, superficial to the scapholunate joint. On the first image, the surface of the scaphoid and the lunate are seen as strong linear reflections deep to the cyst. The space between the two bones is the scapholunate joint.
3.Very thick, gelatinous liquid.
4.Effusions of the joint or tendon sheaths. Ganglion cysts are more mass like and less compressible.
Reference
Middleton WD, Teefey SA, Boyer MI: Hand and wrist sonography. Ultrasound Q 2001;17:21–36.
Cross-Reference
Ultrasound: THE REQUISITES, 2nd ed, pp 286–288.
Comment
Ganglion cysts are the most common cause of palpable masses in the hand and wrist. They are most common in young women, although they can occur at any age and in both sexes. They manifest with either localized pain or a palpable mass.
There are four typical locations. Sixty percent to 70% occur over the dorsal wrist. Dorsal ganglia usually originate from the scapholunate joint. They may dissect proximally or distally. Twenty percent arise on the volar side of the wrist. Volar ganglia frequently extend around the flexor carpi radialis tendon or, as shown on the second image, the radial artery. They typically arise from one of the radiocarpal joints. The third most common location is along one of the flexor tendon sheaths of the fingers. These cysts account for 10% of ganglia. Finally, ganglia can arise from the interphalangeal joints, usually due to underlying degenerative arthritis. These cysts have also been called mucous cysts.
The appearance of ganglia on ultrasound is predictable. Like other fluid-containing structures, ganglia are typically anechoic with well-defined walls. Through transmission is usually detectable unless the cyst is small. Due to slice thickness artifact, small ganglia may also have low-level internal echoes. In some cases, a neck may be seen leading toward the joint of origin. With large ganglia, there are often folds or septations, particularly near the neck of the cyst.
Detection of a wrist ganglion is limited by the size and depth of the cyst. Small and deep ganglia are the most difficult to detect. Ruptured ganglion cysts may appear as predominantly solid masses and can also lead to a confusing appearance. Nevertheless, ultrasound
remains an excellent means of evaluating patients with a suspected ganglion cyst. Reported accuracy is similar to that of MRI.
C A S E 2 5
Acute Appendicitis
1.The sensitivity of ultrasound for the diagnosis of appendicitis is 75% to 90%. Positive predictive value ranges from 91% to 94%, and negative predictive value ranges from 89% to 97%.
2.Children are usually easier to diagnose than adults because they typically have less abdominal wall fat.
3.The criteria for appendicitis are identification of a blind ending, noncompressible bowel loop that arises from the cecum and measures 6 mm or more in diameter. Identification of an appendicolith and inflamed periappendiceal fat are helpful secondary signs. Color Doppler demonstration of mural or periappendiceal hypervascularity is also useful.
4.The success of CT and ultrasound in diagnosing appendicitis depends on institutional preference and local expertise. In general, radiologists probably do better with CT than with ultrasound. However, ultrasound is complementary to CT and is probably superior in thin patients.
Reference
Birnbaum BA, Wilson SR: Appendicitis at the millennium. Radiology 2000;215:337–348.
Cross-Reference
Ultrasound: THE REQUISITES, 2nd ed, pp 224–225.
Comment
In the Western world, acute abdominal pain requiring surgery is more commonly due to appendicitis than to any other condition. The peak incidence of appendicitis is in the second decade of life. The most common etiology is obstruction from a fecalith. This obstruction results in increased luminal pressure and eventually in ischemia. Compromised mucosa subsequently becomes infected with luminal bacteria. Ongoing infection, ischemia, and infarction may lead to perforation.
Classic presentation is of vague lower abdominal pain, nausea, and vomiting, followed by more discrete right lower quadrant pain. Patients are usually afebrile or have a low-grade fever. Accuracy for clinical diagnosis of appendicitis is approximately 80%. Accuracy is lower in women of childbearing age owing to the clinical overlap of acute gynecologic disease and acute appendicitis.
28
C A S E 2 6
Two views of the liver.
1.Why is the deep aspect of the liver so hypoechoic on the first image?
2.What is the difference between gain and power?
3.Should image brightness be controlled first with gain or with power?
4.Are gain and power preprocessing or postprocessing controls?
C A S E 2 7
Transverse gray-scale and color Doppler view of the aorta.
1.Should surgery be considered in this patient?
2.What important information should be obtained when scanning a patient such as this one?
3.What is the significance of the hypoechoic crescent within the mural thrombus?
4.Is color Doppler necessary?
29

A N S W E R S
C A S E 2 6
Distance Gain Compensation Curve
1.The distance gain compensation curve is inappropriately adjusted on the first image. Increased gain settings were applied to the far field on the second image, and the liver appears normal throughout.
2.Power refers to the strength of the sound pulse that is transmitted by the transducer. Gain refers to the amount of electronic amplification of the signal that returns to the transducer.
3.Increasing the power and the gain both result in brighter images; however, increased power causes greater patient exposure and can cause artifacts. Therefore, it is best to increase power only when an optimal image cannot be obtained first with adjustment of gain.
4.Preprocessing refers to controls that must be adjusted in real time while the patient is being scanned. Postprocessing refers to controls that can be adjusted on a frozen image. Gain and power are both preprocessing controls.
Reference
Zwiebel WJ: Image optimization, ultrasound artifacts, and safety considerations. In Zwiebel WJ, Sohaey R (eds):
Introduction to Ultrasound. Philadelphia, Saunders, 1998, pp 18–30.
Cross-Reference
Ultrasound: THE REQUISITES, 2nd ed, pp 10–12.
Comment
As sound travels through tissue, it undergoes a number of interactions. The interactions that allow an image to be created are reflection and scattering. In addition, sound is absorbed by the tissues. These interactions cause attenuation of the sound pulse as it passes through tissue. Since the transmitted pulse and the reflected pulse both become weaker as they travel through the tissues, identical reflectors located in the near field and in the far field produce echoes of different strengths. To compensate for this, pulses that have traveled farther are electronically amplified after they return to the transducer. This process is called distance compensation, and it is displayed on the image as a curve, called the distance gain compensation (DGC) curve. On the images shown, the DGC curve appears as a line on the right side of the image that extends from the near field to the far field. On the second image, the curve slopes progressively to the right as it goes from the near to the far field. This indicates steady progressive amplification of the echoes returning from the far field. In the first image, the DGC curve tapers back to the left in the far field, indicating decreased amplification of the far field echoes.
For homogeneous structures such as the liver that attenuate sound uniformly, the DGC curve should have a fairly constant upslope. When fluid-filled structures such as the bladder are scanned, there is negligible attenuation, so the DGC curve does not need to provide compensation until the solid structures deep to the bladder are encountered.
C A S E 2 7
Abdominal Aortic Aneurysm
1.Surgery should be considered when an aneurysm reaches 5 cm in diameter since the cumulative risk of rupture during the next 8 years is 25%.
2.It is important to measure the diameter of the aneurysm and to determine where it starts and stops with respect to the renal arteries and the aortic bifurcation.
3.The crescent indicates liquefied clot. It does not indicate dissection, rupture, or impending rupture.
4.Color Doppler is rarely needed in the evaluation of an aortic aneurysm.
Reference
Nevitt MP, Ballard DJ, Hallett JW Jr: Prognosis of abdominal aortic aneurysms: A population based study. N Engl J Med 1989;321:1009–1014.
Cross-Reference
Ultrasound: THE REQUISITES, 2nd ed, pp 233–236.
Comment
Abdominal aortic aneurysms are a common abnormality, especially in elderly men, with 95% occurring below the level of the renal arteries. They are strongly associated with atherosclerosis. An aneurysm is present when there is a focal dilatation of the aorta that measures 3 cm or more in diameter. Aneurysms should be measured from the outer wall to the outer wall. Anterior-to-posterior measurements are obtained from sagittal views, and transverse measurements are obtained from a left coronal view. Measurements in the axial view should be avoided since it is not possible to determine whether such measurements are taken perpendicular to the long axis of the aorta, and the lateral borders of the aorta are not well seen. In addition, axial measurements are prone to greater interobserver and intraobserver variability.
30
C A S E 2 8
Two views of the liver in a patient with a history of lung cancer.
1.Are the lesions shown in this case most likely solid or cystic?
2.What is the most likely diagnosis?
3.What else should be considered?
4.How can the diagnosis be confirmed?
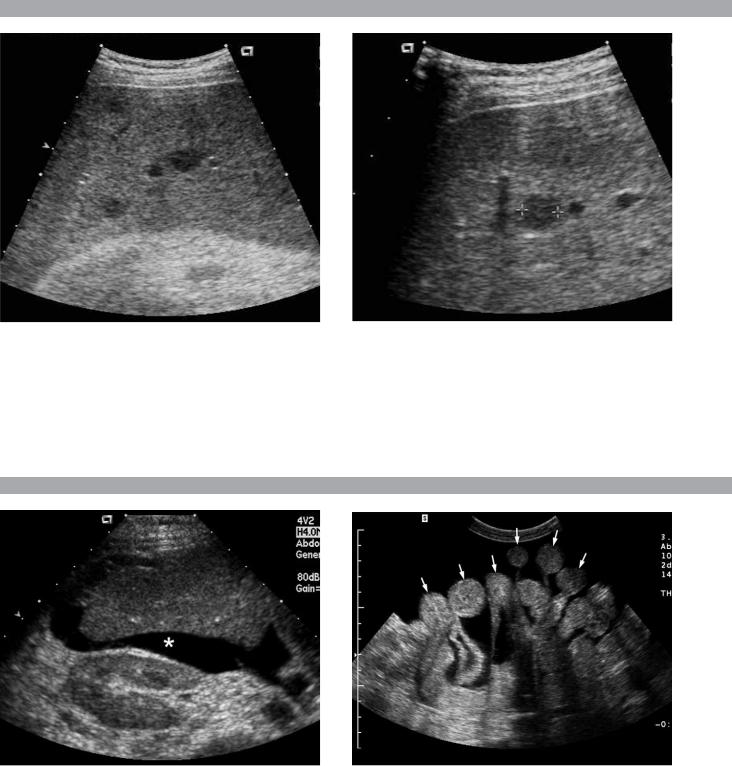
C A S E 2 9
Transverse view of the right upper quadrant and the left lower quadrant in different patients.
1.What do these patients have in common?
2.To what are the arrows pointing?
3.In what anatomic location is the asterisk positioned?
4.Where are the best places to look when searching for this abnormality?
31