

24517-16
.pdfAdvanced
Differential
Pressure
Flowmeter
Technology
V-CONE FLOW METER TECHNICAL BRIEF
Table of Contents
Section 1 - General
Section Page
Introduction |
1.1 |
1 |
Principles Of Operation |
1.2 |
1 |
Reshaping The Velocity Profile |
1.3 |
1 |
Section 2 - Features |
|
|
High Accuracy |
2.1 |
2 |
Repeatability |
2.2 |
2 |
Turndown |
2.3 |
2 |
Installation Requirements |
2.4 |
3 |
Long Term Performance |
2.5 |
3 |
Signal Stability |
2.6 |
3 |
Low Permanent Pressure Loss |
2.7 |
3 |
Sizing |
2.8 |
4 |
No Areas of Stagnation |
2.9 |
4 |
Mixing |
2.10 |
4 |
V-Cone Flow Meter Models |
2.11 |
4 |
Section 3 - The V-Cone Flow Meter |
|
|
Measurement System |
|
|
Application Data |
3.1 |
5 |
Flow Calculations |
3.2 |
5 |
Simplified Liquid Calculations |
3.3 |
7 |
Application Sizing |
3.4 |
8 |
Calibration |
3.5 |
8 |
Materials Of Construction |
3.6 |
8 |
Valve Manifolds |
3.7 |
8 |
Secondary And Tertiary Instrumentation |
3.8 |
9 |
Appendices |
|
|
V-Cone flow meter Installation Guide Upstream and |
|
10 |
Downstream Minimum Straight Pipe Run Requirements |
|
|
for Gas Metering at a Reynolds Number (Re) Value > |
|
|
200,000 |
|
|
V-Cone flow meter Installation Guide Upstream and |
|
11 |
Downstream Minimum Straight Pipe Run Requirements |
|
|
for Liquid Metering and Gases at a Reynolds Number |
|
|
(Re) Value Less Than or Equal To 200,000 |
|
|
Warranty |
|
12 |

1.0
General
1.1 Introduction
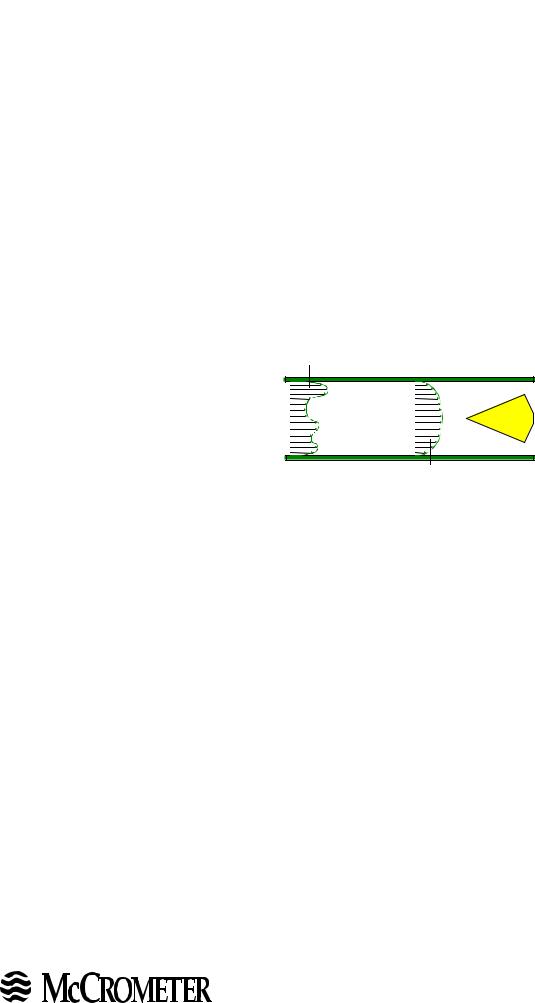
The McCrometer V-Cone® Flow meter is a patented technology that accurately measures flow over a wide range of Reynolds numbers, under all kinds of conditions and for a variety of fluids. It operates on the same physical principle as other differential pressure-type flowmeters, using the theorem of conservation of energy in fluid flow through a pipe. The V Cone’s remarkable performance characteristics, however, are the result of its unique design. It features a centrallylocated cone inside the tube. The cone interacts with the fluid flow, reshaping the fluid’s velocity profile and creating a region of lower pressure immediately downstream of itself. The pressure difference, exhibited between the static line pressure and the low pressure created downstream of the cone, can be measured via two pressure sensing taps. One tap is placed slightly upstream of the cone, the other is located in the downstream face of the cone itself. The pressure difference can then be incorporated into a derivation of the Bernoulli equation to determine the fluid flow rate. The cone’s central position in the line optimizes the velocity profile of the flow at the point of measurement, assuring highly accurate, reliable flow measurement regardless of the condition of the flow upstream of the meter.
1.2 |
Principles Of Operation |
|
|
|
|
|
|
|
|
|
|
|
|
|
|
|
|
|
|
|
|
|
|
|
|
|
|
|
|
The |
V-Cone flow meter is a differential pressure |
type |
|
|
|
|
|
|
Dp |
|
|
|
|
|
|
|
|
||||||||||||
|
|
|
|
|
|||||||||||||||||||||||||
|
P1 |
P2 |
|||||||||||||||||||||||||||
|
|
|
|
|
|
|
|||||||||||||||||||||||
flowmeter. Basic theories behind differential pressure |
|
|
|
|
|
|
|
||||||||||||||||||||||
|
|
|
|
|
|
|
|
|
|
|
|
|
|
|
|
|
|
|
|
|
|
|
|||||||
type flowmeters have existed for over a century. |
The |
|
|
|
|
|
|
|
|
|
|
|
|
|
|
|
|
|
|
|
|
|
|
|
|||||
|
|
|
|
|
|
|
|
|
|
|
|
|
|
|
|
|
|
|
|
|
|
|
|||||||
principal theory among these is Bernoulli’s theorem for the |
|
|
|
|
|
|
|
|
|
|
|
|
|
|
|
|
|
|
|
|
|
Low |
|||||||
|
|
|
|
|
|
|
|
|
|
|
|
|
|
|
|
|
|
|
|||||||||||
|
|
|
|
|
|
|
|
|
|
|
|
|
|
|
|
|
|
|
|
|
|
|
|
|
|
|
|
Pressure |
|
conservation of energy in a closed pipe. This states that for a |
|
|
|
|
|
|
|
|
|
|
|
|
|
|
|
|
|
|
|
||||||||||
|
|
|
|
|
|
|
|
|
|
|
|
|
|
|
|
|
|
|
|
|
Port |
||||||||
|
|
|
|
|
|
|
|
|
|
|
|
|
|
|
|
|
|
|
|
|
|||||||||
constant flow, the pressure in a pipe is inversely proportional |
|
|
|
|
|
|
|
|
|
|
|
|
|
|
|
|
|
|
|
|
|
||||||||
|
|
|
|
|
|
|
|
|
|
|
|
|
|
|
|
|
|
|
|
|
|
|
|||||||
|
|
|
|
|
|
|
|
|
|
|
|
|
|
|
|
|
|
|
|
|
|
|
|||||||
to the square of the velocity in the pipe. Simply, the pressure |
|
|
|
|
|
|
|
|
|
|
|
|
|
|
|
|
|
|
|
|
|
|
|
||||||
|
|
|
|
|
|
|
|
|
|
|
|
|
|
|
|
|
|
|
|
|
|
|
|||||||
|
|
High and Low Ports |
|||||||||||||||||||||||||||
decreasesasthevelocityincreases. Forinstance,asthefluid |
|
|
|||||||||||||||||||||||||||
approaches the V-Cone flow meter, it will have a pressure of |
|
|
|
|
|
|
|
|
|
|
Figure 1 |
||||||||||||||||||
P1. As the fluid velocity increases at the constricted area of the V Cone, the pressure drops to P2, as shown in Figure 1.
Both P1 and P2 are measured at the V-Cone flow meter’s taps using a variety of differential pressure transducers. The Dp created by a V-Cone flow meter will increase and decrease exponentially with the flow velocity. As the constriction takes up more of the pipe cross-sectional area, more differential pressure will be created at the same flowrates. The beta ratio equals the flow area at the largest cross section of the cone (converted to an equivalent diameter) divided by the meter’s inside diameter (see 3.2.1).
1.3 Reshaping The Velocity Profile
The V-Cone flow meter is similar to other differential pressure (Dp) |
Zero Velocity |
|
|
|
|
|
|
||||
|
|
|
|
|
|
|
|
|
|
|
|
meters in the equations of flow that it uses. V-Cone flow meter |
|
|
|
|
|
|
|
|
|
|
|
|
|
|
|
|
|
|
|
|
|
|
|
|
|
|
|
|
|
|
|
|
|
|
|
geometry, however, is quite different from traditional Dp meters. The |
|
|
|
|
|
|
|
|
|
|
|
|
|
|
|
|
|
|
|
|
|
|
|
V Cone constricts the flow by positioning a cone in the center of the |
|
|
|
|
|
|
|
|
|
Maximum |
|
|
|
|
|
|
|
|
|
|
|||
pipe. |
Fluid |
|
|
|
|
|
|||||
|
|
|
|||||||||
|
Velocity |
|
|
|
|
|
|
|
|
Velocity |
|
|
|
|
|
||||||||
This forces the flow in the center of the pipe to flow around the cone. This geometry presents many advantages over the traditional concentric Dp meter. The actual shape of the cone has been continuously evaluated and tested for over ten years to provide the best performance under differing circumstances.
Velocity Profile
Figure 2
Onemustunderstandtheideaofaflowprofileinapipetounderstand
the performance of the V-Cone flow meter. If the flow in a long pipe is not subject to any obstructions or disturbances, it is well-developed flow. If a line passes across the diameter of this well-developed flow, the velocity at each point on that line would be different. The velocity would be zero at the
1
3255WESTSTETSONAVENUE•HEMET,CALIFORNIA92545USA
TEL:951-652-6811•800-220-2279•FAX:951-652-3078 PrintedInTheU.S.A. Lit.#24517-16Rev.3.9/06-11
Copyright © 1992-2011 McCrometer, Inc. All printed material should not be changed or altered without permission of McCrometer. Any
www.mccrometer.com published technical data and instructions are subject to change without notice. Contact your McCrometer representative for current technical data and instructions.
wall of the pipe, maximum at the center of the pipe, and zero again at the opposite wall. This is due to friction at the pipe walls that slows the fluid as it passes. Since the cone is suspended in the center of the pipe, it interacts directly with the “high velocity core” of the flow. The cone forces the high velocity core to mix with the lower velocity flows closer to the pipe walls. Other Dp meters have centrally located openings and do not interact with this high velocity core. This is an important advantage to the V Cone at lower flowrates. As the flowrate decreases, the V Cone continues to interact with the highest velocity in the pipe. Other Dp meters may lose their useful Dp signal at flows where the V Cone can still produce one.
The pipe flow profile in actual installations is rarely ideal. There are many installations where a flowmeter exists in flow that is not well developed. Practically any changes to the piping, such as elbows, valves, reductions, expansions, pumps, and tees can disturb well-developed flow. Trying to measure disturbed flow can create substantial errors for other flowmeter technologies. The V-Cone flow meter overcomes this by reshaping the velocity profile upstream of the cone. This is a benefit derived from the cone’s contoured shape and position in the line. As the flow approaches the cone, the flow profile “flattens” toward the shape of a well-developed profile.
Irregular profile
caused by a disturbance upstream
Flattenedprofileprofile caused by the caused by the
V-Cone flow meter.
V-Cone
2.0
Features
Flattened Velocity Profile
Figure 3
The V-Cone flow meter can flatten the flow profile under extreme conditions, such as a single elbow or double elbows out-of-plane, positioned closely upstream of the meter. This means that as different flow profiles approach the cone, there will always be a predictable flow profile at the cone. This ensures accurate measurement even in non-ideal conditions.
2.1 High Accuracy
The V-Cone flow meter primary element can be accurate to ±0.5% of reading and the WaferCone® can be accurate to ±1.0%. The level of accuracy is dependent to a degree on application parameters and secondary instrumentation.
2.2 Repeatability
The V-Cone flow meter and the Wafer-Cone flow meter primary element exhibits excellent repeatability of ±0.1% or better.
2.3 Turndown
The turndown of the V-Cone flow meter can reach far beyond traditional Dp meters. A typical turndown for a V-Cone flow meter is 10 to 1. Greater turndowns are attainable. Flows with Reynolds numbers as low as 8000 will produce a linear signal. Lower Reynolds number ranges are measurable and are repeatable by applying a curve fit to the measured Dp, derived from calibration over a specific Reynolds number range.
2
3255WESTSTETSONAVENUE•HEMET,CALIFORNIA92545USA
TEL:951-652-6811•800-220-2279•FAX:951-652-3078 PrintedInTheU.S.A. Lit.#24517-16Rev.3.9/06-11
Copyright © 1992-2011 McCrometer, Inc. All printed material should not be changed or altered without permission of McCrometer. Any
www.mccrometer.com published technical data and instructions are subject to change without notice. Contact your McCrometer representative for current technical data and instructions.
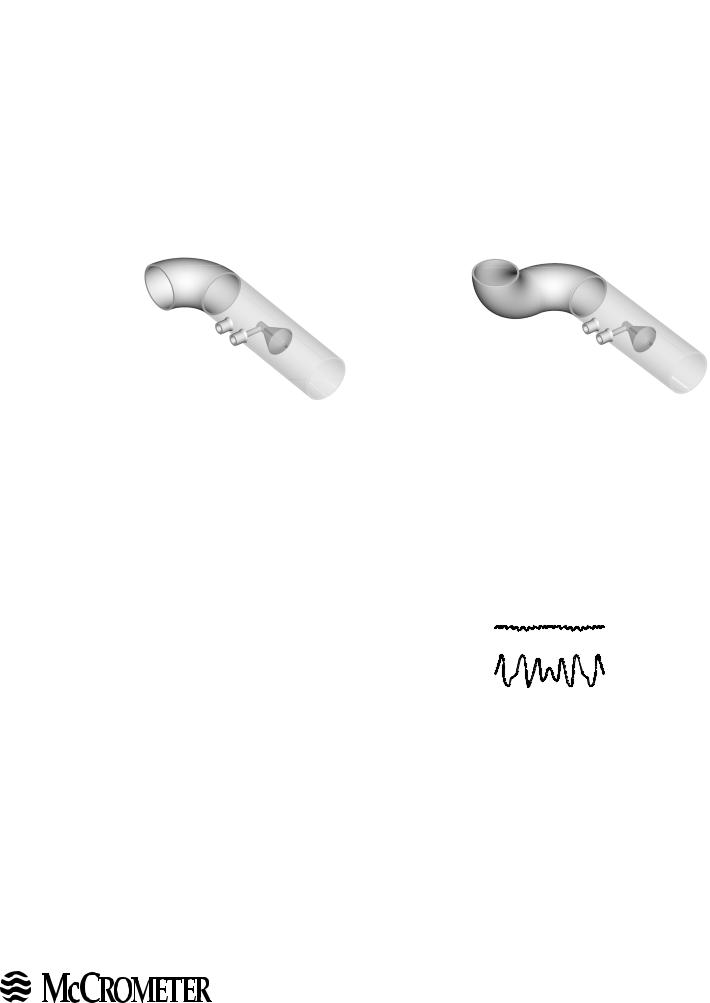
2.4 Installation Requirements
Since the V-Cone flow meter can flatten the velocity profile, it can function much closer to upstream disturbances than other Dp meters.The recommended installation for the V-Cone flow meter is zero to three diameters of straight run upstream and zero to one diameters downstream. This can be a major benefit to users with larger, more expensive line sizes or users which have small run lengths.
McCrometer conducted performance tests of the V Cone downstream of a single 90° elbow and two close coupled 90° elbows out of plane. These tests show that the V-Cone flow meter can be installed adjacent to either single elbows or two elbows out of plane without sacrificing accuracy. For specific installation recommendations, see appendices.
Single Elbow and |
Double Elbow and |
V-Cone flow meter |
V-Cone Flow Meter |
Figure 4 |
Figure 5 |
2.5 Long Term Performance
The contoured shape of the cone constricts the flow without impacting the flow against an abrupt surface.Aboundary layer forms along the cone and directs the fluid away from the beta edge. This means the beta edge will not be as subject to the usual wear by unclean fluids, as is the case with an orifice plate. The beta ratio will then remain unchanged and the calibration of the meter will be accurate for a much longer time.
2.6 Signal Stability
Every Dp meter has a “signal bounce”. This means that even in steady flow, the signal generated by the primary element will fluctuate a certain amount. On a typical orifice plate, the vortices that form just after the plate are
long. These long vortices create a high amplitude, low frequency signal from the orifice plate. This could disturb the Dp readings from the meter. The V Cone forms very short vortices as the flow passes the cone. These short vortices create a low amplitude, high frequency signal.
This translates into a signal with high stability from the
V Cone. Representative signals from a V-Cone flow meter and from a typical orifice plate are shown in figure 6.
2.7 Low Permanent Pressure Loss
V-Cone
Flow Meter
Orifice Plate
Signal Stability
Figure 6
Without the impact of an abrupt surface, the permanent pressure loss is lower than a typical orifice plate meter. Also, the signal stability of the V-Cone flow meter allows the recommended full scale Dp signal to be lower for the V-Cone flow meter than other Dp meters. This will lower the permanent
3
3255WESTSTETSONAVENUE•HEMET,CALIFORNIA92545USA
TEL:951-652-6811•800-220-2279•FAX:951-652-3078 PrintedInTheU.S.A. Lit.#24517-16Rev.3.9/06-11
Copyright © 1992-2011 McCrometer, Inc. All printed material should not be changed or altered without permission of McCrometer. Any
www.mccrometer.com published technical data and instructions are subject to change without notice. Contact your McCrometer representative for current technical data and instructions.
pressure loss.
2.8 Sizing
The unique geometry of the V-Cone flow meter allows for a wide range of beta ratios. Standard beta ratios range from 0.45, 0.55, 0.65, 0.75, and 0.80.
2.9 No Areas of Stagnation
The “swept through” design of the cone does not allow for areas of stagnation where debris, condensation or particles from the fluid could accumulate.
2.10 Mixing
The short vortices described in section 2.6 mix the fluid thoroughly just downstream of the cone. The V-Cone flow meter is currently used in many applications as a static mixer where instant and complete mixing are necessary.
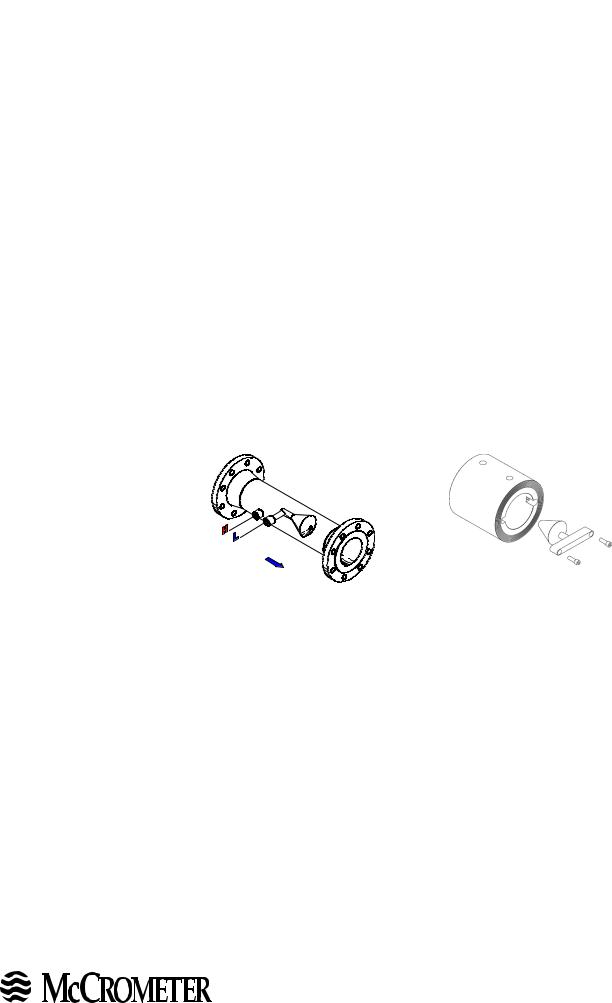
2.11 V-Cone Flow Meter Models
McCrometer offers two types of V-Cone flow meter primary elements: the precision tube V-Cone and the Wafer-Cone flow meters. Precision tube V-Cone flow meters range in line sizes from ½” to 72” and larger and Wafer-Cone flow meters range from 1” to 6”.
Precision Tube |
Wafer-Cone Flow Meter |
V-Cone Flow Meter |
Figure 8 |
Figure 7 |
|
4
3255WESTSTETSONAVENUE•HEMET,CALIFORNIA92545USA
TEL:951-652-6811•800-220-2279•FAX:951-652-3078 PrintedInTheU.S.A. Lit.#24517-16Rev.3.9/06-11
Copyright © 1992-2011 McCrometer, Inc. All printed material should not be changed or altered without permission of McCrometer. Any
www.mccrometer.com published technical data and instructions are subject to change without notice. Contact your McCrometer representative for current technical data and instructions.
3.0
The V-Cone Flow Meter Measurement System
3.1 Application Data
The customer must provide application parameters so that the appropriate V-Cone flow meter may be selected. McCrometer has an extensive meter performance database of fluid properties which can be utilized for sizing purposes.
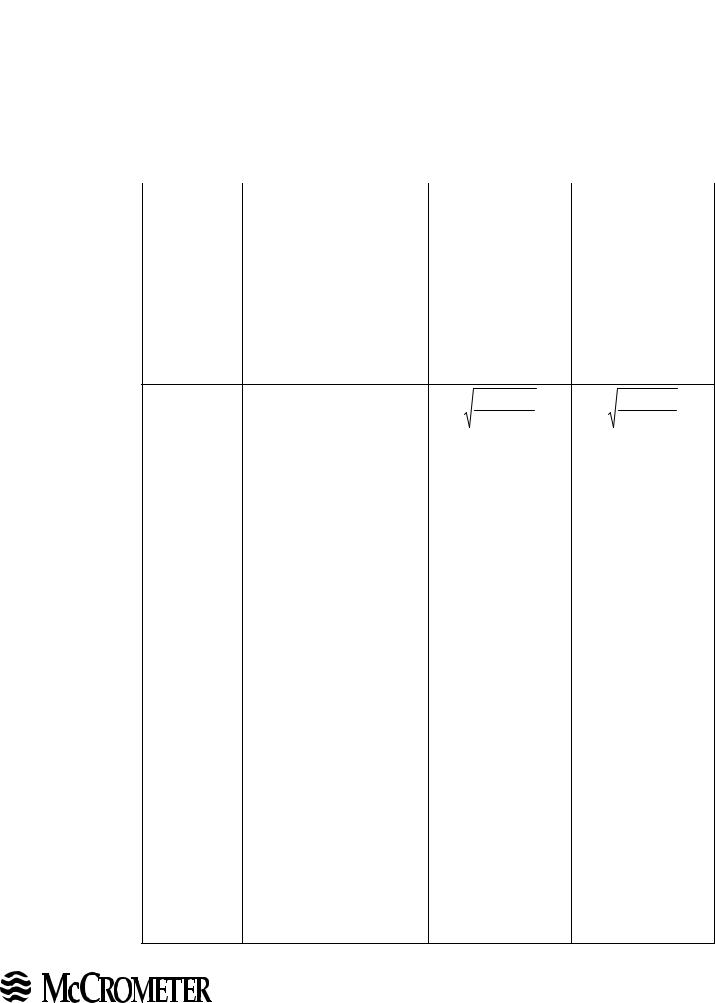
3.2 Flow Calculations
Nomenclature (All references to “V-Cone” are to the V-Cone flow meter.)
Symbol |
Description |
English Units |
Metric Units |
|
α |
Material Thermal Expansion α |
°R-1 |
°R-1 |
|
|
or αcone, αpipe (alpha) |
|
|
|
β |
Beta Ratio |
- |
- |
|
CD |
Flowmeter Coefficient |
- |
- |
|
d |
Cone Outside Diameter |
in |
mm |
|
D |
Pipe Inside Diameter |
in |
mm |
|
P |
Differential Pressure (dp) |
inWC |
mbar |
|
Pmax |
Maximum Differential |
See note 4 |
See note 4 |
|
Pressure on Sizing |
||||
|
|
|
||
Fa |
Material Thermal Expansion |
- |
- |
|
Factor |
||||
|
|
|
||
k |
Gas Isentropic Exponent |
- |
- |
k1 |
Flow Constant |
lbm ft3 |
kg m3 |
|
s2 inWC |
s2 mbar |
|||
|
|
|||
k2 |
Simplified Liquid Flow |
See note 4 |
See note 4 |
|
Constant |
||||
|
|
|
||
μ |
Viscosity |
cP |
cP |
|
P |
Operating Pressure |
psiA |
barA |
|
Pb |
Base Pressure |
psiA |
barA |
|
Q |
Actual Volume Flow |
ACFS |
m3/s |
|
Qmax |
Maximum Flowrate on Sizing |
See note 4 |
See note 4 |
|
QSTD |
Standard Gas Volume Flow |
SCFS |
Nm3/s |
|
Re |
Reynolds Number |
- |
- |
|
ρ |
Flowing Density (rho) |
lbm/ft3 |
kg/m3 |
|
ρwater |
Water Density |
62.3663 lbm/ft3 |
999.012 kg/m3 |
|
Sg |
Specific Gravity of the Gas |
- |
- |
|
SL |
Specific Gravity of the Liquid |
- |
- |
|
T |
Operating Temperature |
°R |
K |
|
Tb |
Base Temperature |
°R |
K |
|
|
Deviation from Standard |
Td = T − 527.67 |
9 |
|
Td |
Temperature (°R) |
Td = 5T − 527.67 |
||
U1 |
Unit Conversion |
0.0360912 psiA/inWC |
0.001 barA/mbar |
|
U2 |
Unit Conversion |
144 in2/ft2 |
1,000,000 mm2/m2 |
|
U3 |
Unit Conversion |
167.213 lbm /s2 ft |
100 kg/m s2 mbar |
|
|
|
inWC |
|
|
|
|
|
|
|
U4 |
Unit Conversion |
124.0137 cP ft s / lbm |
1 |
|
U5 |
Unit Conversion |
2.6988 °R lbm / ft3 |
348.338 K kg / m3 |
|
psiA |
barA |
|||
|
|
|||
|
|
|
|
|
v |
Velocity |
ft/s |
m/s |
|
Y |
Gas Expansion Factor |
- |
- |
|
Z |
Gas Compressibility |
- |
- |
|
Zb |
Base Gas Compressibility |
- |
- |
5
3255WESTSTETSONAVENUE•HEMET,CALIFORNIA92545USA
TEL:951-652-6811•800-220-2279•FAX:951-652-3078 PrintedInTheU.S.A. Lit.#24517-16Rev.3.9/06-11
Copyright © 1992-2011 McCrometer, Inc. All printed material should not be changed or altered without permission of McCrometer. Any
www.mccrometer.com published technical data and instructions are subject to change without notice. Contact your McCrometer representative for current technical data and instructions.
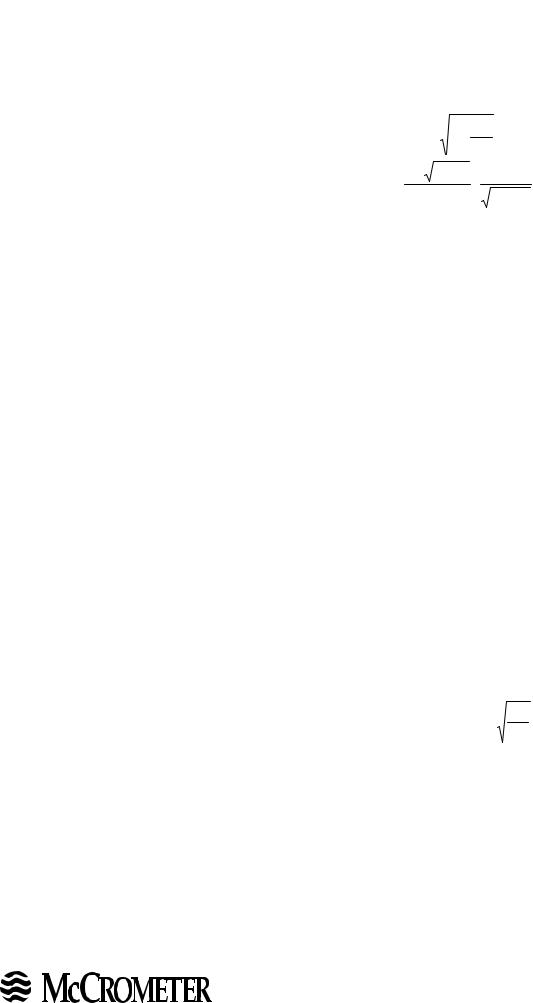
General Flow Calculations (All references to “V-Cone” are to the V-Cone flow meter.)
3.2.1 |
V-Cone Beta |
|
|
|
|
|
|
|
|
|
|
|
d2 |
|
|
|
β from sizing |
||
Ratio |
|
|
|
|
β = |
|
1− D2 |
|
|
|
report |
||||||||
|
|
|
|
|
|
|
|
|
|||||||||||
3.2.2 |
Flow |
|
|
|
k1 = |
π |
2 U |
3 |
|
D2 |
β 2 |
|
|
||||||
|
|
|
4 U2 |
|
|
|
1− β 4 |
|
|
||||||||||
|
Constant |
|
|
|
|
|
|
|
|
|
|
||||||||
|
Material |
|
|
|
|
|
|
|
|
|
|
|
|
|
|
|
|
|
|
3.2.3 |
Thermal |
|
|
|
|
Fa |
= 1+ 2 α Td |
|
See note 1. |
||||||||||
Expansion |
|
|
|
|
|
||||||||||||||
|
Factor |
|
|
|
|
|
|
|
|
|
|
|
|
|
|
|
|
|
|
|
Material |
|
|
|
|
|
|
|
|
|
|
|
|
|
|
|
|
|
|
|
Thermal |
|
|
|
|
|
|
|
|
|
|
|
|
|
|
|
|
|
|
|
Expansion |
|
|
|
|
|
|
|
D2 |
− d2 |
|
|
|
|
|||||
|
Factor |
Fa |
= |
|
|
|
|
|
|
|
|
|
|||||||
3.2.4 |
If cone and |
[(1 |
− α pipe Td ) D]2 |
− [(1− αcone Td ) d]2 |
See note 1. |
||||||||||||||
|
main pipe are |
|
|
|
|||||||||||||||
|
made of |
|
|
|
|
|
|
|
|
|
|
|
|
|
|
|
|
|
|
|
different |
|
|
|
|
|
|
|
|
|
|
|
|
|
|
|
|
|
|
|
materials |
|
|
|
|
|
|
|
|
|
|
|
|
|
|
|
|
|
|
3.2.5 |
Pipeline |
|
|
|
|
v |
= |
4 U2 Q |
|
|
|
|
|||||||
Velocity |
|
|
|
|
|
π D2 |
|
|
|
|
|
|
|||||||
|
|
|
|
|
|
|
|
|
|
|
|
|
|
|
|
|
|
|
Dimensionless |
|
Reynolds |
|
|
|
|
|
|
|
|
v D ρ |
|
number which |
|||||||
3.2.6 |
|
|
|
|
Re = U4 |
|
can be used to |
||||||||||||
Number |
|
|
|
|
|
|
|
μ |
|
|
|
correlate meter |
|||||||
|
|
|
|
|
|
|
|
|
|
|
|
|
|
|
|||||
|
|
|
|
|
|
|
|
|
|
|
|
|
|
|
|
|
|
|
calibration in |
|
|
|
|
|
|
|
|
|
|
|
|
|
|
|
|
|
|
|
different fluids |
3.2.7 |
V-Cone Gas |
|
|
Y = 1− (0.649+ 0.696 β |
4 )U1 |
P |
For Liquids Y = 1 |
||||||||||||
Expansion |
|
|
|||||||||||||||||
|
Factor |
|
|
|
|
|
|
|
|
|
|
|
|
|
|
|
k P |
|
|
3.2.8 |
Wafer Gas |
|
|
Y = 1− (0.755+ 6.78 β 8 )U1 |
P |
For Liquids Y = 1 |
|||||||||||||
Expansion |
|
|
|||||||||||||||||
|
Factor |
|
|
|
|
|
|
|
|
|
|
|
|
|
|
|
k P |
|
|
3.2.9 |
Liquid Density |
|
|
|
|
ρ = ρwater SL |
|
|
|
|
|||||||||
3.2.10 |
Gas Density |
|
|
|
|
ρ = U5 |
|
Sg P |
|
|
|
|
|||||||
|
|
|
|
|
|
Z T |
|
|
|
|
|
||||||||
3.2.11 |
Actual |
|
|
|
Q = Fa CD Y |
k1 |
|
P |
|
See notes 2, 3 & |
|||||||||
Volume |
|
|
|
ρ |
|
5 |
|||||||||||||
|
Flowrate |
|
|
|
|
|
|
|
|
|
|
|
|
|
|
|
|||
|
Standard Gas |
|
|
|
|
|
|
|
|
P |
|
|
|
|
|
|
Converts actual |
||
|
|
|
|
|
|
|
|
|
|
|
|
|
flow to standard |
||||||
|
|
|
|
|
QSTD = Q |
|
Tb Zb |
|
|||||||||||
3.2.12 |
Volume |
|
|
|
|
|
|
|
|
|
|
|
|
|
flow at base |
||||
|
|
|
|
|
|
|
|
|
|
|
|||||||||
|
Flowrate |
|
|
|
|
|
|
|
|
|
Pb T Z |
|
|||||||
|
|
|
|
|
|
|
|
|
|
|
|
|
|
|
|
|
|
|
conditions |
6
3255WESTSTETSONAVENUE•HEMET,CALIFORNIA92545USA
TEL:951-652-6811•800-220-2279•FAX:951-652-3078 PrintedInTheU.S.A. Lit.#24517-16Rev.3.9/06-11
Copyright © 1992-2011 McCrometer, Inc. All printed material should not be changed or altered without permission of McCrometer. Any
www.mccrometer.com published technical data and instructions are subject to change without notice. Contact your McCrometer representative for current technical data and instructions.
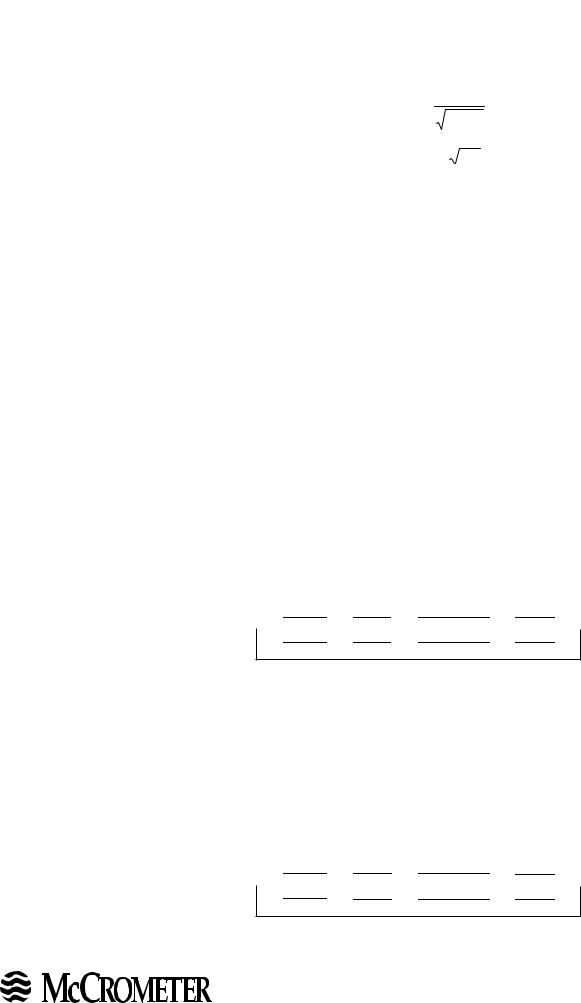
3.3 Simplified Liquid Calculation |
|
|
|
|
||
|
|
|
|
|
|
|
|
Simplified |
|
k2 = |
Qmax |
|
|
3.3.1 |
Liquid Flow |
|
|
Pmax |
See note 4 |
|
|
Constant |
|
|
|
|
|
|
Simplified |
|
Q = k2 |
P |
See note 4 |
|
3.3.2 |
Liquid |
|
||||
|
Flowrate |
|
|
|
|
|
Notes:
1. MaterialThermalExpansion–Thethermalexpansionequationscorrectfordimensionalchanges which occur as the operating temperature deviates from the base temperature of 68° F (see 3.2.3 and 3.2.4) The Fa factor can be excluded from the flow equation if the operating temperature is:
< 100° Fahrenheit , < 559.67° Rankine , < 37.78° Celsius, < 310.93 K.
If the Fa factor is significant and the operating temperature is stable then a constant Fa value can be used. If the Fa factor is significant and the temperature varies then an Fa factor should be calculated prior to every flow calculation.
2.Discharge Coefficient – Discharge coefficients can be implemented in the flow equations via
several different methods. Typical methods are average CD , CD look up table, or CD fitted data. If a CD look up table or fitted data is utilized additional calculations must be made based on the Reynolds number (see example process 3d and 5b).
3.Liquid – Typical Calculation Process
a.Given: D, β, ρ, CD, and input of ΔP Calculate: 3.2.2, 3.2.11
b.Given: D, β, ρ, CD, and input of ΔP, T Calculate: 3.2.2, 3.2.3 or 3.2.4 if req., 3.2.11
c.Given: D, β, Sl, CD, and input of ΔP, T
Calculate: 3.2.2, 3.2.3 or 3.2.4 if req., 3.2.9, 3.2.11
d.Given: D, β, μ, ρ, CD look up, and input of ΔP
Calculate: initially set CD = 0.8, 3.2.2, 3.2.3 or 3.2.4 if req., 3.2.11

 3.2.5
3.2.5 
 3.2.6
3.2.6

 Look up CD
 3.2.11
Iterate until flowrate is <0.01% different from last calculation
4.Simplified Liquid Calculation – The simplified liquid calculation can be used if the operating
temperature is stable and the CD is constant. The simplified flow constant (k2) can be calculated from equation 3.3.1 using the V-Cone Flow Meter Application Sizing sheet. The flowrate can then be calculated using equation 3.3.2. Units of measure will be the same as those listed on the V-Cone Flow Meter Application Sizing sheet.
5.Gases and steam – Typical Calculation Process:
a.Given: D, β, μ, Sg, Z, k, CD, and inputs of ΔP, P, T
Calculate: 3.2.2, 3.2.3 or 3.2.4 if req., 3.2.7 or 3.2.8, 3.2.10, 3.2.11
b.Given: D, β, μ, Sg, Z, k, CD look up, and inputs of ΔP, P, T
Calculate: initially set CD=0.8, 3.2.2, 3.2.3 or 3.2.4 if req., 3.2.7 or 3.2.8, 3.2.10, 3.2.11

 3.2.5
3.2.5 
 3.2.6
3.2.6

 Look up CD
 3.2.11
Iterate until flowrate is <0.01% different from last calculation
7
3255WESTSTETSONAVENUE•HEMET,CALIFORNIA92545USA
TEL:951-652-6811•800-220-2279•FAX:951-652-3078 PrintedInTheU.S.A. Lit.#24517-16Rev.3.9/06-11
Copyright © 1992-2011 McCrometer, Inc. All printed material should not be changed or altered without permission of McCrometer. Any
www.mccrometer.com published technical data and instructions are subject to change without notice. Contact your McCrometer representative for current technical data and instructions.