

laser_measurement_instruments_catalog
.pdfthe speed the heat flows out of the same region. The response time is approximately proportional to the aperture, i.e. a 50mm aperture disc is three times as slow as an 18mm aperture disc.
Thermal Surface Absorbing Sensors
A surface absorber typically consists of an optically absorbing refractory material deposited on a heat conducting substrate of copper or aluminum. When a long pulse of several hundred µs or a continuous laser beam falls on such a surface absorber, the light is absorbed in a very thin layer of the surface – typically 0.1 – 1µm thickness (see illustration A). Although the light is absorbed in a thin layer and there converted into heat, the pulse is long enough so that while energy is being deposited into the surface layer, heat is also flowing out into the heat conducting substrate and therefore the surface does not heat up excessively. Ophir standard surface absorbers can stand up to 10 Joules/cm2 for 2ms pulses and up to 28kW/cm2 for low power continuous lasers.
Surface Absorbers for High Power Lasers and Long Pulses
The traditional surface absorbers have a much lower damage threshold at > 1000W, where they can damage at 2-3 kW/cm2. Ophir has developed coatings that improve the damage threshold for high power lasers. These coatings are denser and have higher heat conductivity than previous coatings. These LP and LP1 coatings also have a much higher damage threshold for long pulses reaching
power damage thresholds of up to 100kW/cm² and 250J/cm² for 10ms pulses. Surface absorbers are suitable for pulses longer than ~100µs.
1.1 Sensors
Surface vs. Volume Absorbers
When measuring a laser with short pulses of tens of µs or less, the heat is deposited in a short time and cannot flow during the pulse (see illustration B below). Therefore a surface absorber which absorbs the energy in a thin surface layer is not suitable. All the energy is deposited in a thin layer and that layer is vaporized. In this case, volume absorbers are used. These have traditionally consisted of a neutral density glass thermally bonded to a heat-conducting metallic substrate. The ND glass absorbs the light over a depth of 1-3 mm instead of fractions of a micrometer. Consequently, even with short pulses where there is no heat flow, the light and heat are deposited into a considerable depth of material and therefore the power/energy meter with aa volume absorber is able to withstand much higher energy densities – up to 10 Joules/cm2 (see illustration C). These ND glasses form the basis of the Ophir P type absorbers. In addition to the P absorbers, Ophir has PF and SV absorbers that can stand up to higher average powers and power densities as well as EX absorbers for the UV.
Long laser pulse (>100µs) or continuous |
|
Short laser pulse <10µs |
(A) Surface absorber Heat conducting copper |
(B) Surface absorber |
(C) Volume absorber |
or aluminum substrate |
|
|
Laser pulse
Depth of light |
Heat flows into |
penetration |
substrate during |
~0.1-1µm |
laser pulse |
Laser |
Laser |
pulse |
pulse |
|
|
|
|
|
|
|
|
|
|
Depth of light penetration ~0.1-1µm. Light |
Light is absorbed gradually over thick |
|||
and heat concentrated same thin layer. Heat |
partially transmitting layer. Heat is therefore |
|||
does not have a chance to flow during the |
generated over large volume even during |
|||
short laser pulse duration. |
short pulse with no heat flow. |
|||
Surface absorbers work best when measuring power or energy for long laser pulses (A). Volume absorbers can measure pulses with much higher energies than surface absorbers (B), (C) can measure.
Introduction to High Power Water Cooled Sensors
Ophir has many years experience in supplying measurement systems for high power industrial lasers and has the highest power measuring equipment available on the market – up to 100 kilowatts. Ophir meters also have the highest damage threshold available – up to 10kW/cm² at full power. Ophir supplies water cooled sensors from 300W up to 100kW and air cooled sensors up to 500W.
All sensors supplied by Ophir have been tested at up to full power and their linearity verified over the entire power range. This is done deflecting a fraction of the power with a beam splitter into a lower power sensor whose linearity has previously been verified by NIST
or PTB. In some cases, it is done by measuring the reading over the power range against a higher power sensor that has been previously measured. The accuracy, linearity and
19
For latest updates please visit our website: www.ophiropt.com/photonics |
01.04.2014 |

1.1 Sensors
damage specifications have been carefully verified over many years of development and use by the largest existing user base. In addition to power meters for high powers, Ophir also has beam profilers, beam dumps and protective enclosures for industrial lasers.
Calibration Method and Estimated Accuracy for Ophir High Power Sensors
Ophir models 5000W, 10K-W, Comet 10K and 30K-W are calibrated using relatively low power lasers not exceeding 1000W. Using laser powers that are in many cases much lower than the power rating of the sensors being calibrated raises the question of calibration accuracy. The following explanation clearly demonstrates that these highest power sensors are indeed accurate to ±5% over their measurement range as specified. The 5000W, 10K-W and 30K-W sensors work on the thermopile principle, where the radial heat flow in the absorber disk causes a temperature difference between the hot and cold junctions of the thermopile which in turn causes a voltage difference across the thermopile. Since the instrument is a thermopile voltage generating device, it must be linear at low values of output. Therefore, if it has been shown to be linear up to full power – as it has - it will necessarily be linear at very low powers and if the calibration is correct at low powers, it will remain correct at high powers as well. On the other hand, although the output may be linear at low powers, there may be a zero offset that, due to the relatively low output at low powers, will cause an error in calibration.
For example, if calibration is performed at 200W and the output of the sensor is 10μV/W (a typical value) and there is a zero offset of only 1μV, this will cause a calibration error of 10%. Ophir’s calibration method always measures the difference between the reading with power applied and without power applied, thus eliminating error due to zero offset. This measurement is taken several times to insure accuracy. The above measurement method assures that the calibration inaccuracy due to measurement errors is less than 1%, comparable to the expected errors in our lower powered sensors. In order to verify this, all of our high power sensors have been measured by comparison to various calibration standards. These measurements have shown Ophir sensors to be well within the claimed limits of linearity. The Comet 10K series measures the heat rise of the absorbing puck when irradiated by the laser for 10s. In order to calibrate the Comet 10K, we simply irradiate with a lower power laser for longer e.g. 150W for 60s. Thus the heating effect is similar to that of a higher power laser. Tests of the Comet calibrated by this method vs. NIST traceable high power sensors has shown that it is accurate and reproducible. For more information on calibration please consult our website at
www.ophiropt.com/calibration-procedure/tutorial
Photodiode Sensors
A photodiode sensor is a semiconductor device that produces a current proportional to light intensity and has a high degree of linearity over a large range of light power levels - from fractions of a nanowatt to about 2 mW. Above that light level, corresponding to a current of about 1mA, the electron density in the photodiode becomes too great and its efficiency is reduced causing saturation and a lower reading. Most Ophir PD sensors have a built-in filter that reduces the light level on the detector and allows measurement up to 30mW without saturation. Most sensors have an additional removable filter allowing measurement to 300mW or 3 Watts depending on the model.
Principle of Operation
When a photon source, such as a laser, is directed at a photodiode detector, a current proportional to the light intensity and dependent on the wavelength is created. Since many low power lasers have powers on the order of 5 to 30mW, and most photodiode detectors saturate at about 2mW, the PD300 sensor has been constructed with a built-in filter so the basic sensor can measure up to 30mW without saturation. With the removable extra filter, the PD300 sensors series can measure up to 300mW or 3W depending on the model.
The Ophir power meter unit amplifies this signal and indicates the power level received by the sensor. Due to the superior circuitry of the Ophir power meters, the noise level is very low and the PD300
series sensors with Ophir power meter have a large dynamic range
from picowatts to watts. The PD300 is shown schematically below.
The PD300 and PD300-3W have the exclusive patented dual detectors connected back to back which eliminate any signal
illuminating both detectors equally (background light).
Photodiode # 1
Calibration and Accuracy |
Photodiode # 2 |
|
The sensitivity of various photodiode sensors varies from one sensor to another as well as with wavelength. Therefore, each PD300 sensor is individually calibrated against a NIST standard, which has been calibrated at several nm intervals over the entire spectral range. The calibration is done over the entire spectral range against the NIST standard using a computer-controlled monochromator. Since the instruments are calibrated against NIST standards, the accuracy is generally ±3% over the wavelength range the calibration has been performed. The linearity of the photodiode detector is extremely high and errors due to this factor can be ignored, as long as saturation intensity is not approached. For more information on calibration accuracy please see our website at: www.ophiropt.com/calibration-procedure/tutorial
20
01.04.2014 |
|
For latest updates please visit our website: www.ophiropt.com/photonics |
|

Absorption and Damage Graphs for Thermal Sensors
Absorption vs. Wavelength
|
100 |
|
|
|
|
|
|
|
|
|
|
|
|
|
|
|
|
|
|
|
|
|
|
|
EX |
|
|
|
|
|
|
P |
|
|
|
|
||
|
|
|
|
|
|
|
|
|
|
P |
||
|
|
|
|
|
|
|
|
|
|
|
||
|
|
|
|
|
|
|
|
|
|
|
|
|
|
|
|
|
|
|
PF |
|
|
|
|
|
|
|
90 |
HE, SV |
|
|
LP |
HE |
||||||
|
|
|
|
|
|
|
|
|
|
|
|
|
|
|
|
|
|
|
|
|
|
|
|
|
|
% |
|
BB |
|
|
LP |
|
|
|
|
|
||
|
|
|
|
|
|
|
|
|
|
|
PF |
|
|
|
|
|
|
|
|
|
|
|
|
||
Absorption |
|
|
|
|
|
|
|
|
|
|
|
|
|
|
|
|
|
|
|
|
|
|
|
|
|
80 |
|
|
|
LP1 |
|
|
|
|
|
|||
|
|
|
|
|
|
|
|
|
||||
|
|
|
|
|
|
|
|
|
|
|
|
|
|
|
|
|
|
|
|
|
|
||||
|
|
|
|
|
|
|
|
|
|
|
|
|
|
|
|
|
|
|
|
|
|
|
PF-DIF |
|
SV |
|
|
|
|
|
|
|
|
|
|
|
|
|
|
|
|
|
|
|
|
|
|
|
|
||
70
LP1
60
PF-DIF
50
0.1 |
1 |
10 |
20 |
100 |
Wavelength µm
Damage Threshold vs. Pulse Width
Note: The CW power damage threshold in W/cm2 is found on the right hand side of the table at the 1s pulse width value.
|
100000 |
|
|
|
|
|
|
|
|
|
|
SV |
|
|
|
|
|
|
|
|
|
|
|
|
|
|
|
|
|
|
|
|
|
|
|
|
|
LP1 |
|
|
|
|
|
|
|
|
|
|
|
|
BB thermal <300W |
|
10000 |
|
|
|
Pulsed Laser Damage Threshold |
|
|
|
|
LP |
||
|
|
|
|
|
|
|
|
|
|
|
|
|
|
|
|
|
|
|
|
|
|
|
|
|
BB thermal >1500W |
|
1000 |
|
|
|
|
|
|
|
|
|
|
PF |
|
|
|
|
|
|
|
|
|
|
|
HE / HE1 |
|
J/cm2 |
|
|
|
|
|
|
|
|
|
|
|
|
100 |
|
|
|
|
|
|
|
|
|
|
|
|
in |
|
|
|
|
|
|
|
|
|
|
P |
|
|
|
|
|
|
|
|
|
|
|
PF |
||
Density |
|
|
|
|
|
|
|
|
|
|
||
|
|
|
|
|
|
|
|
|
|
|
||
10 |
|
P |
|
|
|
|
|
|
|
|
|
|
|
|
|
|
|
|
|
|
|
|
|
||
Energy |
1.5 |
|
PF |
|
|
HE |
|
|
|
|
|
in W/cm2 |
|
|
|
|
|
|
|
|
|
||||
1 |
BB |
SV |
|
|
|
|
|
|
|
|||
|
|
|
|
|
|
|
|
|||||
0.3 |
|
|
|
|
|
|
|
|
||||
|
|
|
|
|
|
|
|
|
|
|
Density |
|
|
0.1 |
LP |
|
|
|
|
|
|
|
|
||
|
|
|
|
|
|
|
|
|
|
|
||
|
|
LP1 |
|
|
|
|
|
|
|
|
||
|
|
|
|
|
|
|
|
|
|
Power |
||
|
0.01 |
|
|
|
|
|
|
|
|
|
|
|
|
|
|
|
|
|
|
|
|
|
|
|
|
|
1E-10 |
1E-09 |
1E-08 |
1E-07 |
0.000001 |
0.00001 |
0.0001 |
0.001 |
0.01 |
0.1 |
1 |
|
Pulse Width in Seconds
1.1 Sensors
21
For latest updates please visit our website: www.ophiropt.com/photonics |
01.04.2014 |

1.1.1 Sensors
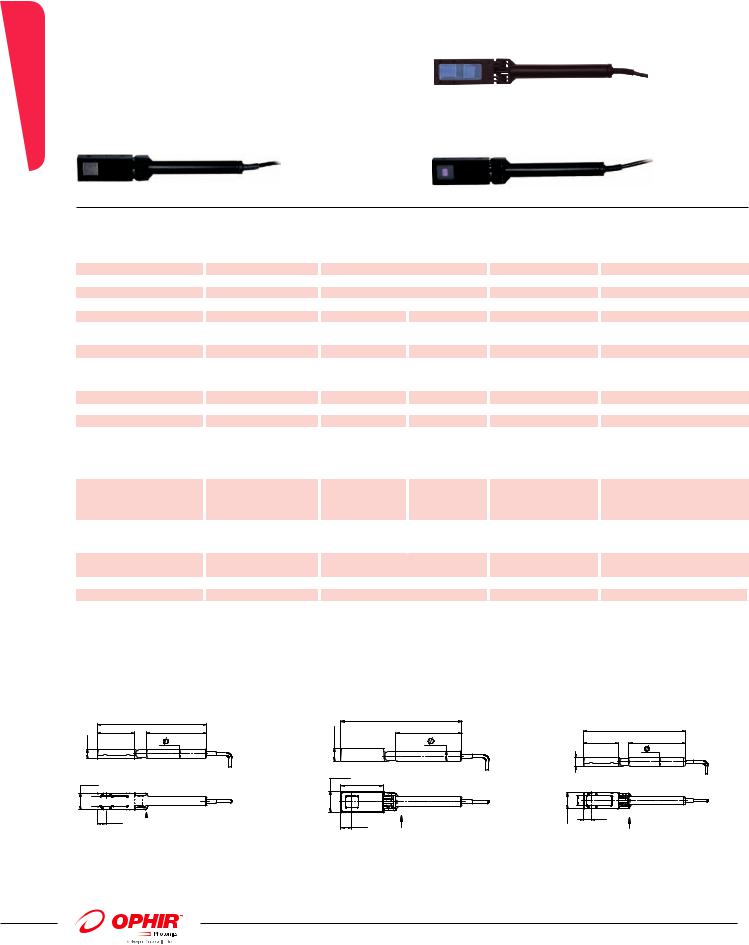
1.1.1 Photodiode Power Sensors
1.1.1.1 Standard Photodiode Sensors
50pW to 3W |
PD300 with filter off |
PD300 with filter installed PD300-TP Mounted on stand |
Features
ֺVery large dynamic range
ֺSwivel mount for hard to measure places
ֺComes with filter in / filter out options
ֺPatented automatic background subtraction
ֺFiber optic adapters available
Model |
PD300 |
|
|
|
|
PD300-1W |
|
|
PD300-3W |
|
|
|
PD300-TP |
|
|
|
|||||||||||||||||
Use |
General |
|
|
|
|
Powers to 1W |
|
|
Powers to 3W |
|
|
|
Thin profile for tight fit |
||||||||||||||||||||
|
|
|
|
|
|
|
|
|
|
|
|
|
|
|
|
|
|
||||||||||||||||
Detector Type |
silicon |
|
|
|
|
silicon |
|
|
silicon |
|
|
|
silicon |
|
|
|
|||||||||||||||||
Aperture |
10x10mm |
|
|
|
|
10x10mm |
|
|
10x10mm |
|
|
|
10x10mm |
|
|
|
|||||||||||||||||
Filter mode |
Filter out |
|
Filter in |
|
Filter out |
Filter in |
|
Filter out |
Filter in |
|
Filter out |
|
Filter in |
||||||||||||||||||||
Spectral Range nm |
350-1100 |
430-1100 |
350-1100 |
|
|
430-1100 |
350-1100 |
|
|
430-1100 |
350-1100 |
400-1100 |
|||||||||||||||||||||
Power Range |
30mW to 500pW |
|
300mW to |
|
30mW to |
1W to 200 µW |
|
100mW to 5nW |
3W to 200µW |
|
3mW to 50pW |
|
1W to 20µW |
||||||||||||||||||||
|
|
|
|
|
|
|
200µW |
|
500pW |
|
|
|
|
|
|
|
|
|
|
|
|
|
|
|
|
|
|
||||||
Power Scales |
30mW to 30nW |
|
300mW to |
|
30mW to 30nW |
1W to 30mW |
|
100mW to |
3W to 30mW |
|
3mW to 3nW |
|
1W to 3mW |
||||||||||||||||||||
|
|
and dBm |
|
30mW and dBm |
|
and dBm |
and dBm |
|
300nW and dBm |
and dBm |
|
and dBm |
|
and dBm |
|||||||||||||||||||
Resolution nW |
0.01 |
|
|
|
|
NA |
|
0.01 |
|
|
|
|
|
NA |
0.1 |
|
|
|
|
|
NA |
|
0.001 |
|
|
1 |
|
||||||
Maximum Power vs. |
nm |
|
|
mW |
|
mW |
|
|
nm |
|
|
mW |
mW |
|
nm |
|
|
mW |
mW |
|
|
nm |
|
|
mW |
|
mW |
|
|||||
Wavelength |
|
|
|
|
|
|
|
|
|
|
|
|
|
|
|
|
|
|
|
|
|
|
|
|
|
|
|
|
|
|
|
|
|
<488 |
30 |
300 |
|
<488 |
30 |
|
|
1000 |
<488 |
100 |
|
|
3000 |
|
350- |
3 |
|
NA |
|
||||||||||||||
|
|
|
|
|
|
|
|
|
|
||||||||||||||||||||||||
|
|
|
|
|
|
|
|
|
|
|
|
|
|
|
|
|
|
|
|
|
|
|
|
|
|
400 |
|
|
|
|
|
|
|
|
|
633 |
|
|
20 |
|
300 |
|
|
633 |
|
|
20 |
|
|
1000 |
|
633 |
|
|
100 |
|
|
3000 |
|
|
400- |
|
|
3 |
|
1000 |
|
|
|
|
|
|
|
|
|
|
|
|
|
|
|
|
|
|
|
|
|
|
|
|
|
|
|
500 |
|
|
|
|
|
|
|
|
|
670 |
|
|
13 |
|
200 |
|
|
670 |
|
|
13 |
|
|
1000 |
|
670 |
|
|
100 |
|
|
2000 |
|
|
600 |
|
|
2.5 |
|
1000 |
|
|
|
790 |
|
|
10 |
|
100 |
|
|
790 |
|
|
10 |
|
|
600 |
|
790 |
|
|
100 |
|
|
1200 |
|
|
700 |
|
|
2 |
|
500 |
|
|
|
904 |
|
|
10 |
|
100 |
|
|
904 |
|
|
10 |
|
|
700 |
|
904 |
|
|
100 |
|
|
1200 |
|
|
800- |
|
|
1.5 |
|
300 |
|
|
|
|
|
|
|
|
|
|
|
|
|
|
|
|
|
|
|
|
|
|
|
|
|
|
|
950 |
|
|
|
|
|
|
|
Accuracy (including errors |
1064 |
|
|
25 |
|
250 |
|
|
1064 |
|
|
25 |
|
|
1000 |
|
1064 |
|
|
100 |
|
|
2200 |
|
|
1064 |
|
|
3 |
|
500 |
|
|
|
|
|
|
|
|
|
|
|
|
|
|
|
|
|
|
|
|
|
|
|
|
|
|
|
|
|
|
|
|
|
|
||
due to temp. variations) |
|
|
|
|
|
|
|
|
|
|
|
|
|
|
|
|
|
|
|
|
|
|
|
|
|
|
|
|
|
|
|
|
|
% error vs Wavelength nm |
±10 |
360-400 |
|
NA |
|
±10 360-400 |
|
|
NA |
±10 |
360-400 |
|
|
NA |
|
|
±7 350-400 NA |
|
|||||||||||||||
|
|
±3 |
400-950 |
|
±5 |
430-950 |
|
±3 |
400-950 |
|
|
±5 430-950 |
|
±3 |
400-950 |
|
|
±5 |
430-950 |
|
±3 |
400-950 |
|
±5 |
400-950 |
||||||||
|
|
±5 |
950-1100 |
|
±7 |
950-1100 |
|
±5 |
950-1100 |
|
|
±7 950-1100 |
|
±5 |
950-1100 |
|
|
±7 |
950-1100 |
|
±5 |
950-1100 |
|
±7 |
950-1100 |
||||||||
Damage Threshold W/cm2 |
10 |
|
|
|
50 |
|
10 |
|
|
|
|
|
10 (a) |
10 |
|
|
|
|
|
100 |
|
10 |
|
|
|
50 |
|
||||||
Max Pulse Energy µJ |
2 |
|
|
|
20 |
|
2 |
|
|
|
|
|
100 |
20 |
|
|
|
|
|
500 |
|
1 |
|
|
|
100 |
|
||||||
Noise Level for filter out pW |
20 |
|
|
|
|
|
|
20 |
|
|
|
|
|
|
200 |
|
|
|
|
|
|
|
±2 |
|
|
|
|
|
|
||||
Response Time with Meter s |
0.2 |
|
|
|
|
|
|
0.2 |
|
|
|
|
|
|
0.2 |
|
|
|
|
|
|
|
0.2 |
|
|
|
|
|
|
||||
Beam Position Dependence |
±2% |
|
|
|
|
|
|
±2% |
|
|
|
|
|
|
±2% |
±3% |
|
±2% |
|
|
|
|
|
|
|||||||||
Background Subtraction |
95-98% of background is cancelled automatically under normal |
|
NA |
|
|
|
|
|
|
|
|
NA |
|
|
|
|
|
|
|||||||||||||||
|
|
room conditions, even when changing continuously |
|
|
|
|
|
|
|
|
|
|
|
|
|
|
|
|
|
||||||||||||||
Fiber Adapters Available |
SMA, FC, ST, SC |
|
|
|
|
SMA, FC, ST, SC |
|
|
SMA, FC, ST, SC |
|
|
|
NA |
|
|
|
|
|
|
||||||||||||||
(see page 54) |
|
|
|
|
|
|
|
|
|
|
|
|
|
|
|
|
|
|
|
|
|
|
|
|
|
|
|
|
|
|
|
|
|
Version |
|
|
|
|
|
|
|
|
|
|
|
|
|
|
|
|
V1 |
|
|
|
|
|
|
|
|
|
|
|
|
|
|
|
|
Part Number |
7Z02410 |
|
|
|
|
7Z02411A |
|
|
7Z02426 |
|
|
|
7Z02424 |
|
|
|
|||||||||||||||||
Note: (a) Maximum power density above which sensor may not read correctly. There will be no permanent damage until 50W/cm²
For graphs see page 24
For PD300-3W drawing see PD300-UV/PD300-IR drawing in page 23
PD300/ PD300-1W filter installed
|
119.5 |
|
12.5 |
65 |
|
10 |
||
|
|
42 |
VIEW A |
|
|
|
21.4 |
|
|
11 |
|
A |
|
|
Front View
22
PD300/ PD300-1W filter off |
PD300-TP |
|
118 |
40.5 |
65 |
|
10 |
10 |
|
|
VIEW A |
17.8 |
11 |
9.5 |
|
|
A |
Front View
01.04.2014 |
|
For latest updates please visit our website: www.ophiropt.com/photonics |
|

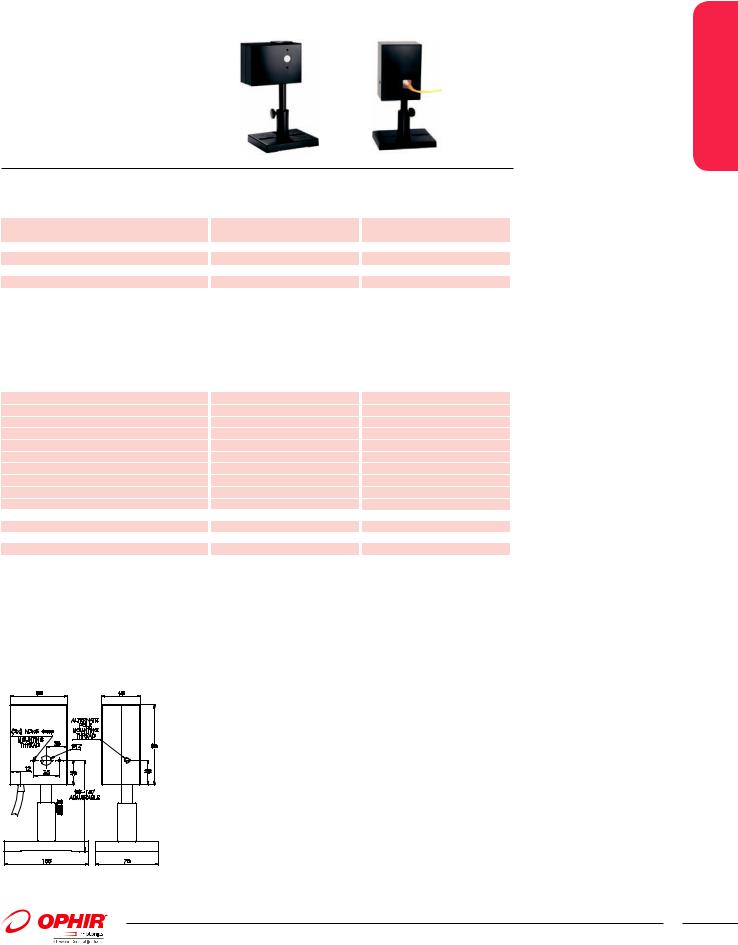
1.1.1.1 Standard Photodiode Sensors
10pW to 300mW
Features
ֺSpectral range including UV and IR
ֺVery large dynamic range
ֺSwivel mount for hard to measure places
ֺComes with filter in / filter out options
ֺFiber optic adapters available
PD300 with filter off |
PD300 with filter installed |
PD300-IRG with no fiber input |
PD300-IRG with fiber input |
1.1.1.1 Sensors
Model |
|
PD300-UV |
|
|
|
|
|
|
|
PD300-IR |
|
|
|
|
PD300-IRG |
|
|
|
|||||
Use |
|
Lowest powers from 200-1100nm |
|
Low powers from 700-1800nm Telecom wavelength fiber and free |
|||||||||||||||||||
|
|
|
|
|
|
|
|
|
|
|
|
|
|
|
|
|
|
space measurements |
|
||||
Detector Type |
|
silicon |
|
|
|
|
|
|
|
germanium |
|
|
|
|
InGaAs |
|
|
|
|
|
|||
Aperture |
|
10x10mm |
|
|
|
|
|
|
|
φ5mm |
|
|
|
|
φ5mm for free space beams |
||||||||
Filter mode |
|
Filter out |
|
|
|
|
Filter in |
|
Filter out |
|
Filter in |
|
Filter out |
|
|
|
Filter in |
||||||
Spectral Range nm |
200 -1100 |
|
|
|
220 -1100 |
700-1800 |
700-1800 |
800 - 1700 |
950 - 1700 |
||||||||||||||
Power Range |
|
3mW to 20pW |
|
300mW to |
|
30mW to 5nW |
|
300mW to |
|
800µW to 10pW |
|
150mW to 20µW |
|||||||||||
|
|
|
|
|
|
|
2µW |
|
|
|
|
|
|
|
200µW |
|
|
|
|
|
|
|
|
Power Scales |
|
3mW to 3nW and dBm 300mW to |
|
30mW to 30nW |
|
300mW to |
|
800 µW to 800pW |
|
300mW to 3mW |
|||||||||||||
|
|
|
|
|
|
|
300µW and dBm |
|
and dBm |
|
30mW and dBm |
|
and dBm |
|
|
|
and dBm |
||||||
Resolution nW |
0.001 |
|
|
|
100 |
|
0.01 |
|
|
|
|
NA |
|
0.0001 |
|
|
1 |
|
|||||
Maximum Power vs. Wavelength |
|
nm |
|
|
mW |
|
mW |
|
|
nm |
|
|
mW |
|
mW |
|
|
nm |
|
mW |
|
mW |
|
|
|
250 - 350 |
|
|
3 |
|
300 |
|
|
800 |
|
|
12 |
|
120 |
|
|
<1000 |
|
0.8 |
|
100 |
|
|
|
400 |
|
|
3 |
|
300 |
|
|
1000- |
|
|
30 |
|
300 |
|
|
1100 |
|
0.8 |
|
30 |
|
|
|
|
|
|
|
|
|
|
1300 |
|
|
|
|
|
|
|
|
|
|
|
|
|
|
|
|
600 |
|
|
3 |
|
300 |
|
|
1400 |
|
|
30 |
|
250 |
|
|
1200 |
|
0.8 |
|
50 |
|
|
|
800 - 950 |
|
|
2.5 |
|
150 |
|
|
1500 |
|
|
25 |
|
80 |
|
|
>1300 |
|
0.8 |
|
150 |
|
|
|
|
|
|
|
|
|
|
|
|
|
|
|
|
|
|
|
|
|
|
|
|
|
|
1064 |
|
3 |
300 |
|
1600 |
|
30 |
100 |
|
|
|
|
|
|
|
|
||||||
Accuracy (including errors due to |
|
|
|
|
|
|
|
|
|
1800 |
|
|
30 |
|
300 |
|
|
|
|
|
|
|
|
|
|
|
|
|
|
|
|
|
|
|
|
|
|
|
|
|
|
|
|
|
|
|
|
temp. variations) |
|
|
|
|
|
|
|
|
|
|
|
|
|
|
|
|
|
|
|
|
|
|
|
% error vs Wavelength nm |
±6 |
200-270 |
±10 |
220-400 |
±5 |
700-900 |
±7 |
700-900 |
±3 |
1000-1650 |
±6 |
1000-1650 |
|||||||||||
|
|
±3 |
270-950 |
|
±5 |
400-950 |
|
±4 |
900-1700 |
|
±6 |
900-1700 |
|
±5 <1000 & >1650 |
|
±8 |
<1000 & >1650 |
||||||
Damage Threshold W/cm2 |
|
±5 |
950-1100 |
|
±7 |
950-1100 |
|
±7 |
1700-1800 |
|
±9 |
1700-1800 |
|
|
|
|
|
|
|
||||
10 |
|
|
|
50 |
|
10 |
|
|
|
50 |
|
5 |
|
|
50 |
|
|||||||
Max Pulse Energy µJ |
0.4 |
|
|
|
15 |
|
0.3 |
|
|
|
3 |
|
1 |
|
|
100 |
|
||||||
Noise Level for filter out pW |
±1 |
|
|
|
|
|
|
|
|
200 |
|
|
|
|
±300fW at 1550 nm |
|
|
|
|||||
|
|
|
|
|
|
|
|
|
|
|
|
|
|
|
|
|
|
and 1s average |
|
|
|
||
Response Time with Meter s |
|
|
0.2 |
|
|
|
|
|
0.2 |
|
|
|
0.2 |
|
|||||||||
Beam Position Dependence |
|
|
±2% |
|
|
|
|
|
±2% |
|
|
±1% over 80% of aperture |
|||||||||||
Fiber Adapters Available (see page 54&55) |
|
SC, ST, FC, SMA |
|
|
|
|
SC, ST, FC, SMA |
|
|
|
|
FC, FC/APC, SMA |
|
|
|
||||||||
Version |
|
|
|
|
|
|
|
|
|
|
|
|
|
|
|
|
|
V1 |
|
|
|
|
|
Part Number |
|
7Z02413 |
|
|
|
|
|
|
|
7Z02412 |
|
|
|
|
7Z02402 |
|
|
|
|
|
|||
For graphs see page 24
PD300-UV/PD300-IR filter installed
\φ5mm for PD300-IR only)
|
|
119.5 |
|
12.5 |
42 |
65 |
|
10 |
|||
|
|||
21.4 |
|
VIEW A |
|
11 |
|
||
|
|
 Active Area
  5mm
5mm
 A
A
PD300-UV/PD300-IR filter off
\φ5mm for PD300-IR only)
|
118 |
|
65 |
10 |
40.5 |
10 |
|
|
VIEW A
17.89.5
11


 Active Area
  5mm
5mm
 A
A
PD300-IRG
with filter off
23
For latest updates please visit our website: www.ophiropt.com/photonics |
01.04.2014 |

|
|
Temperature Coefficient of Sensitivity |
|
|
|
|
|
|
|
|||||||||||||||||||
|
|
1.4 |
|
|
|
|
|
|
|
|
|
|
|
|
|
|
|
|
|
|
|
|
|
|
|
|
|
|
|
|
|
|
|
|
|
|
|
|
|
|
|
|
|
|
|
|
|
|
PD300-IR |
|
|
|
|
|
|||
|
|
|
|
|
|
|
|
|
|
|
|
|
|
|
|
|
|
|
|
|
|
|
|
|
||||
|
|
1.2 |
|
|
|
|
|
|
|
|
|
|
|
|
|
|
|
|
|
PD300/PD300UV/PD300-3W |
|
|
||||||
|
|
|
|
|
|
|
|
|
|
|
|
|
|
|
|
|
|
|
|
|
||||||||
|
degC |
1 |
|
|
|
|
|
|
|
|
|
|
|
|
|
|
|
|
|
PD300-IRG |
|
|
|
|
|
|||
|
|
|
|
|
|
|
|
|
|
|
|
|
|
|
|
|
|
|
|
|
|
|
||||||
|
|
|
|
|
|
|
|
|
|
|
|
|
|
|
|
|
|
|
|
|
|
|
|
|
|
|
||
|
|
|
|
|
|
|
|
|
|
|
|
|
|
|
|
|
|
|
|
|
|
|
|
|
|
|
||
|
0.8 |
|
|
|
|
|
|
|
|
|
|
|
|
|
|
|
|
|
|
|
|
|
|
|
|
|
|
|
Sensors |
changePercentper |
|
|
|
|
|
|
|
|
|
|
|
|
|
|
|
|
|
|
|
|
|
|
|
|
|
|
|
0.6 |
|
|
|
|
|
|
|
|
|
|
|
|
|
|
|
|
|
|
|
|
|
|
|
|
|
|
||
|
|
|
|
|
|
|
|
|
|
|
|
|
|
|
|
|
|
|
|
|
|
|
|
|
|
|
|
|
|
|
0.4 |
|
|
|
|
|
|
|
|
|
|
|
|
|
|
|
|
|
|
|
|
|
|
|
|
|
|
|
|
0.2 |
|
|
|
|
|
|
|
|
|
|
|
|
|
|
|
|
|
|
|
|
|
|
|
|
|
|
|
|
|
|
|
|
|
|
|
|
|
|
|
|
|
|
|
|
|
|
|
|
|
|
|
|
|
|
|
|
|
0 |
PD300/PD300UV/PD300-3W |
|
|
|
|
|
|
|
|
PD300-IRG |
|
|
|
|
|
|||||||||||
1.1.1.1 |
|
|
|
|
|
|
|
|
|
|
|
|
|
|
|
|
|
|
|
|
|
|
|
|
|
|
|
|
|
|
|
|
|
|
|
|
|
|
|
|
|
|
|
|
|
|
|
|
|
|
|
|
|
|
|
||
|
-0.2 |
|
|
|
|
|
|
|
|
|
|
|
|
|
|
|
|
|
|
|
|
|
|
|
|
|
|
|
|
|
|
|
|
|
|
|
|
|
|
|
|
|
|
|
|
PD300-IR |
|
|
|
|
|
|
|
||||
|
|
|
|
|
|
|
|
|
|
|
|
|
|
|
|
|
|
|
|
|
|
|
|
|||||
|
-0.4 |
|
|
|
|
|
|
|
|
|
|
|
|
|
|
|
|
|
|
|
|
|
|
|
|
|
|
|
|
|
300 |
400 |
500 |
600 |
700 |
800 |
900 |
1000 |
1100 |
1200 |
1300 |
1400 |
1500 |
1600 |
1700 |
1800 |
|||||||||||
Wavelength, nm
Dependence of Sensitivity on Numerical Aperture (PD300 - IRG)
|
1.1 |
|
|
|
|
|
sensitivity |
1 |
|
|
|
|
|
0.9 |
|
|
|
|
|
|
|
0.8 |
|
SMF |
|
|
Filter out |
|
|
|
|
|
Filter in |
|
relative |
|
|
|
|
|
|
0.7 |
|
|
|
|
|
|
|
0.6 |
|
|
|
|
|
|
0.5 |
|
|
|
|
|
|
0 |
0.1 |
0.2 |
0.3 |
0.4 |
0.5 |
numerical aperture
Note:
1.Graph assumes equal intensity into all angles up to maximum N.A.
2.Calibration is done with SMF, N.A. 0.13
Typical Sensitivity Curve of PD300-BB Sensors
|
120 |
|
|
|
|
|
|
|
|
|
|
|
|
|
|
110 |
|
|
|
|
|
|
|
|
|
|
|
|
|
|
100 |
|
|
|
|
|
|
|
|
|
|
|
|
|
% |
90 |
|
|
|
|
|
|
|
|
|
|
|
|
|
80 |
|
|
|
|
|
|
|
|
|
|
|
|
|
|
responce, |
|
|
|
|
|
|
|
|
|
|
|
|
|
|
70 |
|
|
|
|
|
|
|
|
|
|
|
|
|
|
|
|
|
|
|
|
|
|
|
|
|
|
|
|
|
|
60 |
|
|
|
|
|
|
|
|
|
|
|
|
|
|
50 |
|
|
|
|
|
|
|
|
|
|
|
|
|
relative |
40 |
|
|
|
|
|
|
|
|
|
|
Filter out |
|
|
10 |
|
|
|
|
|
|
|
|
|
|
|
|
|
|
|
30 |
|
|
|
|
|
|
|
|
|
|
Filter in |
|
|
|
20 |
|
|
|
|
|
|
|
|
|
|
|
||
|
|
|
|
|
|
|
|
|
|
|
|
|
|
|
|
0 |
|
|
|
|
|
|
|
|
|
|
|
|
|
|
400 |
450 |
500 |
550 |
600 |
650 |
700 |
750 |
800 |
850 |
900 |
950 |
1000 |
1050 |
Wavelength, nm
24
PD300 Angle Dependence
|
1 |
|
|
|
|
|
|
|
0.9 |
|
|
|
|
|
|
|
0.8 |
|
|
|
|
|
|
reading |
0.7 |
|
|
|
|
|
|
|
|
|
|
|
|
|
|
relative |
0.6 |
|
|
|
|
|
|
|
|
|
|
|
|
|
|
|
0.5 |
|
|
|
|
|
|
|
0.4 |
|
|
|
|
|
|
|
0 |
10 |
20 |
30 |
40 |
50 |
60 |
Angle, degrees
PD300-CIE spectral response vs. CIE curve
|
1.2 |
|
|
|
|
|
|
1.0 |
|
|
|
|
|
responce |
0.8 |
|
|
|
|
|
|
|
|
|
|
Ophir |
|
|
0.6 |
|
|
|
|
CIE |
relative |
|
|
|
|
|
|
0.2 |
|
|
|
|
|
|
|
0.4 |
|
|
|
|
|
|
300 |
400 |
500 |
600 |
700 |
800 |
Wavelength, nm
Relative Spectral Response of BC20
|
110 |
|
|
100 |
|
% |
90 |
|
sensitivity, |
80 |
|
70 |
||
|
||
|
60 |
|
|
50 |
|
relative |
40 |
|
30 |
20
10
0
340 |
440 |
540 |
640 |
740 |
840 |
940 |
1040 |
1140 |
Wavelength, nm
Graph of the approximate relative spectral response of the BC20 for purpose of interpolation, if the instrument is to be used at a wavelength other than the ones that are factory calibrated
01.04.2014 |
|
For latest updates please visit our website: www.ophiropt.com/photonics |
|

1.1.1.2 Round Photodiode Sensors
20pW to 3W |
PD300R Filter Off |
PD300R Filter installed |
Features
ֺRound geometry for easy centering
ֺThreaded to fit standard SM1 bench equipment
ֺSame performance as standard PD300 sensors
ֺComes with removable filter as standard
ֺFiber optic adapters available
Model |
|
PD300R |
|
|
|
PD300R-3W |
|
|
|
PD300R-UV |
|
|
|
PD300R-IR |
|
||||||
Use |
|
General |
|
|
|
Powers to 3W |
|
|
|
Lowest powers from |
|
|
IR wavelengths |
|
|||||||
|
|
|
|
|
|
|
|
|
|
|
|
200-1100nm |
|
|
|
700-1800nm |
|
||||
Detector Type |
|
silicon |
|
|
|
silicon |
|
|
|
silicon |
|
|
|
|
germanium |
|
|||||
Aperture |
|
φ10mm |
|
|
|
φ10mm |
|
|
|
φ10mm |
|
|
|
|
φ5mm |
|
|
||||
Filter mode |
|
Filter out |
Filter in |
|
Filter out |
Filter in |
|
Filter out |
|
Filter in |
|
Filter out |
|
Filter in |
|||||||
Spectral Range nm |
350-1100 |
430-1100 |
350-1100 |
430-1100 |
200 -1100 |
|
220 -1100 |
700-1800 |
|
700-1800 |
|||||||||||
Power Range |
|
30mW to |
300mW to |
|
100mW to |
3W to 200µW |
|
3mW to 20pW |
300mW to |
|
30mW to 5nW |
300mW to |
|||||||||
|
|
500pW |
200µW |
|
5nW |
|
|
|
|
|
|
|
2µW |
|
|
|
|
|
200µW |
||
Power Scales |
|
30mW to |
300mW to |
|
100mW to |
3W to 30mW |
|
3mW to 3nW |
300mW to |
|
30mW to 30nW |
300mW to |
|||||||||
|
|
30nW and |
30mW and |
|
300nW and |
and dBm |
|
and dBm |
|
300µW and |
|
and dBm |
|
30mW and |
|||||||
|
|
dBm |
|
dBm |
|
|
dBm |
|
|
|
|
|
|
|
dBm |
|
|
|
|
|
dBm |
Resolution nW |
0.01 |
|
NA |
|
0.1 |
|
NA |
|
0.001 |
|
100 |
|
0.01 |
|
|
NA |
|||||
Maximum Power vs. |
|
nm |
mW |
mW |
|
|
nm |
mW |
mW |
|
|
nm |
|
mW |
mW |
|
|
nm |
|
mW |
mW |
Wavelength |
|
|
|
|
|
|
|
|
|
|
|
|
|
|
|
|
|
||||
<488 |
30 |
300 |
|
<488 |
100 |
3000 |
|
250 - 350 |
3 |
300 |
|
800 |
|
12 |
120 |
||||||
|
|
633 |
20 |
300 |
|
633 |
100 |
3000 |
|
400 |
|
3 |
300 |
|
1000- |
30 |
300 |
||||
|
|
|
|
|
|
|
|
|
|
|
|
|
|
|
|
|
1300 |
|
|
|
|
|
|
670 |
13 |
200 |
|
670 |
100 |
2000 |
|
600 |
|
3 |
300 |
|
1400 |
|
30 |
250 |
|||
|
|
790 |
10 |
100 |
|
790 |
100 |
1200 |
|
800 - 950 |
2.5 |
150 |
|
1500 |
|
25 |
80 |
||||
|
|
904 |
10 |
100 |
|
904 |
100 |
1200 |
|
1064 |
|
3 |
30 |
|
1600 |
|
30 |
100 |
|||
Accuracy (including errors |
|
1064 |
25 |
250 |
|
1064 |
100 |
2200 |
|
|
|
|
|
|
|
1800 |
|
30 |
300 |
||
|
|
|
|
|
|
|
|
|
|
|
|
|
|
|
|
|
|
|
|
|
|
due to temp. variations) |
|
|
|
|
|
|
|
|
|
|
|
|
|
|
|
|
|
|
|
|
|
% error vs Wavelength nm |
±10 |
360-400 |
NA |
|
±10 360-400 |
NA |
|
±6 |
200-270 |
±10 220-400 |
±5 |
700-900 |
±7 700-900 |
||||||||
|
|
±3 |
400-950 |
±5 |
430-950 |
±3 |
400-950 |
±5 |
430-950 |
±3 |
270-950 |
±5 |
400-950 |
±4 |
900-1700 |
±6 900-1700 |
|||||
|
|
±5 |
950-1100 ±7 |
950-1100 |
±5 |
950-1100 |
±7 |
950-1100 |
±5 |
950-1100 |
±7 |
950-1100 |
±7 |
1700-1800 |
±9 1700-1800 |
||||||
Damage Threshold W/cm2 |
10 |
|
50 |
|
10 |
|
100 |
|
10 |
|
|
50 |
|
10 |
|
|
50 |
||||
Max Pulse Energy µJ |
2 |
|
20 |
|
20 |
|
500 |
|
0.4 |
|
|
15 |
|
0.3 |
|
|
3 |
||||
Noise Level for filter out pW |
20 |
|
|
|
200 |
|
|
|
±1 |
|
|
|
|
200 |
|
|
|
||||
Response Time with Meter s |
0.2 |
|
|
|
0.2 |
|
|
|
0.2 |
|
|
|
|
0.2 |
|
|
|
||||
Beam Position Dependence |
±2% |
|
|
|
±2% |
|
±3% |
|
±2% |
|
|
|
|
±2% |
|
|
|
||||
Fiber Adapters Available |
|
FC, ST, SC, SMA |
|
|
|
FC, ST, SC, SMA |
|
|
|
SC, ST, FC, SMA |
|
|
|
SC, ST, FC, SMA |
|
||||||
(see page 55) |
|
|
|
|
|
|
|
|
|
|
|
|
|
|
|
|
|
|
|
|
|
Version |
|
|
|
|
|
|
|
|
|
|
|
|
|
|
|
|
|
|
|
|
|
Part Number |
|
7Z02436 |
|
|
|
7Z02437 |
|
|
|
7Z02438 |
|
|
|
|
7Z02439 |
|
|
||||
|
|
|
|
|
|
|
|
|
|
|
|
|
|
|
|
|
|
|
|
|
|
For graphs see page 24 |
|
|
|
|
|
|
|
|
|
|
|
|
|
|
|
|
|
|
|
|
|
PD300R/ PD300R-3W/ PD300R-UV |
|
|
|
|
|
|
PD300R-IR |
|
|
|
|
|
|
|
|
|
|||||
|
|
|
|
24.2 |
|
|
|
|
24.2 |
|
19.2 |
|
|
4 |
19.2 |
|
|
|
4 |
4 |
35 |
|
10 |
15 |
4 |
35 |
5 |
|
15 |
|
|
|
|
|
|
|
|||
|
4 |
|
|
32 |
|
4 |
|
|
32 |
|
|
|
|
|
|
|
|
||
1.035"-40 |
|
35° |
|
1.035"-40 |
1.035"-40 |
|
35° |
|
1.035"-40 |
(SM1) |
|
|
ADJUSTABLE |
(SM1) |
(SM1) |
|
|
ADJUSTABLE |
(SM1) |
|
|
|
|
|
|
|
|
||
|
|
|
76-125 |
|
|
|
|
76-125 |
|
|
100 |
|
75 |
|
100 |
|
75 |
with filter o |
|
with filter installed |
with filter o |
|
|
with filter installed |
|
1.1.1.2 Sensors
25
For latest updates please visit our website: www.ophiropt.com/photonics |
01.04.2014 |
1.1.1.3 Sensors
1.1.1.3 Special photodiode sensors and integrating spheres 1.1.1.3.1 Special Photodiode Sensors
Features |
BC20 |
|
ֺ PD300-BB for broadband light sources - radiometry |
|
|
ֺ |
(PD300-BB-50mW option up to 50mW) |
|
PD300-CIE for eye adjusted Lux measurements |
|
|
ֺ |
BC20 for measuring scanned beams such as bar code light sources |
|
PD300-BB/ / PD300-BB-50mW |
PD300-CIE |
|
Model |
|
PD300-BB |
|
PD300-BB-50mW |
|
|
PD300-CIE (b) |
|
BC20 (b) |
|
Use |
|
Radiometry-broad |
|
Same as PD300-BB with removable |
|
Eye adjusted |
|
Scanned beams e.g. bar code |
|
|
|
|
spectrum |
|
attenuator for use to 50mW |
|
measurement in Lux |
|
|
|
|
|
|
|
|
|
|
|
|
|
|
|
Detector Type |
Silicon with special filter |
Silicon with special filter |
Silicon with special filter |
Silicon with peak and hold circuit |
|
|||||
Aperture |
|
10x10mm |
|
10x10mm |
|
|
Active area 2.4 x 2.8mm |
|
10x10mm |
|
Spectral Range nm |
|
430 - 1000 (see graph) |
|
430 - 1000 (see graph) |
|
400 - 700 (see graph) |
|
633, 650, 675 (others available) |
|
|
Filter Mode |
|
|
|
Filter out |
Filter in |
|
|
|
|
|
Power Range |
|
4mW to 50pW |
|
4mW to 50pW |
50mW to 1nW |
|
200kLux to 20 mLux |
|
20mW to 100µW |
|
Power Scales |
|
4mW to 8nW and dBm |
|
4mW to 8nW and |
50mW to 80nW |
|
200kLux to 200 mLux |
|
20mW to 2mW |
|
|
|
|
|
dBm |
and dBm |
|
|
|
|
|
Resolution nW |
0.001 |
0.001 |
0.01 |
|
1 mLux |
0.001 |
|
|||
Accuracy |
|
Maximum deviation from |
|
Maximum deviation from flat |
|
(see graph) |
|
±3% for >10% of full scale. |
|
|
|
|
flat spectrum (see graph) |
|
spectrum (see graph) |
|
|
|
Deviation from calibration -3% at |
|
|
Damage Threshold W/cm2 |
|
±10% |
±10% |
±12% |
|
|
|
30,000 inch/s scan rate on sensor. |
|
|
10 |
10 |
100 |
10 |
50 |
|
|||||
Max Pulse Energy µJ |
1 |
1 |
10 |
1 |
|
NA |
|
|||
Noise Level pW |
2 |
2 |
30 |
|
±1mLux |
|
5µW |
|
||
Response Time with Meter s |
0.2 |
0.2 |
0.2 |
0.2 |
|
Two modes of operation: |
|
|||
|
|
|
|
|
|
|
|
|
Hold: holds highest reading for 5s |
|
|
|
|
|
|
|
|
|
|
then updates. |
|
|
|
|
|
|
|
|
|
|
No Hold: updates reading 3 times per |
|
|
|
|
|
|
|
|
|
|
second. |
|
Beam Position Dependence |
|
±2% for broadband light |
|
±2% for broadband |
±3% for |
|
NA – source overfills |
±2% |
|
|
|
|
sources |
|
light sources |
broadband light |
|
detector |
|
|
|
|
|
|
|
|
sources |
|
|
|
|
|
Background Subtraction |
|
NA |
|
NA |
NA |
|
NA |
|
Background is automatically |
|
|
|
|
|
|
|
|
|
|
subtracted from both scanned |
|
|
|
|
|
|
|
|
|
|
and static beams. |
|
Fiber Adapters Available |
|
NA |
|
SC, ST, FC, SMA |
|
|
NA |
|
NA |
|
(see page 54) |
|
|
|
|
|
|
|
|
|
|
Version |
|
|
|
|
|
|
|
|
|
|
Part Number |
|
7Z02405 |
|
7Z02440 |
|
|
7Z02406 |
|
7Z02422A(a) |
|
Notes: |
|
|
|
|
|
|
|
|
(a) Swivel stand for BC20 sensor P/N |
|
(b) The PD300-CIE and BC20 sensors are not fully supported by Ophir PC Interfaces (Juno, USBI, Pulsar and Quasar) or by StarLite Meter. |
|
1Z09004 |
|
|||||||
|
|
|
||||||||
|
|
|
|
|
|
|
|
|
|
|
For graphs see page 24
PD300-BB-CIE / PD300-BB |
PD300-BB-50mW with filter installed |
BC20 |
/ PD300-BB-50mW with filter off |
|
|
|
118 |
40.5 |
65 |
10 |
10 |
VIEW A
17.8 11


9.5 A
A
Front View
|
119.5 |
12.5 |
65 |
10 |
|
21.4 |
VIEW A |
|
42 |
11 |
A |
|
|
|
Front View |
|
118 |
40.5 |
65 |
|
10 |
10 |
|
|
VIEW A |
17.8 |
11 |
9.5 |
|
|
A |
Front View
26
01.04.2014 |
|
For latest updates please visit our website: www.ophiropt.com/photonics |
|
1.1.1.3.2 Special Sensors - Integrating Spheres
1µW to 3W |
3A-IS |
3A-IS-IRG |
Features
ֺIntegrating sphere for divergent beams
ֺφ12mm aperture
ֺFor fiber or free space input
Model |
|
3A-IS |
|
3A-IS-IRG |
|
Use |
|
Divergent beams to 3W for |
|
Divergent beams to 3W for IR |
|
|
|
visible NIR |
|
|
|
Absorber Type |
|
Integrating sphere with Si |
|
Integrating sphere with InGaAs |
|
|
|
detector |
|
detector |
|
Spectral Range µm |
0.42 - 1.1 |
0.8 - 1.7 |
|
||
Aperture mm |
|
φ 12mm |
|
φ 12mm |
|
Maximum Beam Divergence |
|
±40 degrees |
|
±40 degrees |
|
Sensitivity to beam size and angle |
±2% |
±2% |
|
||
Power Mode |
|
|
|
|
|
Power Range |
|
1µW - 3W |
|
1µW - 3W |
|
Power Scales |
|
3W to 3µW and dBm |
|
3W to 3µW and dBm |
|
Power Noise Level |
|
20nW |
|
20nW |
|
Maximum Average Power Density kW/cm2 |
|
0.2 on integrating sphere surface |
|
||
Response Time with Meter (0-95%) typ. s |
|
0.2 |
0.2 |
|
|
Power Accuracy +/-% |
|
5 at 420-1000nm, |
|
5 |
|
|
|
10 at 1000-1100nm |
|
|
|
Linearity with Power +/-% |
|
1 |
|
1 |
|
Energy Mode |
|
|
|
|
|
Energy Range |
|
NA |
|
NA |
|
Energy Scales |
|
NA |
|
NA |
|
Minimum Energy mJ |
|
NA |
|
NA |
|
Maximum Energy |
|
5mJ |
|
5mJ |
|
Maximum Energy Density J/cm2 (b) |
|
|
|
|
|
<100ns |
0.5 |
0.5 |
|
||
0.5ms |
6 |
6 |
|
||
2ms |
12 |
12 |
|
||
10ms |
25 |
25 |
|
||
Cooling |
|
convection |
|
convection |
|
Fiber Adapters Available (see page 55) |
|
SC, ST, FC, SMA (a) |
|
SC, ST, FC, SMA (a) |
|
Weight kg |
0.6 |
0.6 |
|
||
Version |
|
V1 |
|
|
|
Part number |
|
7Z02404 |
|
7Z02403 |
|
Notes: |
|
(a) One fiber output port available with output = 2E-4 of input power/mm2 of fiber area. |
|
||
|
|
(b) On integrating sphere surface. |
|
|
|
|
|
|
|
|
|
3A-IS/ 3A-IS-IRG |
1.1.1.3.2 Sensors
27
For latest updates please visit our website: www.ophiropt.com/photonics |
01.04.2014 |

1.1.2 Sensors
1.1.2 Thermal Power Sensors
1.1.2.1 High Sensitivity Thermal Sensors
8µW to 3W |
3A / 3A-P / 3A-P-THz |
3A-FS |
3A-P-FS-12 |
Features
ֺVery low noise and drift to measure very low powers and energies
ֺBroadband and P absorbers for CW and short pulses
ֺUp to 3W
ֺSpectrally flat
ֺVersion for Terahertz
|
|
Model |
|
|
|
3A |
|
|
|
|
3A-P |
|
3A-P-THz |
|
|
|
3A-FS |
|
|
3A-P-FS-12 |
|
|
|
|
|
|
|
|
|
|||||||||||||||||||||||||||||||||||||||||||||||||||||||||||||||||||||||||||||||||||||||||||||||||||||||||||||||||||||||||||||||||
|
|
Use |
|
|
|
General purpose Short pulses |
|
Calibrated for |
|
|
|
With removable |
|
|
For divergent |
|
|
|
|
|
|
|
|
|
||||||||||||||||||||||||||||||||||||||||||||||||||||||||||||||||||||||||||||||||||||||||||||||||||||||||||||||||||||||||||||||||||||||
|
|
|
|
|
|
|
|
|
|
|
|
|
|
|
|
|
|
|
|
|
|
|
|
|
|
|
|
|
|
|
|
|
|
|
|
|
|
|
|
|
|
|
|
|
|
|
|
|
|
|
|
|
|
|
|
|
|
|
|
|
|
|
|
|
|
|
|
|
|
|
|
|
|
|
|
|
|
|
|
|
|
|
|
|
|
|
|
|
|
Terahertz |
|
|
|
window |
|
|
beams, window |
|
|
|
|
|
|
|
|
|
||||||||||||||||||||||||||||||||||||||||||||||||||||
|
|
|
|
|
|
|
|
|
|
|
|
|
|
|
|
|
|
|
|
|
|
|
|
|
|
|
|
|
|
|
|
|
|
|
|
|
|
|
|
|
|
|
|
|
|
|
|
|
|
|
|
|
|
|
|
|
|
|
|
|
|
|
|
|
|
|
|
|
|
|
|
|
|
|
|
|
|
|
|
|
|
|
|
|
|
|
|
|
|
radiation |
|
|
|
|
|
|
|
|
|
|
|
|
|
|
|
|
|
blocks infrared |
|
|
|
|
|
|
|
|
|
|||||||||||||||||||||||||||||||||||||||||
|
|
Absorber Type |
|
|
|
Broadband |
|
|
|
|
P type |
|
|
P type |
|
|
|
Broadband + F.S. |
|
|
P type + F.S. window |
|
|
|
|
|
|
|
|
|
|
|||||||||||||||||||||||||||||||||||||||||||||||||||||||||||||||||||||||||||||||||||||||||||||||||||||||||||||||||||||||||||||||
|
|
|
|
|
|
|
|
|
|
|
|
|
|
|
|
|
|
|
|
|
|
|
|
|
|
|
|
|
|
|
|
|
|
|
|
|
|
|
|
|
|
|
|
|
|
|
|
|
|
|
|
|
|
|
|
|
|
|
|
|
|
|
|
|
|
|
|
|
|
|
|
|
|
|
|
|
|
|
|
|
|
|
|
|
|
|
|
|
|
|
|
|
|
|
|
|
|
|
|
|
|
|
|
|
|
|
|
|
|
|
|
window |
|
|
|
|
|
|
|
|
|
|
|
|
|
|
|
|
|
|
|
|
|
|
|
|
|
|
|
|
|
|
|
|
|
|
|
|||||||||||
|
|
Spectral Range µm |
0.19 - 20 |
|
|
|
|
|
0.15 - 8 |
|
|
|
|
|
|
|
|
|
0.3 - 10THz |
|
|
|
0.19 - 20 (b) |
0.22 - 2.1 |
|
|
|
|
|
|
|
|
|
|
|
|
|
|
|
|
|
|
|
|
|
|
||||||||||||||||||||||||||||||||||||||||||||||||||||||||||||||||||||||||||||||||||||||||||||||||||||||||||||||||
|
|
Aperture mm |
|
|
|
φ 9.5mm |
|
|
|
|
φ 12mm |
|
φ 12mm |
|
|
|
φ 9.5mm |
|
|
φ 12mm |
|
|
|
|
|
|
|
|
|
|||||||||||||||||||||||||||||||||||||||||||||||||||||||||||||||||||||||||||||||||||||||||||||||||||||||||||||||||||||||||||||||||
|
|
Maximum Beam Divergence |
|
|
|
NA |
|
|
|
|
NA |
|
NA |
|
|
|
NA |
|
|
±40 degrees |
|
|
|
|
|
|
|
|
|
|||||||||||||||||||||||||||||||||||||||||||||||||||||||||||||||||||||||||||||||||||||||||||||||||||||||||||||||||||||||||||||||||
|
|
Power Mode |
|
|
|
|
|
|
|
|
|
|
|
|
|
|
|
|
|
|
|
|
|
|
|
|
|
|
|
|
|
|
|
|
|
|
|
|
|
|
|
|
|
|
|
|
|
|
|
|
|
|
|
|
|
|
|
|
|
|
|
|
|
|
|
|
|
|
|
|
|
|
|
|
|
|
|
|
|
|
|
|
|
|
|
|
|
|
|
|
|
|
|
|
|
|
|
|
|
|
|
|
|
|
|
|
|
|
|
|
|
|||||||||||||||||||||||||||||||||||||||||||||||
|
|
|
Power Range (f ) |
|
|
|
10µW - 3W |
|
|
|
|
15µW - 3W |
|
15µW - 3W |
|
|
|
8µW - 3W |
|
|
15µW - 3W |
|
|
|
|
|
|
|
|
|
||||||||||||||||||||||||||||||||||||||||||||||||||||||||||||||||||||||||||||||||||||||||||||||||||||||||||||||||||||||||||||||||
|
|
|
Power Scales |
|
|
|
3W to 300µW |
|
|
|
|
3W to 300µW |
|
|
3W to 300µW |
|
|
|
3W to 300µW |
|
|
3W to 300µW |
|
|
|
|
|
|
|
|
|
|
||||||||||||||||||||||||||||||||||||||||||||||||||||||||||||||||||||||||||||||||||||||||||||||||||||||||||||||||||||||||||||||
|
|
|
Power Noise Level |
|
|
|
2µW |
|
|
|
|
4µW |
|
|
4µW(d) |
|
|
|
2µW |
|
|
6µW |
|
|
|
|
|
|
|
|
|
|
||||||||||||||||||||||||||||||||||||||||||||||||||||||||||||||||||||||||||||||||||||||||||||||||||||||||||||||||||||||||||||||
|
|
|
Thermal Drift (30min) (a) |
|
|
|
5 - 20µW |
|
|
|
|
5 - 30µW |
|
|
5 - 30µW |
|
|
|
2 - 10µW |
|
|
20 - 40µW |
|
|
|
|
|
|
|
|
|
|
||||||||||||||||||||||||||||||||||||||||||||||||||||||||||||||||||||||||||||||||||||||||||||||||||||||||||||||||||||||||||||||
|
|
|
Maximum Average Power Density kW/cm2 |
|
1 |
|
|
|
|
|
|
|
|
|
|
|
|
|
|
|
|
0.05 |
|
|
|
|
|
|
|
|
0.05 |
|
|
|
|
|
|
|
|
|
|
|
|
1 |
|
|
|
|
|
|
|
|
|
|
|
0.05 |
|
|
|
|
|
|
|
|
|
|
|
|
|
|
|
|
|
|
|
|
|
|
|
|
|
|||||||||||||||||||||||||||||||||||||||||||||||||||||||||||||||||||||||||||||
|
|
|
Response Time with Meter (0-95%) typ. s |
|
1.8 |
|
|
|
|
|
|
|
|
|
|
|
|
|
2.5 |
|
|
|
|
|
|
|
|
2.5 |
|
|
|
|
|
|
|
|
|
|
|
|
|
1.8 |
|
|
|
|
|
|
|
|
2.5 |
|
|
|
|
|
|
|
|
|
|
|
|
|
|
|
|
|
|
|
|
|
|
|
|
|
|
|||||||||||||||||||||||||||||||||||||||||||||||||||||||||||||||||||||||||||||||||
|
|
|
Power Accuracy +/-% |
|
3 |
|
|
|
|
|
|
|
|
|
|
|
|
|
|
|
|
3 |
|
|
|
|
|
|
|
|
|
|
|
|
8(c) |
|
3 |
|
|
|
|
|
|
|
|
|
|
|
3 |
|
|
|
|
|
|
|
|
|
|
|
|
|
|
|
|
|
|
|
|
|
|
|
|
|
|
|
|
|
|
|||||||||||||||||||||||||||||||||||||||||||||||||||||||||||||||||||||||||||||||
|
|
|
Linearity with Power +/-% |
|
1.5 |
|
|
|
|
|
|
|
|
|
|
|
|
|
1.5 |
|
|
|
|
|
|
|
|
1.5 |
|
|
|
|
|
|
|
|
|
|
|
|
|
1.5 |
|
|
|
|
|
|
|
|
1.5 |
|
|
|
|
|
|
|
|
|
|
|
|
|
|
|
|
|
|
|
|
|
|
|
|
|
|
|||||||||||||||||||||||||||||||||||||||||||||||||||||||||||||||||||||||||||||||||
|
|
Energy Mode |
|
|
|
|
|
|
|
|
|
|
|
|
|
|
|
|
|
|
|
|
|
|
|
|
|
|
|
|
|
|
|
|
|
|
|
|
|
|
|
|
|
|
|
|
|
|
|
|
|
|
|
|
|
|
|
|
|
|
|
|
|
|
|
|
|
|
|
|
|
|
|
|
|
|
|
|
|
|
|
|
|
|
|
|
|
|
|
|
|
|
|
|
|
|
|
|
|
|
|
|
|
|
|
|
|
|
|
|
|
|||||||||||||||||||||||||||||||||||||||||||||||
|
|
|
Energy Range |
|
|
|
20µJ - 2J |
|
|
|
|
20µJ - 2J |
|
20µJ - 2J |
|
|
|
15µJ - 2J |
|
|
20µJ - 2J |
|
|
|
|
|
|
|
|
|
||||||||||||||||||||||||||||||||||||||||||||||||||||||||||||||||||||||||||||||||||||||||||||||||||||||||||||||||||||||||||||||||
|
|
|
Energy Scales |
|
|
|
2J to 200µJ |
|
|
|
|
2J to 200µJ |
|
2J to 200µJ |
|
|
|
2J to 200µJ |
|
|
2J to 200µJ |
|
|
|
|
|
|
|
|
|
||||||||||||||||||||||||||||||||||||||||||||||||||||||||||||||||||||||||||||||||||||||||||||||||||||||||||||||||||||||||||||||||
|
|
|
Minimum Energy |
|
|
|
20µJ |
|
|
|
|
20µJ |
|
20µJ |
|
|
|
15µJ |
|
|
20µJ |
|
|
|
|
|
|
|
|
|
||||||||||||||||||||||||||||||||||||||||||||||||||||||||||||||||||||||||||||||||||||||||||||||||||||||||||||||||||||||||||||||||
|
|
|
Maximum Energy Density J/cm2 (e) |
|
|
|
|
|
|
|
|
|
|
|
|
|
|
|
|
|
|
|
|
|
|
|
|
|
|
|
|
|
|
|
|
|
|
|
|
|
|
|
|
|
|
|
|
|
|
|
|
|
|
|
|
|
|
|
|
|
|
|
|
|
|
|
|
|
|
|
|
|
|
|
|
|
|
|
|
|
|
|
|
|
|
|
|
|
|
|
|
|
|
|
|
|
|
|
|
|
|
|
|
|
|
|
|
|
|
|
|
|
||||||||||||||||||||||||||||||||||||||||||||||
|
|
|
|
|
|
<100ns |
0.3 |
|
|
|
|
|
|
|
|
|
|
|
1 |
|
|
|
|
|
|
|
|
|
|
|
0.1 |
|
|
|
|
|
|
|
|
|
|
|
|
0.3 |
|
|
|
|
|
|
1 |
|
|
|
|
|
|
|
|
|
|
|
|
|
|
|
|
|
|
|
|
|
|
|
|
|
|
|
|
|
|
|||||||||||||||||||||||||||||||||||||||||||||||||||||||||||||||||||||||||||||
|
|
|
|
|
|
0.5ms |
1 |
|
|
|
|
|
|
|
|
|
|
|
|
|
|
1 |
|
|
|
|
|
|
|
|
|
|
|
1 |
|
|
|
|
|
|
|
|
|
|
|
|
|
|
|
|
1 |
|
|
|
|
|
|
|
|
|
1 |
|
|
|
|
|
|
|
|
|
|
|
|
|
|
|
|
|
|
|
|
|
|
|
|
|
|
|
|
|
|
|||||||||||||||||||||||||||||||||||||||||||||||||||||||||||||||||||
|
|
|
|
|
|
2ms |
2 |
|
|
|
|
|
|
|
|
|
|
|
|
|
|
1 |
|
|
|
|
|
|
|
|
|
|
|
1 |
|
|
|
|
|
|
|
|
|
|
|
|
|
|
|
|
2 |
|
|
|
|
|
|
|
|
|
1 |
|
|
|
|
|
|
|
|
|
|
|
|
|
|
|
|
|
|
|
|
|
|
|
|
|
|
|
|
|
|
|||||||||||||||||||||||||||||||||||||||||||||||||||||||||||||||||||
|
|
|
|
|
|
10ms |
4 |
|
|
|
|
|
|
|
|
|
|
|
|
|
|
1 |
|
|
|
|
|
|
|
|
|
|
|
1 |
|
|
|
|
|
|
|
|
|
|
|
|
|
|
|
|
4 |
|
|
|
|
|
|
|
|
|
1 |
|
|
|
|
|
|
|
|
|
|
|
|
|
|
|
|
|
|
|
|
|
|
|
|
|
|
|
|
|
|
|||||||||||||||||||||||||||||||||||||||||||||||||||||||||||||||||||
|
|
Cooling |
|
|
|
convection |
|
|
|
|
convection |
|
convection |
|
|
|
convection |
|
|
convection |
|
|
|
|
|
|
|
|
|
|||||||||||||||||||||||||||||||||||||||||||||||||||||||||||||||||||||||||||||||||||||||||||||||||||||||||||||||||||||||||||||||||
|
|
Weight kg |
0.2 |
|
|
|
|
|
|
|
|
|
|
|
0.2 |
|
|
|
|
|
|
|
|
0.2 |
|
|
|
|
|
|
|
|
|
|
|
|
0.2 |
|
|
|
|
|
|
0.15 |
|
|
|
|
|
|
|
|
|
|
|
|
|
|
|
|
|
|
|
|
|
|
|
|
|
|||||||||||||||||||||||||||||||||||||||||||||||||||||||||||||||||||||||||||||||||||||||||
|
|
Fiber Adapters Available (see page 55) |
|
|
|
ST, FC, SMA, SC |
|
|
|
|
ST, FC, SMA, SC |
|
ST, FC, SMA, SC |
|
|
|
ST, FC, SMA, SC |
|
|
NA |
|
|
|
|
|
|
|
|
|
|||||||||||||||||||||||||||||||||||||||||||||||||||||||||||||||||||||||||||||||||||||||||||||||||||||||||||||||||||||||||||||||||
|
|
Version |
|
|
|
|
|
|
|
|
|
|
|
|
|
|
|
|
|
|
|
|
|
|
|
|
V1 |
|
|
|
|
|
|
|
|
|
|
|
|
|
|
|
|
|
|
|
|
|
|
|
|
|
|
|
|
|
|
|
|
|
|
|
|
|
|
|
|
|
|
|
|
|
|
|
|
|
|
|
|
|
|
|
|
|
|
|
|
|
|
|
|
|
|
|
|
|
|
|||||||||||||||||||||||||||||||||||||||||||||||||||||||||||||
|
|
Part number: Standard Sensor |
|
|
|
7Z02621 |
|
|
|
|
7Z02622 |
|
7Z02742 |
|
|
|
7Z02628 |
|
|
7Z02687 |
|
|
|
|
|
|
|
|
|
|||||||||||||||||||||||||||||||||||||||||||||||||||||||||||||||||||||||||||||||||||||||||||||||||||||||||||||||||||||||||||||||||
|
|
BeamTrack Sensor: Beam, Posivtion & Size (p. 49) |
|
|
|
7Z07934 |
|
|
|
|
7Z07935 |
|
|
|
|
|
|
|
|
|
|
|
|
|
|
|
|
|
|
|
|
|
|
|
|
|
|
|
|
|
|
|
|
|
|
|
|
|
|
|
|
|
|
|
|
|
|
|
|
|
|
|
|
|
|
|
|
|
|
|
|
|
|
|
|
|
|
|
|
|
|
|
||||||||||||||||||||||||||||||||||||||||||||||||||||||||||||||||||||||||||||
|
|
Note: (a) |
|
|
|
Depending on room airflow and temperature variations |
|
|
|
|
|
|
|
|
|
|
|
|
|
|
|
|
|
|
|
|
|
|
|
|
|
|
|
|
|
|
|
|
|
|
|
|
|
|
|
|
|
|
|
|
|
|
|
|
|
|
||||||||||||||||||||||||||||||||||||||||||||||||||||||||||||||||||||||||||||||||||||||||||||||||||||||
|
|
Note: (b) |
|
|
|
Remove window for measurement beyond 2.2µm |
|
|
|
|
|
|
|
|
|
|
|
|
|
|
|
|
|
|
|
|
|
|
|
|
|
|
|
|
|
|
|
|
|
|
|
|
|
|
|
|
|
|
|
|
|
|
|
|
|
|
|
|
|
|
|
|
|
|
|
|
|
|
|
|
|
|
|
|
|
|
||||||||||||||||||||||||||||||||||||||||||||||||||||||||||||||||||||||||||||||||||
|
|
Note: (c) |
|
|
|
2 sigma standard lab traceable for >0.6THz. For 0.5THz and below add 4% to error |
|
|
|
|
|
|
|
|
|
|
|
|
|
|
|
|
|
|
|
|
|
|
|
|
|
|
|
|
|
|
|
|
|
|
|
|||||||||||||||||||||||||||||||||||||||||||||||||||||||||||||||||||||||||||||||||||||||||||||||||||||||||||||||||||||
|
|
Note: (d) |
|
|
|
Back reflections from meter can sometimes cause interference effects with source. Unit should be tilted ~10o in this case. |
|
|
|
|
|
|
|
|
|
|||||||||||||||||||||||||||||||||||||||||||||||||||||||||||||||||||||||||||||||||||||||||||||||||||||||||||||||||||||||||||||||||||||||||||||||
|
|
Note: (e) For P type and shorter wavelengths derate |
|
|
|
Wavelength |
|
|
Derate to value |
|
|
|
|
|
|
|
|
|
|
|
|
|
|
|
|
|
|
|
|
|
|
|
|
|
|
|
|
|
|
|
|
|
|
|
|
|
|
|
|
|
|
|
|
|
|
|
|
|
|
|
|
|
|
|
|
|
|
|
|
|
|
|
|
|
|
|
|
|
|
|||||||||||||||||||||||||||||||||||||||||||||||||||||||||||||||||||||||||||||||
|
|
maximum energy density as follows: |
|
|
|
1064nm |
|
|
Not derated |
|
|
|
|
|
|
|
|
|
|
|
|
|
|
|
|
|
|
|
|
|
|
|
|
|
|
|
|
|
|
|
|
|
|
|
|
|
|
|
|
|
|
|
|
|
|
|
|
|
|
|
|
|
|
|
|
|
|
|
|
|
|
|
|
|
|
|
|
|
|
|||||||||||||||||||||||||||||||||||||||||||||||||||||||||||||||||||||||||||||||
|
|
|
|
|
|
|
|
|
|
|
|
|
|
|
|
|
|
|
|
|
|
|
|
|
|
|
|
|
|
|
|
|
|
|
|
|
|
|
|
|
|
|
|
|
|
|
|
|
|
|
|
|
532nm |
|
|
Not derated |
|
|
|
|
|
|
|
|
|
|
|
|
|
|
|
|
|
|
|
|
|
|
|
|
|
|
|
|
|
|
|
|
|
|
|
|
|
|
|
|
|
|
|
|
|
|
|
|
|
|
|
|
|
|
|
|
|
|
|
|
|
|
|
|
|
|
|
|
|
|
||||||||||||||||||||||||||||||||
|
|
|
|
|
|
|
|
|
|
|
|
|
|
|
|
|
|
|
|
|
|
|
|
|
|
|
|
|
|
|
|
|
|
|
|
|
|
|
|
|
|
|
|
|
|
|
|
|
|
|
|
|
355nm |
|
|
40% of stated value |
|
|
|
|
|
|
|
|
|
|
|
|
|
|
|
|
|
|
|
|
|
|
|
|
|
|
|
|
|
|
|
|
|
|
|
|
|
|
|
|
|
|
|
|
|
|
|
|
|
|
|
|
|
|
|
|
|
|
|
|
|
|
|
|
|
|
|
|
|
|
||||||||||||||||||||||||||||||||
|
|
|
|
|
|
|
|
|
|
|
|
|
|
|
|
|
|
|
|
|
|
|
|
|
|
|
|
|
|
|
|
|
|
|
|
|
|
|
|
|
|
|
|
|
|
|
|
|
|
|
|
|
266nm |
|
|
10% of stated value |
|
|
|
|
|
|
|
|
|
|
|
|
|
|
|
|
|
|
|
|
|
|
|
|
|
|
|
|
|
|
|
|
|
|
|
|
|
|
|
|
|
|
|
|
|
|
|
|
|
|
|
|
|
|
|
|
|
|
|
|
|
|
|
|
|
|
|
|
|
|
||||||||||||||||||||||||||||||||
|
|
|
|
|
|
|
|
|
|
|
|
|
|
|
|
|
|
|
|
|
|
|
|
|
|
|
|
|
|
|
|
|
|
|
|
|
|
|
|
|
|
|
|
|
|
|
|
|
|
|
|
|
193nm |
|
|
10% of stated value |
|
|
|
|
|
|
|
|
|
|
|
|
|
|
|
|
|
|
|
|
|
|
|
|
|
|
|
|
|
|
|
|
|
|
|
|
|
|
|
|
|
|
|
|
|
|
|
|
|
|
|
|
|
|
|
|
|
|
|
|
|
|
|
|
|
|
|
|
|
|
||||||||||||||||||||||||||||||||
|
|
Note: (f ) |
|
|
|
Lowest measurable powers are achieved by thermally quiet room conditions, using removable snout, averaging and offset subtraction. |
|
|
|
|
|
|
|
|
|
|||||||||||||||||||||||||||||||||||||||||||||||||||||||||||||||||||||||||||||||||||||||||||||||||||||||||||||||||||||||||||||||||||||||||||||||
3A |
|
|
|
|
|
|
|
|
|
|
|
|
|
|
|
|
|
|
|
|
|
|
|
|
|
|
|
|
|
|
|
|
|
|
|
|
|
|
|
|
|
|
|
|
|
|
|
|
|
|
|
|
|
|
|
|
|
|
|
|
|
|
|
|
|
|
|
|
|
|
|
|
|
|
|
|
|
|
|
|
|
|
|
|
|
|
|
|
|
|
|
|
|
|
|
|
|
|
|
|
|
|
|
|
|
|
|
|
|
|
|
|
|
|
|
|
|
|
|
|
|
|
|
|
|
|
|
|
|
|
||||||||||||||||||||||||||||
|
|
|
|
|
|
|
|
|
|
|
|
|
|
|
|
|
|
|
|
|
|
|
|
|
|
|
|
|
|
|
|
|
|
|
|
|
|
|
|
|
|
|
|
3A-P / 3A-P-THz |
|
|
|
|
|
|
|
|
|
|
|
|
|
|
3A-FS |
|
|
|
|
|
|
|
|
|
|
|
|
|
|
|
|
|
|
|
|
|
|
|
|
|
|
|
|
|
|
|
3A-P-FS-12 |
|
|
|
|
|
|
|
|
|
||||||||||||||||||||||||||||||||||||||||||||||||||||||||||
|
|
|
|
|
|
|
|
|
|
|
|
|
|
|
|
|
|
|
|
|
|
|
|
|
|
|
|
|
|
|
|
|
|
|
|
|
|
|
|
|
|
|
|
|
|
|
|
|
|
|
|
|
|
|
|
|
|
|
|
|
|
|
|
|
|
|
|
|
|
|
|
|
|
|
|
|
|
|
|
|
|
|
|
|
|
|
|
|
|
|
|
|
|
|
|
|
|
|
|
|
|
|
|
|
|
|
|
|
|
|
|
|
|
|
|
|
|
|
|
|
|
|
|
|
|
|
|
|
|
|
|
|
|
|
|
|
|
|
|
|
|
|
|
|
|
|
|
|
|
|
|
|
|
|
|
|
|
|
|
|
|
|
|
|
|
|
|
|
|
|
|
|
|
|
|
|
|
|
|
|
|
|
|
|
|
|
|
|
|
|
|
|
|
|
|
|
|
|
|
|
|
|
|
|
|
|
|
|
|
|
|
|
|
|
|
|
|
|
|
|
|
|
|
|
|
|
|
|
|
|
|
|
|
|
|
|
|
|
|
|
|
|
|
|
|
|
|
|
|
|
|
|
|
|
|
|
|
|
|
|
|
|
|
|
|
|
|
|
|
|
|
|
|
|
|
|
|
|
|
|
|
|
|
|
|
|
|
|
|
|
|
|
|
|
|
|
|
|
|
|
|
|
|
|
|
|
|
|
|
|
|
|
|
|
|
|
|
|
|
|
|
|
|
|
|
|
|
|
|
|
|
|
|
|
|
|
|
|
|
|
|
|
|
|
|
|
|
|
|
|
|
|
|
|
|
|
|
|
|
|
|
|
|
|
|
|
|
|
|
|
|
|
|
|
|
|
|
|
|
|
|
|
|
|
|
|
|
|
|
|
|
|
|
|
|
|
|
|
|
|
|
|
|
|
|
|
|
|
|
|
|
|
|
|
|
|
|
|
|
|
|
|
|
|
|
|
|
|
|
|
|
|
|
|
|
|
|
|
|
|
|
|
|
|
|
|
|
|
|
|
|
|
|
|
|
|
|
|
|
|
|
|
|
|
|
|
|
|
|
|
|
|
|
|
|
|
|
|
|
|
|
|
|
|
|
|
|
|
|
|
|
|
|
|
|
|
|
|
|
|
|
|
|
|
|
|
|
|
|
|
|
|
|
|
|
|
|
|
|
|
|
|
|
|
|
|
|
|
|
|
|
|
|
|
|
|
|
|
|
|
|
|
|
|
|
|
|
|
|
|
|
|
|
|
|
|
|
|
|
|
|
|
|
|
|
|
|
|
|
|
|
|
|
|
|
|
|
|
|
|
|
|
|
|
|
|
|
|
|
|
|
|
|
|
|
|
|
|
|
|
|
|
|
|
|
|
|
|
|
|
|
|
|
|
|
|
|
|
|
|
|
|
|
|
|
|
|
|
|
|
|
|
|
|
|
28
01.04.2014 |
|
For latest updates please visit our website: www.ophiropt.com/photonics |
|