

laser_measurement_instruments_catalog
.pdfBeam Measurements and Statistics
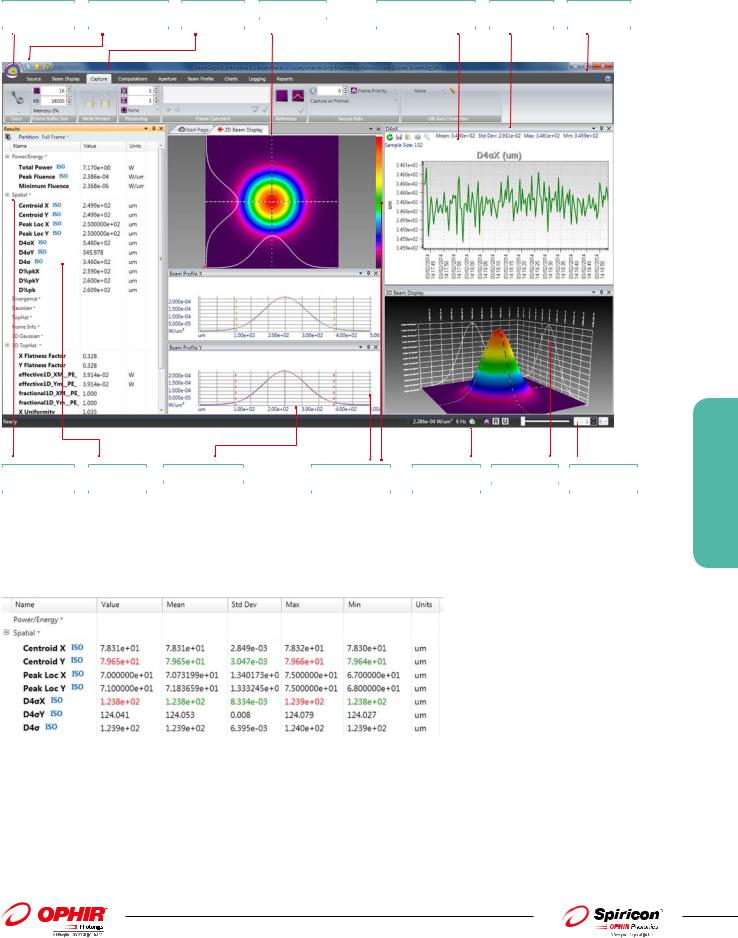
BeamGage allows you to configure as many measurements as needed to support your work, and comes standard with over 55 separate measurement choices. To distinguish between calculations that are based on ISO standards and those that are not, a graphical ISO logo is displayed next to appropriate measurements. You can also choose to perform statistical calculations on any parameter in the list.
Small sample of possible measurements |
Sample of calculation results with statistics applied |
out of a list of 55 |
|
3.2.1.1 Beam Analysis
119
For latest updates please visit our website: www.ophiropt.com/photonics |
|
01.04.2014 |

Multiple Charting Options
You can create strip charts for stability observations on practically any of the calculations options available. (See next page for sample listing). Charts enable tracking of short or long term stability of your laser.
Strip chart of beam D4sigma width. Note how changing conditions affects the width repeatability.
Beam intensity changed over 10db, making noise a significant factor in measurement stability.
Beam Pointing Stability
Open the Pointing Stability Window to collect centroid and peak data from the core system and display it graphically. View a chart recorder and statistical functions in one interface:
3.2.1.1 Beam Analysis
Peak location scatter plot with histogram color-coding.
Set a sample limit, and specify the results items to graph on the strip chart.
The radius is referenced from either an Origin established in BeamGage or from the continuously calculated Average Centroid position.
A centroid location scatter plot with histogram colorcoding.
A pointing stability strip chart presents data over time for the Centroid X and Y, Peak
X and Y and centroid radius from an origin or from the mean centroid.
Easy to Use and Powerful
BeamGage is the only beam profiler on the market using modern Windows Vista and Windows 7 navigation tools. The menu system of BeamGage is easy to learn and easy to use with most controls only one mouse click away. Some ribbon toolbar examples:
Some of the Beam Display options (Display access options under the Tools tab on the left).
Some of the Beam Capture options.
Beam Profile
120
01.04.2014 |
|
For latest updates please visit our website: www.ophiropt.com/photonics |
|
BeamGage Main Display Screen
File Save/Load |
|
Quick Access Toolbar |
|
Tabbed Control |
|
2D Beam Display |
|
Tool Windows that dock |
|
User Definable |
|
Integrated Help |
ApplicationButton |
|
for common tasks |
|
Access |
|
|
|
inside or float outside App |
|
Window Layout |
|
System |
|
|
|
|
|||||||||
|
|
|
|
|
|
|
|
|
|
|
|
|
Beam Results With |
|
ISO Compliant |
|
1D Profiling Options |
|
Cursors With Power / |
|
Processing Status |
|
3D Beam Display |
|
Buffered Video |
Statistics |
|
Results |
|
|
|
Energy Readouts |
|
Indicators |
|
|
|
Scrolling Controls |
|
|
|
|
|
||||||||
|
|
|
|
|
|
|
||||||
|
|
|
|
|
|
|
|
|
|
|
|
|
Pass / Fail with Password Protection for Production Testing
BeamGage allows the user to configure the displayed calculations; set-up the screen layout and password protect the configuration from any changes. This permits secure product testing as well as data collection for Statistical Process Control (SPC), all while assuring the validity of the data.
Failures (or successes) can be the impetus for additional actions including a TTL output signal or PC beep and the termination of further data acquisition.
3.2.1.1 Beam Analysis
121
For latest updates please visit our website: www.ophiropt.com/photonics |
|
01.04.2014 |

Camera Compatibility
For lasers between 190-1320nm wavelenghts, BeamGage interfaces to silicon CCD Firewire (1394) and USB cameras. For applications between 1440-1605nm, BeamGage supports cost effective phosphor coated CCD cameras. For demanding applications between 900-1700nm, BeamGage supports an InGaAs camera. And for applications in the ultraviolet, 13-355nm, or far infrared or Terahertz range, 1.06-3000nm, BeamGage supports Spiricon’s Pyrocam III, pyroelectric array camera.
190-1100nm
Model |
|
SP503U |
|
SP620U |
|
GRAS20 |
|
Gevicam |
L11059 |
|
|
|
|
|
|
|
|
|
|
Spectral Response nm |
190 - 1100nm* |
190 - 1100nm* |
190 - 1100nm* |
190 - 1100nm* |
190 - 1100nm* |
||||
Application |
|
½” format, slim profile, |
|
1/1.8” format, high |
|
1/1.8” format, high |
|
1/1.8” format, high |
36mm x 24mm, 35mm |
|
|
wide dynamic range, |
|
resolution, wide |
|
resolution, CW YAG, |
|
resolution, networkable, |
format for large beams, |
|
|
CW & pulsed |
|
dynamic range, |
|
adjustable ROI |
|
long cable distances, |
CW YAG, Adjustable ROI |
|
|
lasers, adjustable ROI |
|
pulsed lasers, CW YAG, |
|
|
|
adjustable ROI |
|
|
|
|
|
adjustable ROI |
|
|
|
|
|
Number of Elements |
|
640 x 480 |
|
1600 x 1200 |
|
1600 x 1200 |
|
1600 x 1200 |
4008 x 2672 |
Interface Style |
|
USB |
|
USB |
|
Firewire 1394b |
|
Gigbit Ethernet |
USB |
Windows OS support |
|
Windows 7 (32/64), OR Vista (32/64) |
|
|
|
|
|
||
*Although our silicon cameras have shown response out to 1320mn it can cause significant blooming which could lead to significant errors of beam width measurements. We would suggest our XC13 InGaAs camera for these wavelengths to give you the best measurements.
1440-1605nm
3.2.1.1 Beam Analysis
Model |
|
SP503U-1550 |
|
SP620U-1550 |
|
GRAS20-1550 |
||
|
|
|
|
|
|
|
|
|
Spectral Response nm |
1440 - 1605nm |
1440 - 1605nm |
1440 - 1605nm |
|||||
Application |
|
NIR wavelengths, ½” format, |
|
NIR wavelengths, 1/1.8” |
|
NIR wavelengths, 1/1.8” |
||
|
|
low resolution |
|
format, low resolution, |
|
format, adjustable ROI |
||
|
|
|
|
adjustable ROI and binning |
|
|
||
Number of Elements |
|
640 x 480 |
|
1600 x 1200 |
|
1600 x 1200 |
||
Interface Style |
|
USB |
|
USB |
|
Firewire 1394b |
||
Windows OS support |
|
Windows 7 (32/64), OR Vista (32/64) |
|
|
|
|
||
|
|
|
||||||
|
|
|
|
|
|
|
|
|
900-1700nm |
|
|
|
|||||
|
13-355nm & 1.06-3000µm |
|||||||
Model |
XEVA 100Hz |
|
Model |
Pyrocam III |
Pyrocam IV |
|
|
|
|
|
|
|
|
Spectral Response |
900 - 1700nm |
|
Spectral Response nm |
13-355nm & 1.06-3000µm |
13-355nm & 1.06-3000µm |
|
Application |
High resolution InGaAS |
Application |
UV & Far IR Only commercial |
UV & Far IR Only |
|
|
|
performance, NIR |
|
|
array to view Terahertz |
commercial array to view |
|
|
wavelengths |
|
|
|
Terahertz |
|
Number of Elements |
320 x 256 |
Number of Elements |
124 x 124 |
320 x 320 |
|
|
Interface Style |
USB 2.0 |
Interface Style |
Firewire 1394a |
GigE |
|
|
Windows OS support |
Windows 7 (32\, OR Vista (32/64) |
Windows OS support |
Windows 7 (32/64), OR Vista (32/64) |
|
||
122
01.04.2014 |
|
For latest updates please visit our website: www.ophiropt.com/photonics |
|
Unique Features of BeamGage - Standard
Power/Energy Calibration
Using the USB output from select Ophir power/energy meters, the BeamGage application will display measured power/energy values from the full range of Ophir thermopile, photodiode and pyroelectric sensors. Pulsed lasers can be synced up to 100Hz, or the frame rate of the triggered camera, whichever is less. This is the first time in the
industry a laser power meter has been married to a laser beam profile system.
BeamGage is the only product to integrate profiling and power meter measurements
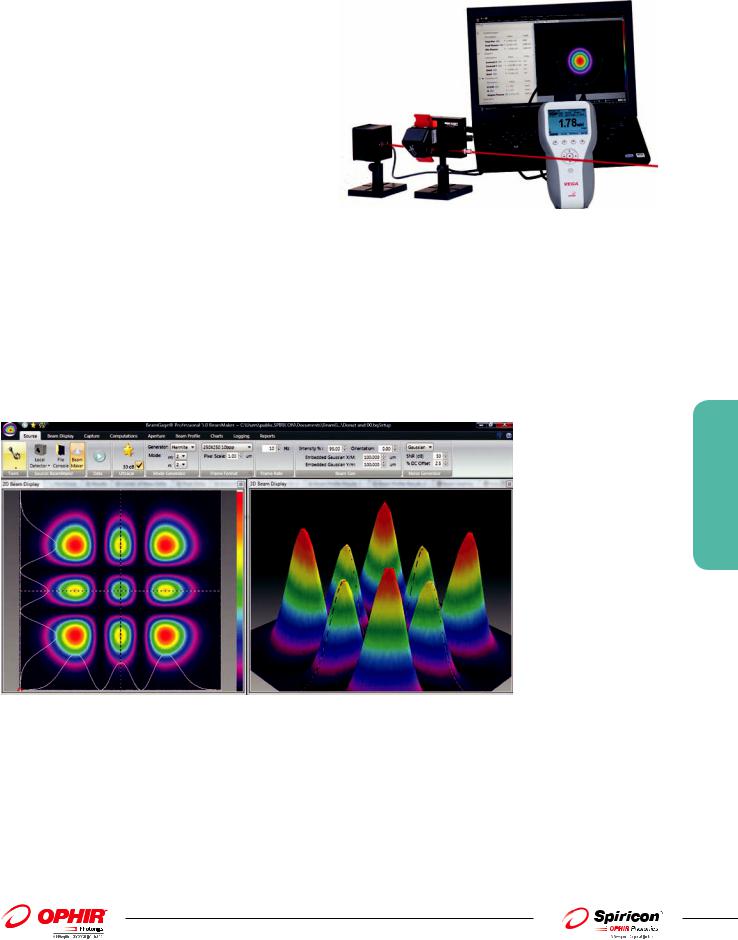
BeamMaker®; Numerical Beam Profile Generator
BeamGage contains a utility, BeamMaker, that can synthetically generate beam profile data by modeling either Laguerre, Hermite or donut laser beams in various modal configurations. BeamMaker permits the user to model a beam profile by specifying the mode, size, width, height, intensity, angle, and noise content. Once generated the user can then compare the theoretically derived measurements to measurements including experimental inaccuracies produced by the various measurement instruments and environmental test
conditions. Users can now analyze expected results and confirm if measurement algorithms will accurately measure the beam even before the experiment is constructed. BeamMaker can help laser engineers, technicians and researchers understand a beam’s modal content
by calculating results on modeled beams for a better understanding of real laser beam profiles. BeamMaker is to laser beam analysis as a function generator is to an oscilloscope.
3.2.1.1 Beam Analysis
BeamMaker producing a synthetically generated Hermite TEM22 beam and displayed in both 2D and 3D
Integrated automatic Help linked into the Users Guide
Touch sensitive Tool tips are available on most all controls, and "What’s This" help can provide additional details. Confused about what something is or forgot how it works, just go to the top right corner and touch the "What’s This" help icon, drag it and right click on the control or menu item that you want more info about and you are taken to the explanation within the BeamGage Users Guide.
Multilingual
BeamGage comes with both Japanese and Chinese user interface. Country specific manuals can be downloaded from the ophiropt.com/photonics web site.
123
For latest updates please visit our website: www.ophiropt.com/photonics |
|
01.04.2014 |

3.2.1.2 BeamGage®-Professional
Professional is an upgrade version of BeamGage-Standard that has all of the BeamGage-Standard features plus additional functionality.
Image Partitioning
Partitioning allows the user to subdivide the camera image into separate regions, called partitions, and compute separate beam results within each partition. When using partitioning special results items can be displayed that relate to delta values between the computed centroids or peaks of each partition. Partitioning is useful to enable separate analysis of individual beams when multiple beams impinge on the camera simultaneously. This feature is particularly useful when analyzing multiple fibers in a single bundle.
3.2.1.2 Beam Analysis
124
Shown is an example of the results for partition P2 and its related display frame. Observe that the selected partition is highlighted in RED. The crosshair in each partition is user controlled. The crosshair can be moved to a new position with the mouse or can be numerically positioned using the expanded controls that appear when a partition is created.
Automation Interface
BeamGage Professional provides an automation interface via .Net components to allow customers the ability to build custom applications’ that incorporate the laser beam analysis and processing power of BeamGage. The BeamGage automation interface allows developers
to control BeamGage programmatically via a set of “puppet strings” known as the automation interface. The automation interface was developed to provide the ability to base control decisions for a second application on results and behaviors recognized by BeamGage. With this ability users can quickly and efficiently meet their manufacturing/analysis goals with minimum human interaction.
The automation interface was designed to achieve two main goals. First, to allow the BeamGage user to programmatically do what they could otherwise do via the graphical user interface (GUI). Second, to expose stable interfaces to the user that will not change, causing breaks to their dependant code. Interface examples for LabVIEW, Excel and .Net VB are included.
Custom Calculations
If BeamGage-Standard does not have the measurement you need the Professional and Enterprise versions permit the user to program-in their own set of calculations. User defined computations are treated the same as other BeamGage standard calculations.
These custom results are displayed on the monitor, logged with results, and included on hard copy print-outs as if they were part of the original application.
An example of a customer generated custom equation.
01.04.2014 |
|
For latest updates please visit our website: www.ophiropt.com/photonics |
|

Custom results with statistics
Customer added custom calculation
Custom results being plotted |
|
Custom results with pass/fail turned on |
3.2.1.3 BeamGage®-Enterprise
Enterprise is an upgrade version of BeamGage-Professional that has all of the BeamGage-Standard and -Professional features plus additional functionality.
Networking
BeamGage Enterprise Edition allows cameras to be accessed and shared over an Ethernet local area network (LAN) that shares a common domain. The LAN environment can be a common company-wide system as shown.
Performance will be improved if the PC’s that will be sharing camera video are isolated or reside on a branch of the network that will exclude it from general network traffic.
3.2.1.3 Beam Analysis
125
For latest updates please visit our website: www.ophiropt.com/photonics |
|
01.04.2014 |

3.2.1.4 Beam Analysis
126
3.2.1.4 Software Comparison Chart
Features |
BeamGage® Standard |
|
BeamGage® Professional |
|
BeamGage® Enterprise |
||||
|
|
|
|
|
|
|
(all features in Standard plus) |
|
(all features in Pro plus) |
|
|
|
|
|
|
|
|
||
Features Overview |
User selectable for either best “accuracy”or “ease of use” |
|
|
|
|
||||
|
|
|
Supports our patented Ultracal algorithm plus |
|
|
|
|
||
|
|
|
Auto-setup and Auto-exposure capabilities |
|
|
|
|
||
|
|
|
Extensive set of ISO quantitative measurements |
|
|
|
|
||
|
|
|
Support for USB, Firewire and Pyrocam III and |
|
Supports InGaAs cameras |
|
Supports Gig-E cameras |
||
|
|
|
Pyrocam IV cameras. |
|
|
||||
|
|
|
|
|
|
|
|||
|
|
|
New Beam Maker® beam simulator for algorithm self |
|
|
|
|
||
|
|
|
validation. See below for more detailed description. |
|
|
|
|
||
|
|
|
Simultaneous 2D and 3D displays |
|
|
|
|
||
|
|
|
Multi-instance, multi-camera use |
|
|
|
|
||
|
|
|
|
|
|
|
|
|
Supports networked USB |
|
|
|
|
|
|
|
|
|
Firewire, Pyrocam III, Pyrocam IV |
|
|
|
|
|
|
|
|
|
and Gig-E. |
|
|
|
Results synchronised to select models of Ophir power/ |
|
|
|
|
||
|
|
|
energy meters. Supported products include: Vega, |
|
|
|
|
||
|
|
|
Nova II, Pulsar, USBI and Juno, in both 32 and 64bit OS. |
|
|
|
|
||
|
|
|
(Quasar is not supported) |
|
|
|
|
||
|
|
|
Supports Satellite windows on multiple monitors |
|
|
|
|
||
|
|
|
Continuous zoom scaling in both 2D and 3D |
|
|
|
|
||
|
|
|
|
|
|
|
Window partitioning to allow |
|
|
|
|
|
|
|
|
|
analysis of multiple beams |
|
|
|
|
|
|
|
|
|
from a single camera image |
|
|
|
|
|
Camera ROI support on USB and Firewire cameras |
|
|
|
|
||
|
|
|
Manual and Auto-aperturing to reduce background effects |
|
|
|
|
||
|
|
|
Pass/Fail on all results items, w/multiple alarm options |
|
|
|
|
||
|
|
|
Beam Pointing Stability scatter plot and stripchart results |
|
|
|
|
||
|
|
|
Full featured logging capabilities in a reloadable |
|
|
|
|
||
|
|
|
industry standard data file format |
|
|
|
|
||
|
|
|
Configurable Report Generator that allows cut and |
|
|
|
|
||
|
|
|
paste of results, images and settings. |
|
|
|
|
||
|
|
|
|
|
|
|
NET Automation interface that allows for remote control |
||
|
|
|
|
|
|
|
Examples in LabView, Excel and .Net VB |
||
|
|
|
Supports English, German, Japanese and Chinese |
|
|
|
|
||
|
|
|
Windows OS in both 32 and 64bit. |
|
|
|
|
||
|
|
|
Multilingual GUI in English, Japanes and Chinese. |
|
|
|
|
||
Quantitative Calculations; Basic Results |
|
(per ISO 11145, 11146-1/-3, and 13694) |
|
|
|
|
|||
Power/Energy Results |
Total power or energy (Can be calibrated or sync’d to |
|
|
|
|
||||
|
|
|
an external Ophir power/energy meter) |
|
|
|
|
||
|
|
|
Peak power/energy density |
|
|
|
|
||
|
|
|
Min. Fluence |
|
|
|
|
||
|
|
|
Average pulse power |
|
|
|
|
||
|
|
|
Peak pulse power |
|
|
|
|
||
|
|
|
Device efficiency |
|
|
|
|
||
|
|
|
% in Aperture |
|
|
|
|
||
Spatial Results |
Peak and Centroid locations |
|
|
|
|
||||
|
|
|
|
Beam width |
|
|
|
|
|
|
|
|
ֺ |
Second Moment (D4s) |
|
|
|
|
|
|
|
|
ֺ |
Knife Edge 90/10 |
|
|
|
|
|
|
|
|
ֺ |
Knife Edge (User selectable level) |
|
|
|
|
|
|
|
|
ֺ |
Percent of Peak (User selectable) |
|
|
|
|
|
|
|
|
ֺ |
Percent of Total Energy (User selectable) |
|
|
|
|
|
|
|
|
ֺ |
Encircled power smallest slit @ 95.4 |
|
|
|
|
|
|
|
|
ֺ |
Moving slit (User selectable) |
|
|
|
|
|
|
|
|
|
Beam diameter |
|
|
|
|
|
|
|
|
ֺ Average diameter (based on x/y widths) |
|
|
|
|
||
|
|
|
ֺ |
Second Moment (D4s) |
|
|
|
|
|
|
|
|
ֺ |
Encircled power smallest aperature 86.5 |
|
|
|
|
|
|
|
|
ֺ |
Encircled power smallest aperature (User selectable level) |
|
|
|
|
|
01.04.2014 |
|
For latest updates please visit our website: www.ophiropt.com/photonics |
|

|
Features |
BeamGage® Standard |
|
|
BeamGage® Professional |
|
|
BeamGage® Enterprise |
|
||||||
|
|
|
|
|
|
|
|
|
(all features in Standard plus) |
|
|
(all features in Pro plus) |
|
||
|
|
|
|
|
|
|
|
|
|
|
|
|
|
|
|
|
|
|
|
Elliptical Results |
|
|
|
|
|
|
|
|
|
||
|
|
|
|
ֺ |
Elliptical orientation |
|
|
|
|
|
|
|
|
|
|
|
|
|
|
ֺ |
Ellipticity |
|
|
|
|
|
|
|
|
|
|
|
|
|
|
ֺ |
Eccentricity |
|
|
|
|
|
|
|
|
|
|
|
|
|
|
Distance Measurement |
|
|
|
|
|
|
|
|
|
||
|
|
|
|
ֺ |
Cursor to Crosshair |
|
|
|
|
|
|
|
|
|
|
|
|
|
|
ֺ |
Centroid to Crosshair |
|
|
|
|
|
|
|
|
|
|
|
|
|
|
Area Results |
|
|
|
|
|
|
|
|
|
||
|
|
|
|
Beam cross-sectional area |
|
|
|
|
|
|
|
|
|
||
|
Divergence |
Focal Length method |
|
|
|
|
|
|
|
|
|
||||
|
|
|
|
Far-field two-point method |
|
|
|
|
|
|
|
|
|
||
|
|
|
|
Far-field Wide Angle method |
|
|
|
|
|
|
|
|
|
||
|
Gaussian Fit |
2D whole beam fits |
|
|
|
|
|
|
|
|
|
||||
|
|
|
|
1D line fits |
|
|
|
|
|
|
|
|
|
||
|
|
|
|
Height |
|
|
|
|
|
|
|
|
|
||
|
|
|
|
Width X/Y |
|
|
|
|
|
|
|
|
|
||
|
|
|
|
Centroid |
|
|
|
|
|
|
|
|
|
||
|
|
|
|
Goodness of fit |
|
|
|
|
|
|
|
|
|
||
|
|
|
|
Roughness of fit |
|
|
|
|
|
|
|
|
|
||
|
Tophat Results |
2D and 1D |
|
|
|
|
|
|
|
|
|
||||
|
|
|
|
Flatness |
|
|
|
|
|
|
|
|
|
||
|
|
|
|
Effective Area |
|
|
|
|
|
|
|
|
|
||
|
|
|
|
Effective Power/Energy |
|
|
|
|
|
|
|
|
|
||
|
|
|
|
Fractional Effective Power/Energy |
|
|
|
|
|
|
|
|
|
||
|
|
|
|
Effective Average Fluence |
|
|
|
|
|
|
|
|
|
||
|
|
|
|
Uniformity |
|
|
|
|
|
|
|
|
|
||
|
|
|
|
Plateau Uniformity |
|
|
|
|
|
|
|
|
|
||
|
|
|
|
Edge Steepness |
|
|
|
|
|
|
|
|
|
||
|
|
|
|
1D or 2D surface inclination |
|
|
|
|
|
|
|
|
|
||
|
Other Quantitative Items |
Frame Averaging |
|
|
|
|
|
|
|
|
|
||||
|
|
|
|
Frame Summing |
|
|
|
|
|
|
|
|
|
||
|
|
|
|
Frame Reference Subtraction |
|
|
|
|
|
|
|
|
|
||
|
|
|
|
Image Convolution |
|
|
|
|
|
|
|
|
|
||
|
|
|
|
Camera signal/noise calculator |
|
|
|
|
|
|
|
|
|
||
|
|
|
|
Row and Column summing with results loggable |
|
|
|
|
|
|
|
|
|
||
|
|
|
|
|
|
|
|
|
Scalable Intensity Histogram, |
|
|
|
|
|
|
|
|
|
|
|
|
|
|
|
exportable |
|
|
|
|
|
|
|
|
|
|
|
|
|
|
|
|
|
|
|
|
|
|
|
|
|
|
|
|
|
|
|
X or Y axial off axis image |
|
|
|
|
|
|
|
|
|
|
|
|
|
|
|
|
|
|
|
|
|
|
|
Beam Stability Displays and Results |
(per ISO 11670) |
|
|
correction |
|
|
|
|
|
|||||
|
|
|
|
|
|
|
|
|
|
||||||
|
|
|
|
Pointing Stabilty of Centroid |
|
|
|
|
|
|
|
|
|
||
|
|
|
|
ֺ |
Scatter Plot display w/histogram |
|
|
|
|
|
|
|
|
|
|
|
|
|
|
ֺ |
Mean Centroid |
|
|
|
|
|
|
|
|
|
|
|
|
|
|
ֺ |
Azimuth angle of the scatter |
|
|
|
|
|
|
|
|
|
|
|
|
|
|
ֺ |
Stability (M’/m’/S) |
|
|
|
|
|
|
|
|
|
|
|
|
|
|
ֺ |
Max Radius |
|
|
|
|
|
|
|
|
|
|
|
|
|
|
ֺ |
X/Y centroid/peak Strip chart plots |
|
|
|
|
|
|
|
|
|
|
|
|
|
|
ֺ |
Sample/Time controlled |
|
|
|
|
|
|
|
|
|
|
|
|
|
|
ֺ |
Pass/Fail limits |
|
|
|
|
|
|
|
|
|
|
|
|
|
|
ֺ |
Auto scaling |
|
|
|
|
|
|
|
|
|
|
|
|
|
|
ֺ |
Beam Width/Diameter Strip Charts with Results |
|
|
|
|
|
|
|
|
|
|
|
|
|
|
ֺ |
X/Y M/m beam widths plots |
|
|
|
|
|
|
|
|
|
|
|
|
|
|
ֺ |
Beam Diameter plot |
|
|
|
|
|
|
|
|
|
|
|
|
|
|
ֺ |
Mean/Std Dev/Min/Max results displayed |
|
|
|
|
|
|
|
|
|
|
|
|
|
|
ֺ |
Power/Energy Strip Charts |
|
|
|
|
|
|
|
|
|
|
|
|
|
|
ֺ |
Total Power/Energy plot |
|
|
|
|
|
|
|
|
|
|
|
|
|
|
ֺ |
Peak fluence plot |
|
|
|
|
|
|
|
|
|
|
|
|
|
|
ֺ |
Avg Power plot |
|
|
|
|
|
|
|
|
|
|
|
|
|
|
ֺ |
Elliptical Results Strip Chart |
|
|
|
|
|
|
|
|
|
|
|
|
|
|
ֺ |
Elliptical orientation plot |
|
|
|
|
|
|
|
|
|
|
|
|
|
|
ֺ |
Ellipticity plot |
|
|
|
|
|
|
|
|
|
|
|
|
|
|
ֺ |
Eccentricity plot |
|
|
|
|
|
|
|
|
|
|
|
|
|
|
ֺ |
Mean/Std Dev/Min/Max results displayed |
|
|
|
|
|
|
|
|
|
|
|
Custom Calculations |
User can program-in own set of calculations |
|
|
|
|
|
|
|
|
|
||||
|
Beam Profile Display Options |
Utilizes advanced hardware accelerated graphics |
|
|
|
|
|
|
|
|
|
||||
|
|
|
|
engines. All display windows can be satellited to |
|
|
|
|
|
|
|
|
|
||
|
|
|
|
utilize multiple display monitors. |
|
|
|
|
|
|
|
|
|
||
|
|
|
|
Can open one each simulaneous 2D and 3D beam |
|
|
|
|
|
|
|
|
|
||
|
|
|
|
display windows |
|
|
|
|
|
|
|
|
|
||
|
|
|
|
Common color palette for 2D and 3D displays |
|
|
|
|
|
|
|
|
|
||
|
|
|
|
Can open X and/or Y 1D beam slice profiles overlaid |
|
|
|
|
|
|
|
|
|
||
|
|
|
|
onto the 2D or 3D displays or in separate windows |
|
|
|
|
|
|
|
|
|
||
3.2.1.4 Beam Analysis
127
For latest updates please visit our website: www.ophiropt.com/photonics |
|
01.04.2014 |

3.2.1.4 Beam Analysis
128
Features |
BeamGage® Standard |
|
|
BeamGage® Professional |
|
BeamGage® Enterprise |
|
|
|
|
|
|
(all features in Standard plus) |
|
(all features in Pro plus) |
|
|
|
|
|
|
|
|
|
Continuous software zooming in both 1D, 2D and |
|
|
|
|
|
|
|
3D displays |
|
|
|
|
|
|
|
Pan to any detector location |
|
|
|
|
|
|
|
Continuous Z axis display magnitude scaling |
|
|
|
|
|
|
|
Multiple 128 color palettes user selectable |
|
|
|
|
|
|
|
Results items can be pasted into 2D, 3D, 1D, Pointing |
|
|
|
|
|
|
|
stability or Chart display windows. |
|
|
|
|
|
|
|
|
|
|
|
Able to partition the camera |
|
|
|
|
|
|
|
imager into multiple regions |
|
|
|
|
|
|
|
with separate results. |
|
|
1D Features |
Available overlaid with 2D and 3D or in separate windows |
|
|
|
|
|
|
|
X any Y plots on separate or combined displays |
|
|
|
|
|
|
|
1D displays with basic results and column row |
|
|
|
|
|
|
|
summing option |
|
|
|
|
|
|
|
Tophat 1D displays with Tophat results |
|
|
|
|
|
|
|
Gaussian 1D displays with Gaussian fit results |
|
|
|
|
|
|
|
1D Profile display of the Gauss fit results on 1D, 2D |
|
|
|
|
|
|
|
and 3D displays |
|
|
|
|
|
|
2D Features |
Continuously zoomable and resizable displays in |
|
|
|
|
|
|
|
satellitable window |
|
|
|
|
|
|
|
Continuous Z axis display magnitude scaling |
|
|
|
|
|
|
|
Zoomable to subpixel resolution for origin and cursor |
|
|
|
|
|
|
|
placements |
|
|
|
|
|
|
|
Pixel boundaries delinated at higher zoom magnifications |
|
|
|
|
|
|
|
Adjustable Cursors that can track peak or centroid |
|
|
|
|
|
|
|
Adjustable Crosshairs that can track peak or centroid |
|
|
|
|
|
|
|
Adjustable manual apertures |
|
|
|
|
|
|
|
Viewable Auto-aperture placement |
|
|
|
|
|
|
|
Displayed beam width marker |
|
|
|
|
|
|
|
Integrated Mouse actuated pan/zoom controls |
|
|
|
|
|
|
|
Separate 2D pan/zoom window to show current |
|
|
|
|
|
|
|
view in 2D beam display |
|
|
|
|
|
|
|
Manual or fixed origin placement |
|
|
|
|
|
|
|
|
|
|
|
Ability to create partitions using |
|
|
3D Features |
3D graphics utilize solid surface construction with |
|
|
the manual aperture controls |
|
|
|
|
|
|
|
|
|||
|
lighting and shading effects |
|
|
|
|
|
|
|
Integrated Mouse actuated pan/zoom/tilt/rotate controls |
|
|
|
|
|
|
|
Selectable Mesh for drawing speed vs resolution control |
|
|
|
|
|
|
|
Continuously zoomable and resizable displays in |
|
|
|
|
|
|
|
satellitable window |
|
|
|
|
|
|
|
Continuous Z axis display magnitude scaling |
|
|
|
|
|
|
Partitioning |
User enabled backplanes with cursor projections |
|
|
Users can subdivide the |
|
|
|
|
|
|
|
|
|
||
|
|
|
|
|
imager into separate beam |
|
|
|
|
|
|
|
measurement regions. All |
|
|
|
|
|
|
|
enabled results are computed |
|
|
|
|
|
|
|
inside of each partition |
|
|
|
|
|
|
|
The manual aperture is |
|
|
|
|
|
|
|
used to define and create |
|
|
|
|
|
|
|
rectangular partition |
|
|
|
|
|
|
|
When partitioning is enabled |
|
|
|
|
|
|
|
some new results items will |
|
|
|
|
|
|
|
be enabled |
|
|
|
|
|
|
|
Centroid measurements |
|
|
|
|
|
|
|
between beams in each |
|
|
|
|
|
|
|
partition can be performed |
|
|
|
|
|
|
|
Partitioned imagers must |
|
|
|
|
|
|
|
have a single origin common |
|
|
|
|
|
|
|
to all partitions. All coordinate |
|
|
|
|
|
|
|
results are globally referenced |
|
|
|
|
|
|
|
to this single origin |
|
|
Statistical Analysis |
Performed on all measurement functions with |
|
|
|
|
|
|
|
on-screen display |
|
|
|
|
|
|
|
ֺ |
Choices of intervals |
|
|
|
|
|
|
ֺ |
Manual start/stop |
|
|
|
|
|
|
ֺ |
Time from 1 second to 1000 hours |
|
|
|
|
|
|
ֺ |
Frames from 2 to 99,999 |
|
|
|
|
|
|
|
Measurements reported |
|
|
|
|
|
|
ֺ |
Current frame data, Mean, Standard Deviation, |
|
|
|
|
|
|
|
Minimum, Maximum of each calculation performed |
|
|
|
|
|
|
Controls integrated with beam stability results, |
|
|
|
|
|
|
|
scatter and strip chart plots |
|
|
|
|
|
|
|
|
|
|
|
|
|
|
01.04.2014 |
|
For latest updates please visit our website: www.ophiropt.com/photonics |
|