- •CONTENTS
- •PREFACE
- •Content—Benefits for Students
- •Content—Benefits for Instructors
- •Features of the Book for Students and Instructors
- •Supplementary Materials
- •Acknowledgments
- •What Is Hospitality Management?
- •The Manager’s Role in the Hospitality Industry
- •Why Study in a Hospitality Management Program?
- •Planning a Career
- •Employment as an Important Part of Your Education
- •Getting a Job
- •Employment at Graduation
- •The Outlook for Hospitality
- •Summary
- •Managing Change
- •Demand
- •Supply
- •Workforce Diversity
- •The Impact of Labor Scarcity
- •Summary
- •The Varied Field of Food Service
- •The Restaurant Business
- •The Dining Market and the Eating Market
- •Contemporary Popular-Priced Restaurants
- •Restaurants as Part of a Larger Business
- •Summary
- •Restaurant Operations
- •Making a Profit in Food Service Operations
- •Life in the Restaurant Business
- •Summary
- •Chain Restaurant Systems
- •Independent Restaurants
- •Franchised Restaurants
- •Summary
- •Competitive Conditions in Food Service
- •The Marketing Mix
- •Competition with Other Industries
- •Summary
- •Self-Operated Facilities
- •Managed-Services Companies
- •Business and Industry Food Service
- •College and University Food Service
- •Health Care Food Service
- •School and Community Food Service
- •Other Segments
- •Vending
- •Summary
- •Consumer Concerns
- •Food Service and the Environment
- •Technology
- •Summary
- •The Evolution of Lodging
- •Classifications of Hotel Properties
- •Types of Travelers
- •Anticipating Guest Needs in Providing Hospitality Service
- •Service, Service, Service
- •Summary
- •Major Functional Departments
- •The Rooms Side of the House
- •Hotel Food and Beverage Operations
- •Staff and Support Departments
- •Income and Expense Patterns and Control
- •Entry Ports and Careers
- •Summary
- •The Economics of the Hotel Business
- •Dimensions of the Hotel Investment Decision
- •Summary
- •The Conditions of Competition
- •The Marketing Mix in Lodging
- •Product in a Segmented Market
- •Price and Pricing Tactics
- •Place—and Places
- •Promotion: Marketing Communication
- •Summary
- •The Importance of Tourism
- •Travel Trends
- •The Economic Significance of Tourism
- •The United States as an International Tourist Attraction
- •Businesses Serving the Traveler
- •Noneconomic Effects of Tourism
- •Summary
- •Motives and Destinations
- •Mass-Market Tourism
- •Planned Play Environments
- •Casinos and Gaming
- •Urban Entertainment Centers
- •Temporary Attractions: Fairs and Festivals
- •Natural Environments
- •On a Lighter Note. . .
- •Summary
- •Management and Supervision
- •The Economizing Society
- •The Managerial Revolution
- •Management: A Dynamic Force in a Changing Industry
- •What Is Management?
- •Summary
- •Why Study Planning?
- •Planning in Organizations
- •Goal Setting
- •Planning in Operations
- •The Individual Worker as Planner
- •Long-Range Planning Tools
- •Summary
- •Authority: The Cement of Organizations
- •Departmentalization
- •Line and Staff
- •Issues in Organizing
- •Summary
- •Issues in Human-Resources Management
- •Fitting People to Jobs
- •Recruiting
- •Selection and Employment
- •Training
- •Retaining Employees
- •Staff Planning
- •Summary
- •The Importance of Control
- •Control and the “Cybernetic Loop”
- •Tools for Control
- •Summary
- •Leadership as Viewed by Social Scientists
- •Why People Follow
- •Leadership Theories
- •Communication
- •The Elements of Leading and Directing
- •Developing Your Own Leadership Style
- •Summary
- •A Study of Service
- •Rendering Personal Service
- •Managing the Service Transaction
- •How Companies Organize for Service
- •Summary
- •INDEX

420Chapter 13 Tourism: Front and Center
income as well as the time to take extended holidays. Households in this age group already spend about $17 billion a year on travel.7
Travel Trends
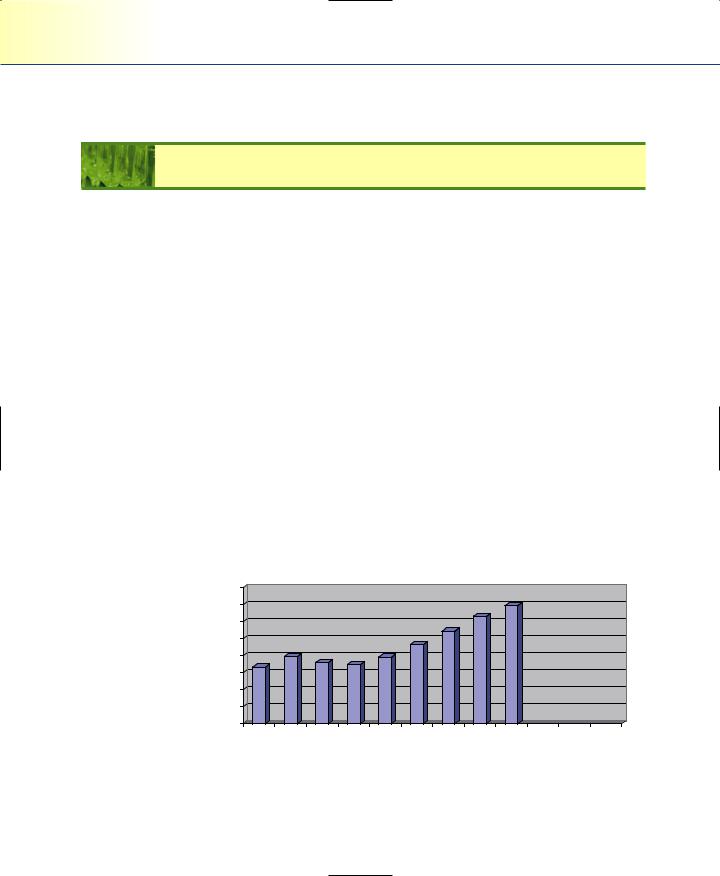
The most frequent reason for (domestic) travel is to visit family and friends. Other pleasure travel, for outdoor recreation and entertainment, is just behind that. All pleasure travel accounts for approximately 80 percent of the some billion domestic person-trips taken in 2005. Business and convention travel (and combination business and pleasure trips) accounted for another 19 percent.8 As Figure 13.2 indicates, travel sales vary with the economy but have grown (historically) somewhat more rapidly than the economy. In the three years around 2001, however, business travel took the hardest hit. Pleasure travel, too, has been impacted but has come back. It has been impacted by the Iraq war, SARS, and the recession, but business travel has suffered tremendously from post-September 11 effects as well as the lingering recession. Travel growth, then, is likely to come from pleasure travel, which has grown at a steady rate in each of the recent years. The effects of various events are explored more in Global Hospi-
tality Note 13.1.
MODE OF TRAVEL
According to the U.S. Department of Transportation, automobiles are the most utilized mode of transportation, being used for almost 90 percent of all long-distance trips. Airlines are the second most frequently used means of transportation, and they are far and away the dominant common carrier, despite the effect that recent
|
700 |
|
|
|
|
|
|
|
|
650 |
|
|
|
|
|
|
|
billions) |
600 |
|
|
|
|
|
|
|
550 |
|
|
|
|
|
|
|
|
500 |
|
|
|
|
|
|
|
|
450 |
|
|
|
|
|
|
|
|
(in |
|
|
|
|
|
|
|
|
400 |
|
|
|
|
|
|
|
|
|
|
|
|
|
|
|
|
|
|
350 |
|
|
|
|
|
|
|
|
300 |
|
|
|
|
|
|
|
|
1999 |
2000 |
2001 |
2002 |
2003 |
2004 |
2005 |
2006 2007* |
* projected
Figure 13.2
Domestic travel expenditures in the United States, 1999–2007. (Source: Travel Industry Association of America. Web site: www.tia.org [January 1, 2007].

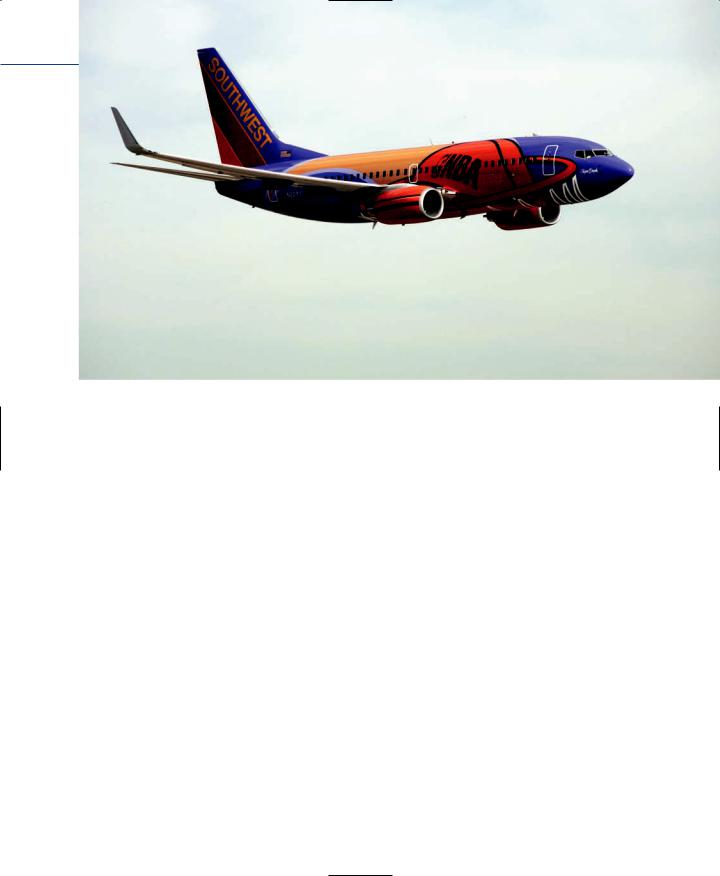
Air travel is the preferred mode of transportation for longer trips (Courtesy of Southwest Airlines.)
events have had. In fact, airlines are used more than twice as often as all other forms of public transportation combined. Further, they are the most utilized mode of transportation for trips of 2,000 miles or more. Travel by private vehicle is still the dominant form of travel for Americans, however.
Air travel increased throughout the 1990s, as measured by revenue passenger miles (with the exception of a slight dip between 1990/1991 and again in 2001/2002). Air travel has also claimed an increasing percentage of overall passenger miles. When long-distance auto and air travel are compared, even though auto travel is the mode of transportation used for most trips, air travel accounts for 55.8 percent of all miles traveled (for long-distance trips) and auto accounts for 42.6 percent of total miles traveled.
TRIP DURATION
As two working spouses in a family have become more common, vacations have become shorter. The typical vacation of the 1950s and 1960s was an annual event lasting 10 to 14 days. During the 1970s and 1980s, vacations, on average, were shortened to five to seven days, and taken twice a year. In the 1990s, the twoto three-day “minivacation” has become increasingly popular. Now, most domestic trips that are taken are only one to two nights in duration.9
421

GLOBAL HOSPITALITY NOTE 13.1
Public Anxiety and the Travel Industry
The first decade of the millennium has brought with it no shortage of significant events—each creating new challenges for the hospitality and tourism industries. September 11, 2001, was the most significant event and the one most still in Americans’ collective minds. Before we discuss the impacts that this day had on our industry, though, we need to point out that its effects reached far beyond the hospitality and tourism industries. Attitudes and behaviors of Americans changed on that day. We continue to hear that people began to reassess their relationships, saw their families in a new light, were kinder to strangers, became more aware of (and concerned with) international events, and had improved feelings toward their fellow citizens. In addition, American Demographics reports that 80 percent of respondents indicated that their appreciation for their families increased as a result of that day, that safety and security of family have become more important and that people are seeking psychotherapy at a greater rate (as a way of dealing with the events).1
That day affected families, businesses, educational institutions, nonprofit organizations, and governments. So, yes, the hospitality and tourism industries were affected, but it is important to see the larger picture.
With that being said, at this writing, the airline industry and the hotel industry have suffered the most and are still having serious problems. The terrorist attacks of September 11 had an immediate effect on travel, tourism, and the hospitality industry in general. It has been said, more than a few times, that this industry was the most affected by the events of September 11. Consumer (traveling) confidence was shaken, and there were feelings of uncertainty surrounding personal safety and security. This resulted in immediate reductions in personal travel, which affected hotels, restaurants, and the like. To complicate matters, the United States was on the cusp of a recession, which only exaggerated and prolonged the effects. The U.S. airlines shut down in the days following September 11—something that would be hard to recover from even under the best of circumstances. Some U.S. airlines still have not yet recovered. United Airlines and US Airways are both operating under bankruptcy protection, and most other major U.S. airlines lost a great deal of money between September 2001 and September 2003. Total travel expenditures by Americans dropped in the last quarter of 2001 and continued to drop in 2002 (compared to the previous year’s statistics). Travel to and from most countries dropped. Even tourism in the Caribbean (considered to be a “safe” destination) dropped by 10 percent in the last quarter of 2001. It should also be noted that airlines elsewhere in the world experienced problems at or around this same time, including Ansett (Australia), Swissair (Switzerland), and Sabena (Belgium). Internationally, it is estimated that the airline industry lost $13 billion dollars in 2002.2
The results of the shutdown of airspace on September 11 were felt across the United States as well as globally. Some estimates suggest that global travel revenues dropped as much as 30 percent in the days and weeks to follow. Hotels saw decreases in all pertinent performance measures—occupancy rates, average daily rates, and RevPAR. These decreases occurred in most major destinations as well.
While September 11 has come and gone, concerns about safety and security remain. Further, the compounding effects of the lingering recession are all contributing to a very slow recovery. Tensions in the Middle East, war in Iraq, and new and misunderstood diseases are all being used as excuses not to travel. SARS is perhaps the most recent and best example of how an illness can create widespread concern. SARS (Severe Acute Respiratory Syndrome) originated in China, and the first case was identified in February 2003 (but believed to have been first contracted in November 2002). From there it spread to Canada, Singapore, Hong Kong, Vietnam, and 13 other countries. The syndrome, which causes flulike symptoms,

resulted in almost 800 deaths worldwide. In reaction, the World Health Organization (WHO) issued a global alert on March 15, 2003, recommending limiting travel to affected countries. The virus continued to spread until about July of that year. Even though most (new) cases were contracted from patients in hospitals, the public reacted with some concern. Travel to the SARS infected places was affected, and the economies of Hong Kong, Toronto (and other parts of Canada), and other travel destinations were severely impacted. Cities such as Toronto appealed to the federal government for financial assistance in the wake of decreased tourist revenues. It wasn’t until several things happened that the economic recovery began to occur. First, the WHO dropped its alert, then individual destinations began offering incentives, and finally, the simple passing of time helped matters tremendously. In the end, it is estimated that SARS cost Canada over $500 million, including lost hotel revenues, dining revenues, and actual health-related costs of dealing with the disease. Hong Kong, perhaps the hardest hit area, initiated a $1.5 billion plan to overcome the effects.3 KPMG reported that at the height of the SARS episode (April 2003), visitor spending was down over 70 percent from the same period in the previous year.4
One result of recent security and safety issues has been the change in airport (and other transportation) procedures. One scholar has dubbed this the “hassle factor” of traveling. Indeed, given the lengthy waits in airports, the extra forms to fill out, the added cost of flying, and numerous personal searches during it all, some people are simply avoiding air travel altogether. Much will have to change to convince this segment of the population that flying is still worth the cost and aggravation.
In light of all of these developments, the Harris Poll conducted a survey to determine the level of fear with regard to American travel plans and behaviors. The poll was conducted in May of 2003 and revealed some interesting results. Some highlights include:
■Fifty-nine percent of respondents feel that the risk to American tourists traveling outside of the United States is much worse or somewhat worse than it was three years earlier.
■Specific actions to reduce risk include fewer Americans planning to travel to Europe as a direct result of safety and security issues.
■Frequent travelers are more likely to reduce their travel as a result of the risk factor.5
To sum this up, the business environment has changed for airlines, hotels, and all other services serving the traveler. Fear and concern, and altered travel patterns, are now an accepted part of the business landscape. Certainly, one result has been that Americans are taking shorter trips, closer to home, and often by automobile. Most operators have accepted the fact that it will be a long time before things return to “normal,” if it happens at all. It remains to be seen whether travel will reach the same level as pre-2001 or if the fear and hesitation will remain.
1.Rebecca Gardyn, “The Home Front,” American Demographics, December 2001.
2.Standard & Poor’s Industry Surveys—Airlines, March 27, 2003.
3.Canadian Broadcasting Corporation, “The Ecomomic Impact of SARS” (www.cbc.ca), November 26, 2003.
4.KPMG, “Tourism Expenditures in Major Canadian Markets,” October 2003.
5.Harris Interactive, Harris Poll # 29 (www.harrisinteractive.com), May 14, 2003.
