

This latter formula uses the same pattern of the EXCEPT function that is used for holidays and the weekday number. It takes into account the weekday number that needs to be considered as a nonworking day in the given country.
 Note
Note
When the model becomes more complex, you need to author more complex DAX code. More importantly, you need to clarify exactly how to compute the numbers. In the presence of multiple countries, the simple formulas used for a single country no longer work. As a data modeler, you need to work harder to define meaningful formulas.
Handling special periods of the year
When dealing with time intelligence, you typically need to highlight and handle specific periods of the year. For example, if you are analyzing the booking of hotels, the Easter period is relevant, and you might want to compare the performance of Easter in different years. The problem is that Easter falls on different dates every year. Thus, you need to identify a variable period of the year to make comparisons.
Another common requirement is to build reports or dashboards that automatically update their content based on the date of refresh. For example, suppose you want a dashboard that compares the sales of the current month against the previous one. This time the problem is that the very concept of a current month depends on the current day. Today, the current month may be April, but for the same day next month, it will be May, and you don’t want to have to update the filters of the dashboard each and every month.
As with working days, there is a difference in the data model depending on whether the periods you want to analyze are overlapping or not.
Using non-overlapping periods
If the periods of time you want to analyze are non-overlapping, then the data model is somewhat easy to build. Similarly to what you did with holidays in the previous sections, you first need a configuration table to store the periods you want to analyze. In our example, we created a table with the Easter and Christmas dates for 2008, 2009, and 2010, because we want them to be a period in time instead of a single date (as was the case for the holidays). The configuration table is shown in Figure 4-31.

FIGURE 4-31 The figure shows the configuration of special periods in the SpecialPeriods table.
Each Easter period starts some days before the given date and ends a few days after. Even if the SpecialPeriods table contains a date that is also a primary key for the table, it does not make any sense to build a relationship. In fact, the only relevant information in SpecialPeriods is the name of the period we want to analyze, and it is better to denormalize the special period description in a calculated column in Date. To do so, use the following code:
Click here to view code image
'Date'[SpecialPeriod] = CALCULATE (
VALUES ( SpecialPeriods[Description] ), FILTER (
SpecialPeriods, AND (
SpecialPeriods[Date] - SpecialPeriods[Da SpecialPeriods[Date] + SpecialPeriods[Da
)
)
)
The column will store the special period name if the current date falls between the following:
 The date of the special period minus the number of days before it
 The same date plus the number of days after it
You can see the result of this calculated column for Easter 2008 in Figure 4-32.
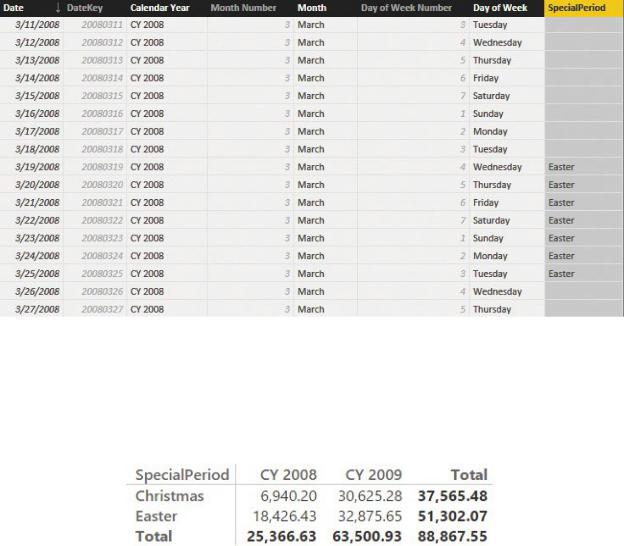
FIGURE 4-32 When a date falls in a special period, it is marked with the period name.
Once the column is in place, it will filter different periods in different years. This makes it possible to compare the sales of the same special period in different years without worrying about when it occurred. You can see this in Figure 4-33.
FIGURE 4-33 This report shows sales for Easter and Christmas in 2008 and 2009.
This technique works fine, and it is very simple to implement, but it comes with a severe limitation: The periods cannot overlap. In fact, if you store overlapping periods in the configuration table, the column will produce an error for all the rows that belong to different periods. Nevertheless, there are many scenarios where this limitation is not an issue. In this case, it is the easiest way to handle special periods. You learn how to handle overlapping periods later in this chapter in the section “Using overlapping periods.”
Periods relative to today
In the previous section, you learned how to handle non-overlapping special periods by storing the information in a configuration table. You can adopt a very

similar technique to create reports that update their content in a dynamic way. Imagine, for example, that you want to build a dashboard like the one in Figure 4- 34, which shows sales of different brands over different time periods along with a gauge that compares the sales of today against the sales of yesterday.
FIGURE 4-34 The report contains a gauge, suitable for a dashboard, that shows the sales of today versus yesterday.
The very concept of today depends on when the report was last refreshed. Of course, you do not want to hard-code the date into the formulas. What you want is that every time you refresh the model, it automatically checks what the last available date in the model is and adapts its content accordingly. In such a case, you can use a variation of the previous data model where, this time, the time periods are computed in a dynamic way.
First, you need to prepare a configuration table, like the one shown in Figure 4- 35, where you store the descriptions of the periods along with the number of days, relative to today, to consider.
FIGURE 4-35 The RelativePeriods configuration table displays the special periods that are relative to the current day.
Each period has the number of days before today, a description, and a code. The days falling between DatesFrom and DaysTo, relative to today, will be tagged with the description. The code is mainly useful for sorting purposes. Once the table is in place, you need to retrieve the code (for sorting) and the description to tag each date as belonging to the appropriate period. This can be easily accomplished through two calculated columns in Date. The first one computes the
code of the relative period and is the following definition:
Click here to view code image
'Date'[RelPeriodCode] = VAR LastSalesDateKey =
MAX ( Sales[OrderDateKey] ) VAR LastSaleDate =
LOOKUPVALUE( 'Date'[Date], 'Date'[DateKey], Last VAR DeltaDays =
INT ( LastSaleDate - 'Date'[Date] ) VAR ValidPeriod =
CALCULATETABLE(
RelativePeriods, RelativePeriods[DaysTo] >= DeltaDays, RelativePeriods[DaysFrom] < DeltaDays
)
RETURN
CALCULATE ( VALUES ( RelativePeriods[Code] ), Va
This code performs all its steps through the usage of variables. First, it retrieves the last OrderDateKey from Sales to grab the key of the last available date, which we will consider as today. Once it has the key, it uses LOOKUPVALUE to compute the date associated with the key. DeltaDays represents the difference between today and the current date. All those values are finally used in CALCULATETABLE to compute, in ValidPeriod, the only row of the RelativePeriods table that includes DeltaPeriod between DaysFrom and DaysTo.
The result of this formula is the code of the relative period to which the given date belongs. Once the calculated column with the code is there, you can compute the description of the relative period as follows:
Click here to view code image
'Date'[RelPeriod] = VAR RelPeriod =
LOOKUPVALUE(
RelativePeriods[Description],
RelativePeriods[Code],
'Date'[RelPeriodCode]
)