


6Chapter 2
2.2 Mechanical properties
Most applications of materials in dentistry have a minimum mechanical property requirement. For example, certain materials should be sufficiently strong and tough to withstand biting forces without fracture. Others should be rigid enough to maintain their shape under load. Such properties of materials are generally characterised by the stress–strain relationship which is readily obtained by using a testing machine of the type shown in Fig. 2.1.
Before considering the various types of experiment which can be carried out and the relevance of the data obtained, it is necessary to define the terms stress and strain.
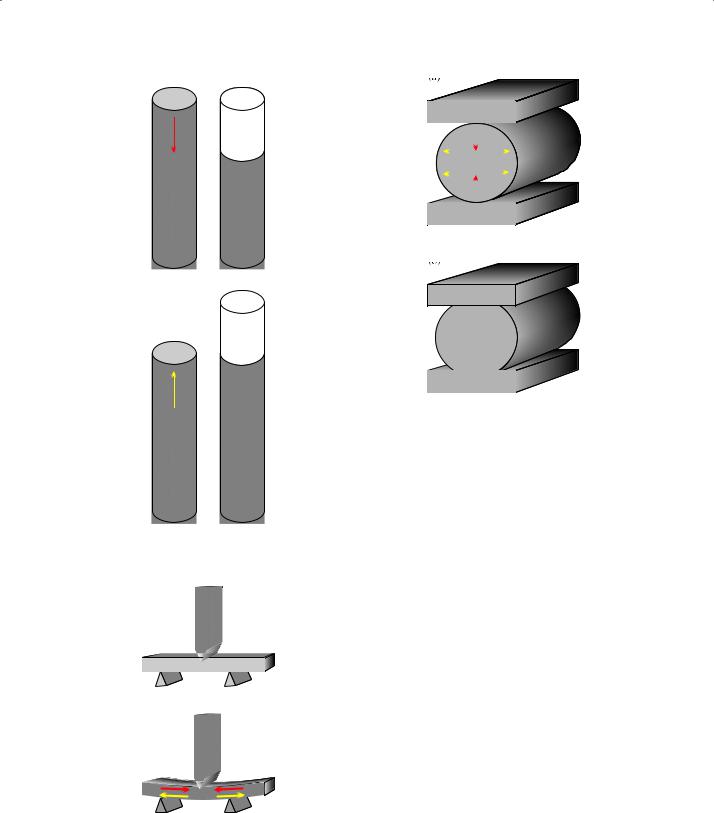
Stress: When an external force is applied to a body or specimen of material under test, an internal force, equal in magnitude but opposite in direction, is set up in the body. For simple compression or tension the stress is given by the expression, Stress = F/A, where F is the applied force and A the cross-sectional area (Fig. 2.2). A stress resisting a compressive force is referred to as a compressive stress and that resisting a tensile force a tensile stress.
Tensile and compressive stresses, along with shear, are the three simple examples of stress which form the basis of all other more complex stress patterns. The unit of stress is the pascal (Pa). This is the stress resulting from a force of 1 Newton (N) acting upon one square metre of surface. Whereas the tensile stress can be visual-
ized as a purely uni-axial stress set up within a material, the compressive stress is more complex and comprises force vectors which act to introduce elements of shear within the specimen under compression.
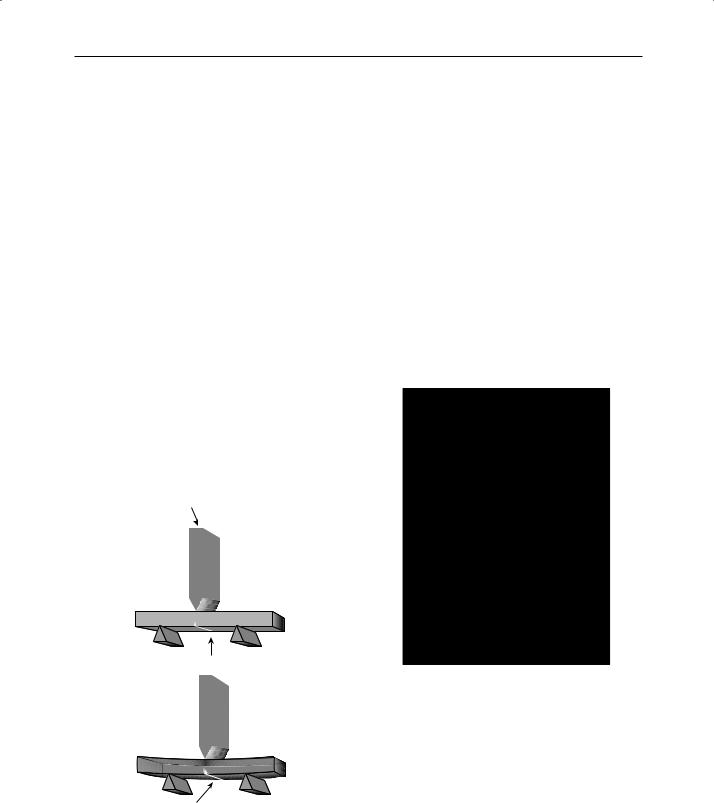
One test method commonly used for dental materials is the three-point bending test or transverse test (Fig. 2.3).
When an external force is applied to the midpoint of the test beam the stresses can be resolved as shown. The numerical value of stress is given by the expression
Stress
= 3FL
2bd2
where L is the distance between the supports, b is the width of the specimen and d its depth.
When a cylinder of a brittle material is compressed across a diameter as shown in Fig. 2.4a, a tensile stress is set up in the specimen, the value of the stress being given by
Stress = |
2F |
at the axis of the cylinder |
|
||
|
π DT |
|
where F is the applied force, D the diameter of the cylinder and T the length of the cylinder. This type of test is referred to as a diametral compressive tensile test and is commonly used when conventional tensile testing is difficult to carry out due to the brittle nature of the test material. For nonbrittle materials the equation used to calculate stress breaks down due to the increased area of contact between the testing machine platen and the material under test (Fig. 2.4b).
(a) |
(b) |
Fig. 2.1 (a) Mechanical properties testing equipment. This shows the equipment used in determining mechanical properties of materials. The test being performed is a tensile test on a sample of impression material. Note the shape of the sample which is shown in the inset (b). This shape is referred to as a dumb bell shaped specimen and it is designed so that the specimen can be gripped at each end and stretched. The shape of the specimen will ensure that fracture occurs in the middle region and not at the ends of the specimen where the specimen is gripped. The results are given on the computer screen in the form of a plot of force against displacement, which can easily be converted into stress against strain.
Properties used to Characterise Materials |
7 |
|
|
(a)
(b)
Fig. 2.2 Diagram indicating how the magnitudes of (a) compressive and (b) tensile stresses and strains are calculated.
(a)
(b)
Fig. 2.3 Diagrammatic representation of a 3-point bending test or transverse test (a). Bending of the beam introduces both tensile and compressive stresses (b).
(a)
(b)
Fig. 2.4 Diametral compressive test for (a) a brittle material and (b) a ductile material.
Fracture stress – strength: There is a limit to the value of applied force which a body, or specimen of material, can withstand. The maximum stress is normally used to characterise the strength of a material. In a tensile test, the fracture stress is referred to as the tensile strength of a material whilst a compression test gives a value of compressive strength. The diametral compressive tensile test gives a value for tensile strength.
In the case of a bending test, fracture is normally initiated from the side of the specimen which is in tension. The bending stress at fracture, often called the flexural stress, is closely related to the tensile strength.
For brittle materials, the flexural strength can be significantly influenced by the presence of surface defects, voids or other imperfections which may cause stress concentrations at the surface in tension. These stress concentrations may cause a material to fracture at a force lower than that which would otherwise be expected, a fact which has obvious implications for engineering design as well as dentistry.
Strain: The application of an external force to a body or test specimen results in a change in

8Chapter 2
dimension of that body. For example, when a tensile force is applied the body undergoes an extension, the magnitude of which depends on the applied force and the properties of the material. The numerical value of strain is given by the expression
= Change in length
Strain
Original length
Thus strain, which has no physical dimensions, can be seen as a measure of the fractional change in length caused by an applied force (Fig. 2.2). When strain becomes large, the dimensions of test specimens may change in a direction at 90º to that of the applied force. For example, a cylinder of material may undergo barrelling in addition to uni-axial compression, whilst a specimen subjected to tensile stress may become thinner in cross-section as the extension occurs. In order to monitor the way in which the stress changes with these alterations in specimen shape we need to take account of the poissons ratio of the material. This gives an indication of the ratio of strain occurring at 90º to the direction of the applied force to that occurring in the direction of the force.
The strain may be recoverable, that is the material will return to its original length after removal of the applied force, or the material may remain deformed, in which case the strain is non-recover- able. A third possibility is that the strain may be partially recoverable or that the recovery is timedependent. The extent of recovery and/or rate of recovery is a function of the elastic properties of materials.
Stress-strain relationship: Stress and strain, as defined in the previous sections, are not independent and unrelated properties, but are closely related and may be seen as an example of cause and effect. The application of an external force, producing a stress within a material, results in a change in dimension or strain within the body.
The relationship between stress and strain is often used to characterise the mechanical properties of materials. Such data are generally obtained using a mechanical testing machine (Fig. 2.1) which enables strain to be measured as a function of stress and recorded automatically. Modern machines are capable of either increasing strain at a given rate and measuring the stress or increasing stress at a given rate and measuring the strain.
Other applications, including fatigue testing, will be covered later.
For the simplest type of tensile or compression test, the graph displayed on the pen recorder would be as shown in Fig. 2.5.
It can be seen that in this example there is a linear relationship between stress and strain up to the point P. Further increases in stress cause proportionally greater increases in strain until the material fractures at point T. The stress corresponding to point T is the fracture stress. In a tensile test this gives a value of tensile strength, whilst in a compression test a value of compressive strength is obtained. The value of stress which corresponds to the limit of proportionality, P, is referred to as the proportional limit.
Point E is the yield stress. This corresponds to the stress beyond which strains are not fully recovered. Hence, it is the maximum stress which a material can withstand without undergoing some permanent deformation. The yield stress is difficult to characterise experimentally since it requires a series of experiments in which the stress is gradually increased then released and observations on elastic recovery made.
As a consequence of these experimental difficulties the proportional limit is often used to give an approximation to the value of the yield stress. Hence, when a material is reported as having a high value of proportional limit it indicates that a sample of the material is more likely to withstand applied stress without permanent deformation.
A practical example of a situation in which a high proportional limit is required is in connectors of partial dentures. Such connectors should not undergo permanent deformation if they are to
Fig. 2.5 Typical stress-strain graph obtained from a simple compressive or tensile test.

Properties used to Characterise Materials |
9 |
|
|
retain their shape. A material such as cobalt– chromium (Co/Cr) alloy which has a high value of proportional limit is popular for this application since it can withstand high stresses without being permanently distorted. Another way of gauging the level of stress required to produce permanent deformation is to measure the proof stress. This indicates the value of stress which will result in a certain degree of permanent deformation upon removal of the stress. For example, the 0.1% proof stress (commonly used for alloys) is the level of stress which would result in a 0.1% permanent deformation.
The slope of the straight-line portion of the stress–strain graph gives a measure of the modulus of elasticity defined as:
= Stress
Modulus of elasticity
Strain
This has units of stress. The choice of nomenclature for this property is somewhat unfortunate since it, in fact, gives an indication of the rigidity of a material and not its elasticity. A steep slope, giving a high modulus value, indicates a rigid material, whilst a shallow slope, giving a low modulus value, indicates flexible material. Whereas it may be advantageous for an impression material to be flexible it is essential for a restorative material to be rigid.
The value of strain recorded between points E and T indicates the degree of permanent deformation which can be imparted to a material up to the point of fracture. For a tensile test this gives an indication of ductility whilst for a compressive test it indicates malleability. Hence, a ductile material can be bent or stretched by a considerable amount without fracture whereas a malleable material can be hammered into a thin sheet. A property often used to give an indication of ductility is the elongation at fracture. Alloys used to form wires must show a high degree of ductility since they are extended considerably during the production process. In addition, clasps of dentures constructed from ductile alloys can be altered by bending.
The malleability of stainless steel is utilized when forming a denture base by the swaging technique. This involves the adaptation of a sheet of stainless steel over a preformed cast.
The area beneath the stress-strain curve yields some important information about test materials (Fig. 2.6). The area beneath the curve up to the
Fig. 2.6 The area under a stress-strain graph may be used to calculate either (a) resilience or (b) toughness.
elastic limit, Fig. 2.6a, gives a value of resilience, the units being those of energy. Resilience may be defined as the energy absorbed by a material in undergoing elastic deformation up to the elastic limit. A high value of resilience is one parameter often used to characterise elastomers. Such materials which may, for example, be used to apply a cushioned lining to a hard denture base are able to absorb considerable amounts of energy without being permanently distorted. The energy is stored and released when the material springs back to its original shape after removal of the applied stress.
The total area under the stress-strain graph, Fig. 2.6b, gives an indication of toughness. This again has units of energy and may be defined as the total amount of energy which a material can absorb up to the point of fracture. A material capable of absorbing large quantities of energy is termed a tough material. The opposite of toughness is brittleness. This is, naturally, an important property for many dental materials. Its measurement, for example in a transverse test, depends on factors such as the speed with which the stress is increased and the presence of small imperfections in the specimen surface from which cracks can propagate.
10 Chapter 2
Fracture toughness and impact strength: For brittle materials fracture may occur suddenly at a stress which is apparently well below the ideal fracture stress. This observation led to the development of theories on fracture toughness which takes account of the fact that small cracks can concentrate the stress at their tips. Griffith developed the theory of fracture toughness which led to the use of equations used for the calculation of stress intensification factor K. When K becomes great enough for crack propagation to occur it is termed the critical stress intensification factor Kc. This is calculated using the applied force, the specimen dimensions and the size and shape of the notch causing stress intensification. K has the units MNm−1.5. In order to calculate K or Kc specimens of the type shown in Fig. 2.7 are most commonly used. The notch is moulded or machined into the specimen and has very well defined dimensions of notch depth and notch tip radius. This type of specimen is known as a single-edge-notched specimen (SEN). It is likely that fracture toughness is more meaningful than strength for brittle materials as the critical effect of surface defects is accounted for by the presence of a notch. The
equations used to calculate fracture toughness should strictly only be applied to materials which fail by a purely brittle mechanism. When plastic deformations occur before fracture misleading results can be obtained. The speed at which testing is carried out may affect the extent to which plastic deformation may occur. It is more likely to occur when the strain is increased slowly than when the strain is increased rapidly.
Hence materials are more likely to behave in a more brittle fashion when stress or strain are increased rapidly. When the stress is increased very rapidly it may be termed an impact test and the important practical property obtained is the impact strength which is normally quoted in units of energy. For this type of test the machine shown in Fig. 2.1 is often not capable of increasing stress rapidly enough and a swinging pendulum impact testing device is commonly used (Fig. 2.8). This
Applied load
Notch in specimen
Crack propagating from notch
Fig. 2.7 Notched specimens are often used in tests of toughness in order to overcome the effects of surface imperfections in specimens.
Fig. 2.8 Test equipment for the Charpy impact test. This shows the equipment used to determine impact strength. The essential part of this equipment consists of a pendulum which swings from the position shown, down and then up again to the equivalent position on the other side. If a specimen is located at the bottom of the swing, as the pendulum swings through, it fractures the specimen and as energy will be absorbed in this process the pendulum swings up to a lower position on the other side. Hence, the energy absorbed in fracturing the specimen is shown on the gauge. Since this equipment gives a direct measure of energy absorbed during fracture this is strictly speaking a measurement of toughness rather than strength.

Properties used to Characterise Materials |
11 |
|
|
type of instrument is known as a Charpy Impact tester. The position reached by the pendulum after fracturing the specimen gives a measure of the energy absorbed by the specimen during fracture. The absorbed energy can be resolved into several components which include friction and air resistance in the equipment. These minor components can be calculated by doing a dummy run with no specimens. The major components of energy are used in initiating and propagating cracks in the material. The relative magnitudes of these two components can be investigated by testing specimens with and without preformed cracks or notches. When the presence of a small notch or crack in the surface of a material has a marked effect on impact strength the material is said to be notch sensitive. Specimens of the type shown in Fig. 2.7 are often used in impact testing. Impact
strength is not a fundamental material property (as is modulus of elasticity, for example) and it is not possible to fully account for differences in specimen size and shape. Values of impact strength measured in this way may only be considered of limited use in making direct comparisons with other materials of the same specimen size tested on the same instrument. For this reason the method is of limited scientific use, but is widely used in industry for quality control and development. Impact strength is an important property for acrylic denture base materials which have a tendency to fracture if accidentally dropped onto a hard surface.
Figure 2.9 gives examples of various types of stress-strain graphs which may be encountered, along with an explanation of the way in which the graphs can be used to characterise materials.
Fig. 2.9 Six different types of stress-strain graphs. These may be used to characterise materials as follows: (a) rigid, strong, tough, ductile; (b) flexible, tough; (c) rigid, strong, brittle; (d) rigid, weak, brittle; (e) flexible, weak, brittle;
(f) flexible, resilient.
12 Chapter 2
Fatigue properties: Many materials which are used as restoratives or dental prostheses are subjected to intermittent stresses over a long period of time – possibly many years. Although the stresses encountered may be far too small to cause fracture of a material when measured in a direct tensile, compressive or transverse test it is possible that, over a period of time, failure may occur by a fatigue process. This involves the formation of a microcrack, possibly caused by stress concentration at a surface fault or due to the shape of the restoration or prosthesis. This crack slowly propagates until fracture occurs. Final fracture often occurs at quite a low level of stress, a fact which often surprises patients who claim that their denture fractured when biting on soft food.
Fatigue properties may be studied in one of two ways. Firstly, it is possible to apply a cyclic stress at a given magnitude and frequency and to observe the number of cycles required for failure. The result is often referred to as the fatigue life of a material. Another approach is to select a given number of stress cycles, say 10 000, and determine the value of the cyclic stress which is required to cause fracture within this number of cycles. The result in this case is referred to as the fatigue limit. Both methods play an important part in materials’ evaluation. The most rigorous approach is to test many specimens at different cyclic stress levels and to determine the number of cycles to failure in each case. The result is then given in the form of a graph as shown in Fig. 2.10. As the applied
cyclic stress increases, the number of cycles to failure decreases.
One of the most important factors involved in such tests is the quality of the specimen used in the test since faults introduced during preparation can drastically reduce both fatigue life and fatigue limit.
Fatigue failure has often received only scant consideration in the past as a possible mode of failure for dental materials. It is now recognized that stress concentrations within materials can occur to an extent where cracks can propagate to cause failure within the normal lifetime of the material. Where fatigue cracks occur near the surface of a material and result in material loss from the surface they can be considered to contribute towards the overall wear observed for the material. Thus it is often not possible to separate the fracture and wear characteristics of materials.
Abrasion resistance: The oral cavity is a relatively harsh environment in which to place either a restoration or prosthesis. Wear can occur by one or more of a number of mechanisms, some of which may be considered to be of mechanical origin and others chemical. Wear caused by indenting and scratching of the surface by abrasive toothpastes or food is termed abrasive wear and the hardness of a material is often used to give an approximate indication of the resistance to this type of abrasion.
Fig. 2.10 Fatigue testing. Results are often given as a graph of cyclic stress versus number of cycles to failure. At smaller stress levels a greater number of cycles are required to cause fracture.

Properties used to Characterise Materials |
13 |
|
|
Wear due to intermittent stresses caused by, for example, tooth-restorative contacts where the degree of scratching may be minimal is termed fatigue wear and the fatigue life and fatigue limit mentioned in the previous section are thought to give a guide to the fatigue wear resistance.
In practice the position is not as clear cut as it would seem from the previous two paragraphs since most wear processes occur by a combination of two or more mechanisms. Consequently, laboratory experiments devised to measure wear rates of dental materials often produce unconvincing or even misleading results.
Chemical factors may play an important role in many wear mechanisms. For example, water absorption may cause structural changes within a material which accelerate the rate of degradation by abrasive wear or fatigue. Likewise, solvents may cause surface softening which accelerates wear.
A process closely related to wear is erosion. This is the loss of surface material caused by impinging particles (such as sand or raindrops). The term erosion has been used in dentistry to imply the loss of material through a chemical effect such as acid attack.
The most important comparative information about the abrasion resistance values of different materials comes from well-controlled clinical trials.
Hardness: The hardness of a material gives an indication of the resistance to penetration when indented by a hard asperity. The value of hardness, often referred to as the hardness number, depends on the method used for its evaluation. Generally, low values of hardness number indicate a soft material and vice versa.
Common methods used for hardness evaluation include Vickers, Knoop, Brinell and Rockwell. Vickers and Knoop both involve the use of diamond pyramid indentors. In the case of Vickers hardness, the diamond pyramid has a square base, whilst for Knoop hardness, one axis of the diamond pyramid is much larger than the other. The Brinell hardness test involves the use of a steel ball indentor producing an indentation of circular cross-section. Figure 2.11 shows the types of indentation produced in test specimens. The hardness is a function of the diameter of the circle for Brinell hardness and the distance across the diagonal axes for Vickers and Knoop hardness. Allow-
Fig. 2.11 Shapes of indentations produced by three types of hardness test. A decrease in the size of the indentation indicates a harder material.
Table 2.2 Vickers hardness numbers of some selected dental materials.
Material |
VHN |
|
|
Enamel |
350 |
Dentine |
60 |
Acrylic resin |
20 |
Dental amalgam |
100 |
Porcelain |
450 |
Co/Cr alloys |
420 |
|
|
ance is naturally made for the magnitude of the applied loads.
Measurements are normally made using a microscope since the indentations are often too small to be seen with the naked eye. In the case of Rockwell hardness, a direct measurement of the depth of penetration of a conical diamond indentor is made. Table 2.2 shows Vickers hardness numbers for some common dental materials.
It is worth giving some consideration to what is actually being measured during a hardness test. For those methods involving the measurement of an indentation with a microscope after the indenting force has been removed, the hardness value is related to the degree of permanent deformation produced in the surface of the test material by the indentor under a given load. The pyramidal designs of indentors used in Vickers and Knoop tests dictate that when they come into contact with the surface of a test material the initial contact stress is very high. As the indentor penetrates further the applied load is spread over a greater area and the stress is reduced. The indentor comes to rest when the applied stress is equivalent to the elastic limit of the test material and the
14 Chapter 2
hardness measurement gives an indication of yield stress. Any other deformation of the material is likely to be elastic in nature and will not be recorded as part of the material’s hardness measurement since elastic recovery may occur before the measurement is made with the microscope. Occasionally it is possible to observe the size of the indentation shrinking as elastic recovery occurs. When this happens it is important to allow the size of the indentation to stabilize before measurements are made. Methods which involve the direct measurement of depth of indentation may produce results which are difficult to analyse unless the elastic and plastic parts of the deformation can be separated.
Hardness is often used to give an indication of the ability to resist scratching. Hence, acrylic materials are easily scratched because they are relatively soft whereas Co/Cr alloys are unlikely to become scratched because they are relatively hard. As a corollary to this, harder materials are more difficult to polish by mechanical means.
Hardness is also used to give an indication of the abrasion resistance of a material, particularly
where the wear process is thought to include scratching as in abrasive wear.
Elasticity and viscoelasticity: The property of yield stress has previously been used to define the elastic range of a material. The yield stress is the value of stress beyond which the material becomes permanently distorted, that is, the strain is not completely recovered after the applied load is removed.
Although yield stress is an important property it does not, on its own, fully characterise the elastic properties of a material. Elastic properties are often defined in terms of the ability of a material to undergo elastic recovery. When a material undergoes full elastic recovery immediately after removal of an applied load it is elastic. If the recovery takes place slowly, or if a degree of permanent deformation remains, the material is said to be viscoelastic.
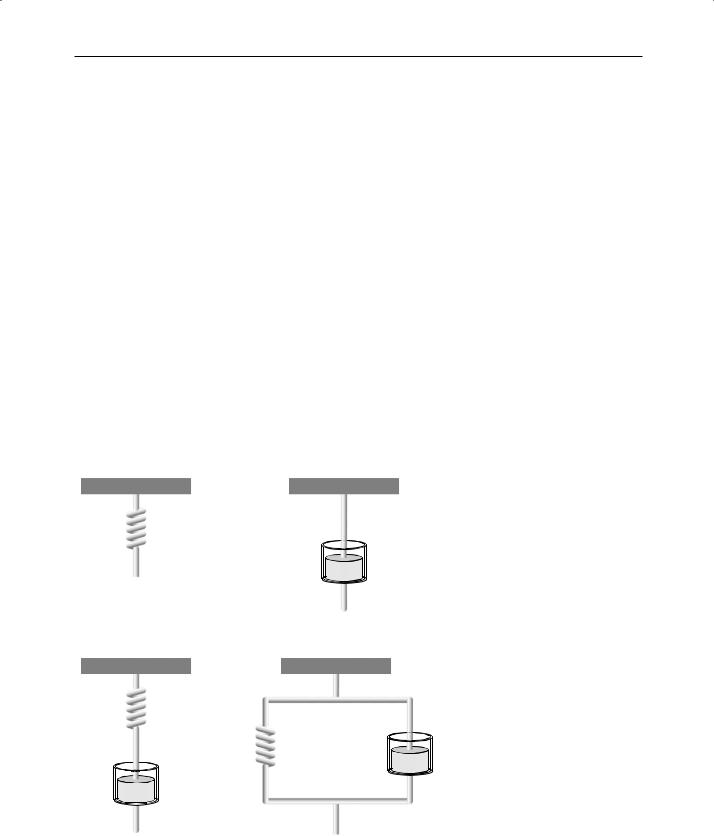
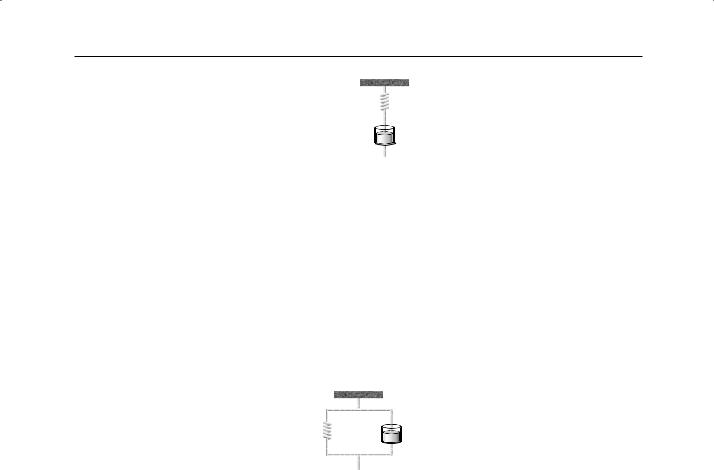
Models involving the use of springs and dashpots can be used to explain the elastic and viscoelastic behaviour of materials (Fig. 2.12). When a spring, which represents an elastic material, is
(a) |
(b) |
Spring
Dashpot
(c) |
(d) |
Spring and dashpot in series |
Spring and dashpot in parallel |
Fig. 2.12 Models used to represent (a) |
elastic materials (b) plastic materials and |
||
(Maxwell model) |
(Voigt model) |
(c) and (d) viscoelastic materials. |
Properties used to Characterise Materials |
15 |
|
|
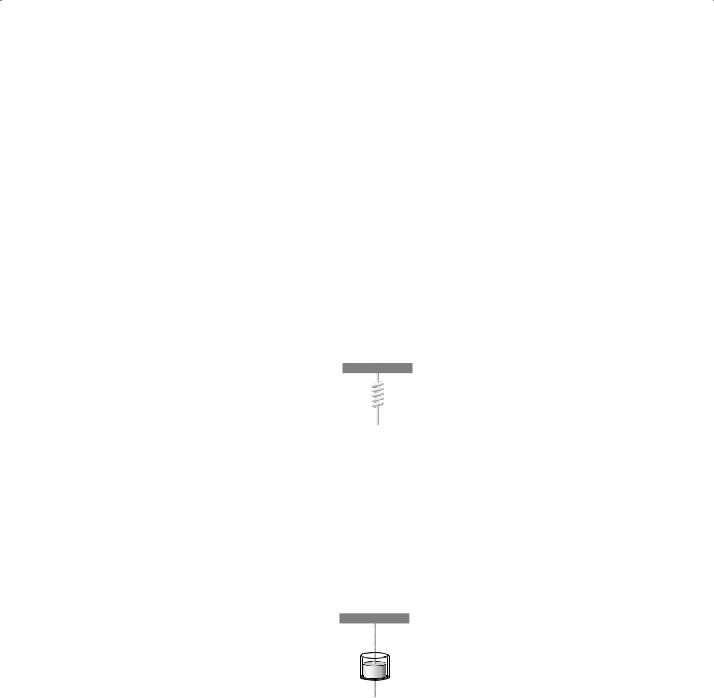
fixed at one end and a load applied at the other it becomes instantaneously extended. When the load is removed it immediately recovers its original length (Fig. 2.13a). This behaviour is analogous to that of a perfectly elastic material. The two things that characterise the material are firstly the perfect recovery after removal of the force and secondly the lack of any time dependency of either the deformation under load or the recovery after removal of the applied force. The extent of deformation under load is characterised by the modulus of elasticity of the material (analogous to the spring constant of the spring).
When a load is applied to a dashpot, which represents a viscous material, it opens slowly, strain being a function of the time for which the load is applied (Fig. 2.13b). When the load is removed the dashpot remains open and no recovery occurs. This is in distinct contrast to the behaviour of an elastic material. The time-depen- dent opening of the dashpot is akin to the way in which the flow of a viscous or plastic material is controlled by its viscosity.
For the material behaving as a spring and dashpot in series (Maxwell model), application of a load causes the spring to be extended
Fig. 2.13 Strain versus time graphs obtained for various types of model materials: (a) elastic material, (b) plastic material, (c) viscoelastic material (Maxwell type), (d) viscoelastic material (Voigt type).
16 Chapter 2
Fig. 2.13 (continued)
instantaneously followed by slow opening of the dashpot (Fig. 2.13c). On removal of the load the spring recovers but the dashpot remains permanently distorted. The magnitude of the distortion depends on the applied load and the time for which the load is applied.
For the material behaving as a spring and dashpot in parallel (Voigt model), application of load causes slow opening of the spring under the damping effect of the dashpot (Fig. 2.13d). Following removal of the load the dashpot and spring slowly recover to their original state under the elastic influence of the spring and the damping
influence of the dashpot. The time taken to recover is a function of the applied load and the time of application of the load. For materials which exhibit either Voigt or Maxwell type behaviour, the deformation under load is described by a value of modulus of elasticity, viscosity and time.
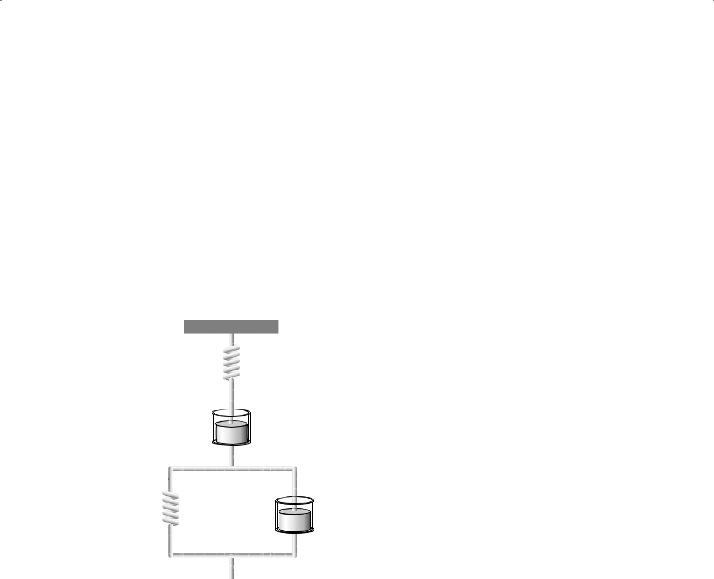
Many viscoelastic materials used in dentistry behave like a combination of the Voigt and Maxwell models (Fig. 2.14). Such materials show an instantaneous increase in strain due to the spring (A) followed by a gradual increase in strain as the dashpot (B) and spring/dashpot (C/D)
Properties used to Characterise Materials |
17 |
|
|
A
B
C
D
Fig. 2.14 Universal model which can be used to explain the viscoelastic properties of most materials.
system open. On removal of the load the spring
(A) recovers instantaneously followed by gradual recovery of the spring/dashpot (C/D). Some permanent distortion remains as a consequence of the dashpot (B). Again, the magnitude of the permanent deformation is a function of the applied load and the time of application.
This type of behaviour has important practical significance for many dental materials and particularly for elastic impression materials. All such materials are viscoelastic to some extent and may become distorted when being removed over undercuts. The permanent deformation depends on the applied load, which in this case is a function of the force required to remove the impression from
the mouth, and the time for which that force is applied. The magnitude of the force is dictated by the modulus of elasticity of the material, its thickness and the severity of the undercuts.
Creep and stress relaxation are two other phenomena which can be explained using the viscoelasticity models.
Creep involves a gradual increase in strain under the influence of a constant applied load similar to that which takes place in the Maxwell model (Fig. 2.12c). The phenomenon of creep can only be distinguished from that of flow by the extent of the deformation and the rate at which it occurs. The term creep implies a relatively small deformation produced by a relatively large stress over a