

clustering
.pdfData Clustering: A Review
A.K. JAIN
Michigan State University
M.N. MURTY
Indian Institute of Science
AND
P.J. FLYNN
The Ohio State University
Clustering is the unsupervised classification of patterns (observations, data items, or feature vectors) into groups (clusters). The clustering problem has been addressed in many contexts and by researchers in many disciplines; this reflects its broad appeal and usefulness as one of the steps in exploratory data analysis. However, clustering is a difficult problem combinatorially, and differences in assumptions and contexts in different communities has made the transfer of useful generic concepts and methodologies slow to occur. This paper presents an overview of pattern clustering methods from a statistical pattern recognition perspective, with a goal of providing useful advice and references to fundamental concepts accessible to the broad community of clustering practitioners. We present a taxonomy of clustering techniques, and identify cross-cutting themes and recent advances. We also describe some important applications of clustering algorithms such as image segmentation, object recognition, and information retrieval.
Categories and Subject Descriptors: I.5.1 [Pattern Recognition]: Models; I.5.3 [Pattern Recognition]: Clustering; I.5.4 [Pattern Recognition]: ApplicationsÐ Computer vision; H.3.3 [Information Storage and Retrieval]: Information Search and RetrievalÐClustering; I.2.6 [Artificial Intelligence]: LearningÐKnowledge acquisition
General Terms: Algorithms
Additional Key Words and Phrases: Cluster analysis, clustering applications, exploratory data analysis, incremental clustering, similarity indices, unsupervised learning
Section 6.1 is based on the chapter ªImage Segmentation Using Clusteringº by A.K. Jain and P.J. Flynn, Advances in Image Understanding: A Festschrift for Azriel Rosenfeld (K. Bowyer and N. Ahuja, Eds.), 1996 IEEE Computer Society Press, and is used by permission of the IEEE Computer Society.
Authors' addresses: A. Jain, Department of Computer Science, Michigan State University, A714 Wells Hall, East Lansing, MI 48824; M. Murty, Department of Computer Science and Automation, Indian Institute of Science, Bangalore, 560 012, India; P. Flynn, Department of Electrical Engineering, The Ohio State University, Columbus, OH 43210.
Permission to make digital / hard copy of part or all of this work for personal or classroom use is granted without fee provided that the copies are not made or distributed for profit or commercial advantage, the copyright notice, the title of the publication, and its date appear, and notice is given that copying is by permission of the ACM, Inc. To copy otherwise, to republish, to post on servers, or to redistribute to lists, requires prior specific permission and / or a fee.
© 2000 ACM 0360-0300/99/0900±0001 $5.00
ACM Computing Surveys, Vol. 31, No. 3, September 1999
CONTENTS
1.Introduction
1.1Motivation
1.2Components of a Clustering Task
1.3The User's Dilemma and the Role of Expertise
1.4History
1.5Outline
2.Definitions and Notation
3.Pattern Representation, Feature Selection and Extraction
4.Similarity Measures
5.Clustering Techniques
5.1Hierarchical Clustering Algorithms
5.2Partitional Algorithms
5.3Mixture-Resolving and Mode-Seeking Algorithms
5.4Nearest Neighbor Clustering
5.5Fuzzy Clustering
5.6Representation of Clusters
5.7Artificial Neural Networks for Clustering
5.8Evolutionary Approaches for Clustering
5.9Search-Based Approaches
5.10A Comparison of Techniques
5.11Incorporating Domain Constraints in Clustering
5.12Clustering Large Data Sets
6.Applications
6.1Image Segmentation Using Clustering
6.2Object and Character Recognition
6.3Information Retrieval
6.4Data Mining
7.Summary
1.INTRODUCTION
1.1 Motivation
Data analysis underlies many computing applications, either in a design phase or as part of their on-line operations. Data analysis procedures can be dichotomized as either exploratory or confirmatory, based on the availability of appropriate models for the data source, but a key element in both types of procedures (whether for hypothesis formation or decision-making) is the grouping, or classification of measurements based on either (i) goodness-of-fit to a postulated model, or (ii) natural groupings (clustering) revealed through analysis. Cluster analysis is the organization of a collection of patterns (usually represented as a vector of measurements, or a point in a multidimensional space) into clusters based on similarity.
Data Clustering · 265
Intuitively, patterns within a valid cluster are more similar to each other than they are to a pattern belonging to a different cluster. An example of clustering is depicted in Figure 1. The input patterns are shown in Figure 1(a), and the desired clusters are shown in Figure 1(b). Here, points belonging to the same cluster are given the same label. The variety of techniques for representing data, measuring proximity (similarity) between data elements, and grouping data elements has produced a rich and often confusing assortment of clustering methods.
It is important to understand the difference between clustering (unsupervised classification) and discriminant analysis (supervised classification). In supervised classification, we are provided with a collection of labeled (preclassified) patterns; the problem is to label a newly encountered, yet unlabeled, pattern. Typically, the given labeled (training) patterns are used to learn the descriptions of classes which in turn are used to label a new pattern. In the case of clustering, the problem is to group a given collection of unlabeled patterns into meaningful clusters. In a sense, labels are associated with clusters also, but these category labels are data driven; that is, they are obtained solely from the data.
Clustering is useful in several exploratory pattern-analysis, grouping, deci- sion-making, and machine-learning situations, including data mining, document retrieval, image segmentation, and pattern classification. However, in many such problems, there is little prior information (e.g., statistical models) available about the data, and the decision-maker must make as few assumptions about the data as possible. It is under these restrictions that clustering methodology is particularly appropriate for the exploration of interrelationships among the data points to make an assessment (perhaps preliminary) of their structure.
The term ªclusteringº is used in several research communities to describe
ACM Computing Surveys, Vol. 31, No. 3, September 1999
266 |
· |
A. Jain |
et |
al. |
|
|
|
|
|
|
|
|
|
|
|
|
|
|
|
|||||
|
|
Y |
|
|
|
|
|
|
x |
|
|
|
|
Y |
|
|
|
|
|
4 |
4 |
|
|
5 |
|
|
|
|
|
|
|
|
|
|
|
|
|
|
|
|
|
||||||||
|
|
|
|
|
|
|
|
|
|
|
|
|
|
|
|
|
|
|
|
|
||||
|
|
|
|
|
|
|
|
|
|
x |
|
|
|
|
|
|
|
4 |
|
|
||||
|
|
|
|
|
|
|
|
x |
x |
|
|
|
|
|
4 |
|
|
|
|
|||||
|
|
|
|
|
|
|
|
|
|
|
|
|
|
|
|
|
|
5 |
||||||
|
|
|
|
|
|
|
|
|
|
|
|
x |
|
|
|
|
|
|
|
|
|
|
||
|
|
|
|
|
|
x |
|
x x |
x |
x |
|
|
|
|
4 |
|
|
4 |
4 |
5 |
5 |
|||
|
|
|
|
|
|
|
|
|
|
|
|
|
|
|
||||||||||
|
|
|
|
|
|
x |
|
|
|
|
|
|
|
3 |
|
|
|
5 5 |
||||||
|
|
|
|
|
|
x |
|
|
|
x |
x |
|
|
|
|
|
|
4 |
|
|
||||
|
|
|
|
|
|
|
x x |
x |
|
|
|
|
|
|
|
|
|
3 3 |
|
|
|
|||
|
|
|
|
|
|
|
|
|
|
|
|
|
|
|
|
|
|
3 |
|
|
|
|
||
|
|
|
|
|
|
|
|
x |
x |
|
|
|
|
|
|
|
|
4 |
|
4 |
|
|
|
|
|
|
|
|
|
|
x |
|
|
|
|
|
|
|
|
|
|
|
|
|
|
||||
|
|
|
|
|
|
|
|
|
|
|
|
|
|
|
|
|
|
|
4 |
|
|
|
||
|
|
|
|
|
|
|
|
|
|
|
|
|
|
|
|
|
|
4 |
|
|
|
|
||
|
|
|
|
|
|
|
|
|
x |
|
|
|
|
|
|
|
|
|
|
|
|
|
||
|
|
|
|
|
|
|
x |
|
|
|
|
|
|
|
|
|
|
|
4 |
|
|
|
||
|
|
|
|
|
|
|
|
x |
|
|
|
|
|
|
|
|
|
4 |
|
|
|
|
||
|
|
|
|
|
|
|
|
|
|
|
|
|
|
|
|
|
|
4 |
4 |
|
|
|
||
|
|
|
|
|
|
|
x |
x |
x |
|
|
|
|
|
|
|
|
|
|
|
|
|
||
|
|
|
|
|
|
|
|
|
|
|
|
|
|
|
|
|
|
|
|
|
|
|||
|
|
|
|
|
|
x |
x |
|
|
x |
|
x |
|
|
|
|
2 |
2 |
|
|
|
6 |
7 |
|
|
|
|
|
|
|
x |
x |
|
x |
|
|
x |
|
|
|
|
2 |
2 |
|
|
6 |
|
7 |
|
|
|
|
|
|
x |
|
|
|
x |
|
x |
|
|
|
|
|
|
|
|
|
6 |
|
|
7 |
|
|
|
|
x |
x |
|
|
x |
x |
|
|
|
|
|
1 |
1 |
1 |
|
|
6 |
|
7 |
|
|
|
|
|
|
x |
|
|
|
|
|
|
|
|
|
|
|
|||||||||
|
|
|
|
|
|
|
|
|
|
|
|
|
|
|
|
1 |
|
|
|
|
|
|
|
|
|
|
|
|
|
x |
|
|
|
|
|
|
|
|
|
|
|
1 |
|
|
|
|
|
|
|
|
|
|
|
|
|
|
|
|
(a) |
|
|
X |
|
|
|
|
|
|
|
(b) |
|
|
X |
|
|
|
|
|
|
|
|
|
|
|
|
|
|
|
|
|
|
|
|
|
|
|
|
||
|
|
|
|
|
|
|
|
|
|
|
|
|
|
|
|
|
|
|
|
|
|
|
|
|
Figure 1. Data clustering.
methods for grouping of unlabeled data. These communities have different terminologies and assumptions for the components of the clustering process and the contexts in which clustering is used. Thus, we face a dilemma regarding the scope of this survey. The production of a truly comprehensive survey would be a monumental task given the sheer mass of literature in this area. The accessibility of the survey might also be questionable given the need to reconcile very different vocabularies and assumptions regarding clustering in the various communities.
The goal of this paper is to survey the core concepts and techniques in the large subset of cluster analysis with its roots in statistics and decision theory. Where appropriate, references will be made to key concepts and techniques arising from clustering methodology in the machine-learning and other communities.
The audience for this paper includes practitioners in the pattern recognition and image analysis communities (who should view it as a summarization of current practice), practitioners in the machine-learning communities (who should view it as a snapshot of a closely related field with a rich history of wellunderstood techniques), and the broader audience of scientific profes-
sionals (who should view it as an accessible introduction to a mature field that is making important contributions to computing application areas).
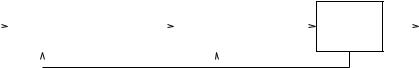
1.2 Components of a Clustering Task
Typical pattern clustering activity involves the following steps [Jain and Dubes 1988]:
(1)pattern representation (optionally including feature extraction and/or selection),
(2)definition of a pattern proximity measure appropriate to the data domain,
(3)clustering or grouping,
(4)data abstraction (if needed), and
(5)assessment of output (if needed).
Figure 2 depicts a typical sequencing of the first three of these steps, including a feedback path where the grouping process output could affect subsequent feature extraction and similarity computations.
Pattern representation refers to the number of classes, the number of available patterns, and the number, type, and scale of the features available to the clustering algorithm. Some of this information may not be controllable by the
ACM Computing Surveys, Vol. 31, No. 3, September 1999
|
|
|
|
|
|
Data Clustering |
· |
|
267 |
|
|
|
|
|
|
|
|
|
|
|
|
Patterns |
Feature |
Pattern |
Interpattern |
|
|
Clusters |
|
|||
Selection/ |
|
|
|
|||||||
|
|
Similarity |
|
Grouping |
|
|||||
|
Extraction |
Representations |
|
|
|
|
||||
|
|
|
|
|
|
|
|
|||
|
|
|
|
|
|
|
|
|
|
|
|
|
|
|
|
|
|
|
|
|
|
feedback loop
Figure 2. Stages in clustering.
practitioner. Feature selection is the process of identifying the most effective subset of the original features to use in clustering. Feature extraction is the use of one or more transformations of the input features to produce new salient features. Either or both of these techniques can be used to obtain an appropriate set of features to use in clustering.
Pattern proximity is usually measured by a distance function defined on pairs of patterns. A variety of distance measures are in use in the various communities [Anderberg 1973; Jain and Dubes 1988; Diday and Simon 1976]. A simple distance measure like Euclidean distance can often be used to reflect dissimilarity between two patterns, whereas other similarity measures can be used to characterize the conceptual similarity between patterns [Michalski and Stepp 1983]. Distance measures are discussed in Section 4.
The grouping step can be performed in a number of ways. The output clustering (or clusterings) can be hard (a partition of the data into groups) or fuzzy (where each pattern has a variable degree of membership in each of the output clusters). Hierarchical clustering algorithms produce a nested series of partitions based on a criterion for merging or splitting clusters based on similarity. Partitional clustering algorithms identify the partition that optimizes (usually locally) a clustering criterion. Additional techniques for the grouping operation include probabilistic [Brailovski 1991] and graph-theoretic [Zahn 1971] clustering methods. The variety of techniques for cluster formation is described in Section 5.
Data abstraction is the process of extracting a simple and compact representation of a data set. Here, simplicity is either from the perspective of automatic analysis (so that a machine can perform further processing efficiently) or it is human-oriented (so that the representation obtained is easy to comprehend and intuitively appealing). In the clustering context, a typical data abstraction is a compact description of each cluster, usually in terms of cluster prototypes or representative patterns such as the centroid [Diday and Simon 1976].
How is the output of a clustering algorithm evaluated? What characterizes a `good' clustering result and a `poor' one? All clustering algorithms will, when presented with data, produce clusters Ð regardless of whether the data contain clusters or not. If the data does contain clusters, some clustering algorithms may obtain `better' clusters than others. The assessment of a clustering procedure's output, then, has several facets. One is actually an assessment of the data domain rather than the clustering algorithm itselfÐ data which do not contain clusters should not be processed by a clustering algorithm. The study of cluster tendency, wherein the input data are examined to see if there is any merit to a cluster analysis prior to one being performed, is a relatively inactive research area, and will not be considered further in this survey. The interested reader is referred to Dubes [1987] and Cheng [1995] for information.
Cluster validity analysis, by contrast, is the assessment of a clustering procedure's output. Often this analysis uses a specific criterion of optimality; however, these criteria are usually arrived at
ACM Computing Surveys, Vol. 31, No. 3, September 1999
268 |
· |
A. Jain et al. |
subjectively. Hence, little in the way of `gold standards' exist in clustering except in well-prescribed subdomains. Validity assessments are objective [Dubes 1993] and are performed to determine whether the output is meaningful. A clustering structure is valid if it cannot reasonably have occurred by chance or as an artifact of a clustering algorithm. When statistical approaches to clustering are used, validation is accomplished by carefully applying statistical methods and testing hypotheses. There are three types of validation studies. An external assessment of validity compares the recovered structure to an a priori structure. An internal examination of validity tries to determine if the structure is intrinsically appropriate for the data. A relative test compares two structures and measures their relative merit. Indices used for this comparison are discussed in detail in Jain and Dubes [1988] and Dubes [1993], and are not discussed further in this paper.
1.3The User's Dilemma and the Role of Expertise
The availability of such a vast collection of clustering algorithms in the literature can easily confound a user attempting to select an algorithm suitable for the problem at hand. In Dubes and Jain [1976], a set of admissibility criteria defined by Fisher and Van Ness [1971] are used to compare clustering algorithms. These admissibility criteria are based on: (1) the manner in which clusters are formed, (2) the structure of the data, and (3) sensitivity of the clustering technique to changes that do not affect the structure of the data. However, there is no critical analysis of clustering algorithms dealing with the important questions such as
ÐHow should the data be normalized?
ÐWhich similarity measure is appropriate to use in a given situation?
ÐHow should domain knowledge be utilized in a particular clustering problem?
ÐHow can a vary large data set (say, a million patterns) be clustered efficiently?
These issues have motivated this survey, and its aim is to provide a perspective on the state of the art in clustering methodology and algorithms. With such a perspective, an informed practitioner should be able to confidently assess the tradeoffs of different techniques, and ultimately make a competent decision on a technique or suite of techniques to employ in a particular application.
There is no clustering technique that is universally applicable in uncovering the variety of structures present in multidimensional data sets. For example, consider the two-dimensional data set shown in Figure 1(a). Not all clustering techniques can uncover all the clusters present here with equal facility, because clustering algorithms often contain implicit assumptions about cluster shape or multiple-cluster configurations based on the similarity measures and grouping criteria used.
Humans perform competitively with automatic clustering procedures in two dimensions, but most real problems involve clustering in higher dimensions. It is difficult for humans to obtain an intuitive interpretation of data embedded in a high-dimensional space. In addition, data hardly follow the ªidealº structures (e.g., hyperspherical, linear) shown in Figure 1. This explains the large number of clustering algorithms which continue to appear in the literature; each new clustering algorithm performs slightly better than the existing ones on a specific distribution of patterns.
It is essential for the user of a clustering algorithm to not only have a thorough understanding of the particular technique being utilized, but also to know the details of the data gathering process and to have some domain expertise; the more information the user has about the data at hand, the more likely the user would be able to succeed in assessing its true class structure [Jain and Dubes 1988]. This domain informa-
ACM Computing Surveys, Vol. 31, No. 3, September 1999
tion can also be used to improve the quality of feature extraction, similarity computation, grouping, and cluster representation [Murty and Jain 1995].
Appropriate constraints on the data source can be incorporated into a clustering procedure. One example of this is mixture resolving [Titterington et al. 1985], wherein it is assumed that the data are drawn from a mixture of an unknown number of densities (often assumed to be multivariate Gaussian). The clustering problem here is to identify the number of mixture components and the parameters of each component. The concept of density clustering and a methodology for decomposition of feature spaces [Bajcsy 1997] have also been incorporated into traditional clustering methodology, yielding a technique for extracting overlapping clusters.
1.4 History
Even though there is an increasing interest in the use of clustering methods in pattern recognition [Anderberg 1973], image processing [Jain and Flynn 1996] and information retrieval [Rasmussen 1992; Salton 1991], clustering has a rich history in other disciplines [Jain and Dubes 1988] such as biology, psychiatry, psychology, archaeology, geology, geography, and marketing. Other terms more or less synonymous with clustering include unsupervised learning [Jain and Dubes 1988], numerical taxonomy [Sneath and Sokal 1973], vector quantization [Oehler and Gray 1995], and learning by observation [Michalski and Stepp 1983]. The field of spatial analysis of point patterns [Ripley 1988] is also related to cluster analysis. The importance and interdisciplinary nature of clustering is evident through its vast literature.
A number of books on clustering have been published [Jain and Dubes 1988; Anderberg 1973; Hartigan 1975; Spath 1980; Duran and Odell 1974; Everitt 1993; Backer 1995], in addition to some useful and influential review papers. A
Data Clustering · 269
survey of the state of the art in clustering circa 1978 was reported in Dubes and Jain [1980]. A comparison of various clustering algorithms for constructing the minimal spanning tree and the short spanning path was given in Lee [1981]. Cluster analysis was also surveyed in Jain et al. [1986]. A review of image segmentation by clustering was reported in Jain and Flynn [1996]. Comparisons of various combinatorial optimization schemes, based on experiments, have been reported in Mishra and Raghavan [1994] and Al-Sultan and Khan [1996].
1.5 Outline
This paper is organized as follows. Section 2 presents definitions of terms to be used throughout the paper. Section 3 summarizes pattern representation, feature extraction, and feature selection. Various approaches to the computation of proximity between patterns are discussed in Section 4. Section 5 presents a taxonomy of clustering approaches, describes the major techniques in use, and discusses emerging techniques for clustering incorporating non-numeric constraints and the clustering of large sets of patterns. Section 6 discusses applications of clustering methods to image analysis and data mining problems. Finally, Section 7 presents some concluding remarks.
2. DEFINITIONS AND NOTATION
The following terms and notation are used throughout this paper.
ÐA pattern (or feature vector, observa-
tion, or datum) x is a single data item used by the clustering algorithm. It
typically consists of a vector of d measurements: x 5 ~x1, . . . xd!.
ÐThe individual scalar components xi
of a pattern x are called features (or attributes).
ACM Computing Surveys, Vol. 31, No. 3, September 1999
270 |
· |
A. Jain et al. |
Ðd is the dimensionality of the pattern or of the pattern space.
ÐA pattern set is denoted - |
5 |
$x1, . . . xn%. The ith pattern in - |
is |
denoted xi 5 ~xi,1, . . . xi,d!. In many cases a pattern set to be clustered is
viewed as an n 3 d pattern matrix.
ÐA class, in the abstract, refers to a state of nature that governs the pattern generation process in some cases. More concretely, a class can be viewed as a source of patterns whose distribution in feature space is governed by a probability density specific to the class. Clustering techniques attempt to group patterns so that the classes thereby obtained reflect the different pattern generation processes represented in the pattern set.
ÐHard clustering techniques assign a
class label li to each patterns xi, identifying its class. The set of all labels
for |
a |
pattern |
set - is |
+ 5 |
$l1, |
. . . |
ln%, with |
li [ $1, ´ |
´ ´, k%, |
where k is the number of clusters.
ÐFuzzy clustering procedures assign to each input pattern xi a fractional degree of membership fij in each output cluster j.
ÐA distance measure (a specialization of a proximity measure) is a metric (or quasi-metric) on the feature space used to quantify the similarity of patterns.
3.PATTERN REPRESENTATION, FEATURE SELECTION AND EXTRACTION
There are no theoretical guidelines that suggest the appropriate patterns and features to use in a specific situation. Indeed, the pattern generation process is often not directly controllable; the user's role in the pattern representation process is to gather facts and conjectures about the data, optionally perform feature selection and extraction, and design the subsequent elements of the
clustering system. Because of the difficulties surrounding pattern representation, it is conveniently assumed that the pattern representation is available prior to clustering. Nonetheless, a careful investigation of the available features and any available transformations (even simple ones) can yield significantly improved clustering results. A good pattern representation can often yield a simple and easily understood clustering; a poor pattern representation may yield a complex clustering whose true structure is difficult or impossible to discern. Figure 3 shows a simple example. The points in this 2D feature space are arranged in a curvilinear cluster of approximately constant distance from the origin. If one chooses Cartesian coordinates to represent the patterns, many clustering algorithms would be likely to fragment the cluster into two or more clusters, since it is not compact. If, however, one uses a polar coordinate representation for the clusters, the radius coordinate exhibits tight clustering and a one-cluster solution is likely to be easily obtained.
A pattern can measure either a physical object (e.g., a chair) or an abstract notion (e.g., a style of writing). As noted above, patterns are represented conventionally as multidimensional vectors, where each dimension is a single feature [Duda and Hart 1973]. These features can be either quantitative or qualitative. For example, if weight and color are the two features used, then
~20, black! is the representation of a black object with 20 units of weight. The features can be subdivided into the following types [Gowda and Diday 1992]:
(1)Quantitative features: e.g.
(a)continuous values (e.g., weight);
(b)discrete values (e.g., the number of computers);
(c)interval values (e.g., the duration of an event).
(2)Qualitative features:
(a)nominal or unordered (e.g., color);
ACM Computing Surveys, Vol. 31, No. 3, September 1999

|
|
|
. |
|
|
|
|
.. |
|
|
|
|
. |
|
|
|
.. |
|
|
|
|
|
... |
|
|
|
|
. . |
|
|
|
|
... |
|
|
|
|
.. |
|
|
. .. . |
|
||
|
. ... |
|||
|
. . . |
|
||
.. .. . |
||||
.. .. ....... |
||||
|
... . |
|||
. .. . . |
||||
. . . . . |
||||
... . . . |
||||
... .... .. . |
||||
.. . ...... |
||||
. . . . . |
||||
. .. . . |
||||
. . . ...... |
||||
. . . . . . . |
||||
|
.. ... |
|||
.. |
|
|
... |
|
. . |
|
|
.. |
|
. . |
|
... |
||
.. |
|
|
. |
|
. |
|
|
. |
|
.. |
|
|
|
. |
. |
|
|
|
... |
. |
|
|
|
. |
. . |
|
|
|
.. |
. |
|
|
|
.. |
. |
|
|
. |
|
. . |
|
|
|
... |
. |
|
|
|
. |
. |
|
|
|
. |
. |
|
|
|
. |
. |
|
|
|
. |
. . |
|
|
|
... |
. .. |
|
|
|
. |
.... |
|
|
|
.. |
. |
|
|
|
. .. |
.. |
|
|
|
.. |
... |
|
|
|
.. |
... |
|
|
|
... |
. |
|
|
|
.. |
. |
|
|
|
. . |
. |
|
|
|
. . |
. |
|
|
|
. |
.. |
|
|
|
. |
. |
|
|
|
.. |
. |
|
|
|
. |
Figure 3. A curvilinear cluster whose points are approximately equidistant from the origin. Different pattern representations (coordinate systems) would cause clustering algorithms to yield different results for this data (see text).
(b)ordinal (e.g., military rank or qualitative evaluations of temperature (ªcoolº or ªhotº) or sound intensity (ªquietº or ªloudº)).
Quantitative features can be measured on a ratio scale (with a meaningful reference value, such as temperature), or on nominal or ordinal scales.
One can also use structured features [Michalski and Stepp 1983] which are represented as trees, where the parent node represents a generalization of its child nodes. For example, a parent node ªvehicleº may be a generalization of children labeled ªcars,º ªbuses,º ªtrucks,º and ªmotorcycles.º Further, the node ªcarsº could be a generalization of cars of the type ªToyota,º ªFord,º ªBenz,º etc. A generalized representation of patterns, called symbolic objects was proposed in Diday [1988]. Symbolic objects are defined by a logical conjunction of events. These events link values and features in which the features can take one or more values and all the objects need not be defined on the same set of features.
It is often valuable to isolate only the most descriptive and discriminatory features in the input set, and utilize those features exclusively in subsequent analysis. Feature selection techniques iden-
Data Clustering · 271
tify a subset of the existing features for subsequent use, while feature extraction techniques compute new features from the original set. In either case, the goal is to improve classification performance and/or computational efficiency. Feature selection is a well-explored topic in statistical pattern recognition [Duda and Hart 1973]; however, in a clustering context (i.e., lacking class labels for patterns), the feature selection process is of necessity ad hoc, and might involve a trial-and-error process where various subsets of features are selected, the resulting patterns clustered, and the output evaluated using a validity index. In contrast, some of the popular feature extraction processes (e.g., principal components analysis [Fukunaga 1990]) do not depend on labeled data and can be used directly. Reduction of the number of features has an additional benefit, namely the ability to produce output that can be visually inspected by a human.
4. SIMILARITY MEASURES
Since similarity is fundamental to the definition of a cluster, a measure of the similarity between two patterns drawn from the same feature space is essential to most clustering procedures. Because of the variety of feature types and scales, the distance measure (or measures) must be chosen carefully. It is most common to calculate the dissimilarity between two patterns using a distance measure defined on the feature space. We will focus on the well-known distance measures used for patterns whose features are all continuous.
The most popular metric for continuous features is the Euclidean distance
d2~xi, xj! 5 ~ Od ~xi, k 2 xj, k!2!1/ 2 k51
5 ixi 2 xji2,
which is a special case (p52) of the Minkowski metric
ACM Computing Surveys, Vol. 31, No. 3, September 1999
272 |
· |
A. Jain et al. |
dp~xi, xj! 5 ~ Od ?xi, k 2 xj, k?p!1/p k51
5 ixi 2 xjip.
The Euclidean distance has an intuitive appeal as it is commonly used to evaluate the proximity of objects in two or three-dimensional space. It works well when a data set has ªcompactº or ªisolatedº clusters [Mao and Jain 1996]. The drawback to direct use of the Minkowski metrics is the tendency of the largest-scaled feature to dominate the others. Solutions to this problem include normalization of the continuous features (to a common range or variance) or other weighting schemes. Linear correlation among features can also distort distance measures; this distortion can be alleviated by applying a whitening transformation to the data or by using the squared Mahalanobis distance
dM~xi, xj! 5 ~xi 2 xj!S21~xi 2 xj!T,
where the patterns xi and xj are as-
sumed to be row vectors, and S is the sample covariance matrix of the patterns or the known covariance matrix of
the pattern generation process; dM~z , z! assigns different weights to different features based on their variances and pairwise linear correlations. Here, it is implicitly assumed that class conditional densities are unimodal and characterized by multidimensional spread, i.e., that the densities are multivariate Gaussian. The regularized Mahalanobis distance was used in Mao and Jain [1996] to extract hyperellipsoidal clusters. Recently, several researchers [Huttenlocher et al. 1993; Dubuisson and Jain 1994] have used the Hausdorff distance in a point set matching context.
Some clustering algorithms work on a matrix of proximity values instead of on the original pattern set. It is useful in such situations to precompute all the
n~n 2 1! / 2 pairwise distance values
for the n patterns and store them in a (symmetric) matrix.
Computation of distances between patterns with some or all features being noncontinuous is problematic, since the different types of features are not comparable and (as an extreme example) the notion of proximity is effectively bi- nary-valued for nominal-scaled features. Nonetheless, practitioners (especially those in machine learning, where mixed-type patterns are common) have developed proximity measures for heterogeneous type patterns. A recent example is Wilson and Martinez [1997], which proposes a combination of a modified Minkowski metric for continuous features and a distance based on counts (population) for nominal attributes. A variety of other metrics have been reported in Diday and Simon [1976] and Ichino and Yaguchi [1994] for computing the similarity between patterns represented using quantitative as well as qualitative features.
Patterns can also be represented using string or tree structures [Knuth 1973]. Strings are used in syntactic clustering [Fu and Lu 1977]. Several measures of similarity between strings are described in Baeza-Yates [1992]. A good summary of similarity measures between trees is given by Zhang [1995]. A comparison of syntactic and statistical approaches for pattern recognition using several criteria was presented in Tanaka [1995] and the conclusion was that syntactic methods are inferior in every aspect. Therefore, we do not consider syntactic methods further in this paper.
There are some distance measures reported in the literature [Gowda and Krishna 1977; Jarvis and Patrick 1973] that take into account the effect of surrounding or neighboring points. These surrounding points are called context in Michalski and Stepp [1983]. The simi-
larity between two points xi and xj, given this context, is given by
ACM Computing Surveys, Vol. 31, No. 3, September 1999
|
|
|
|
Data Clustering |
· |
273 |
|
X 2 |
X 2 |
|
|
|
|||
|
C |
|
|
C |
|
|
|
|
B |
|
B |
|
|
|
|
|
A |
|
A |
|
|
|
|
|
|
|
|
D |
|
|
|
|
|
|
|
F E |
|
|
|
|
|
X 1 |
|
|
|
|
X 1 |
|
|
|
|
|
|
||
Figure 4. A and B are more similar than A |
Figure 5. After a change in context, B and C |
||||||
and C. |
are more similar than B and A. |
|
|
|
|||
s~xi, xj! 5 f~xi, xj, %!,
where % is the context (the set of surrounding points). One metric defined using context is the mutual neighbor distance (MND), proposed in Gowda and Krishna [1977], which is given by
MND~xi, xj! 5 NN~xi, xj! 1 NN~xj, xi!,
where NN~xi, xj! is the neighbor num-
ber of xj with respect to xi. Figures 4 and 5 give an example. In Figure 4, the nearest neighbor of A is B, and B's
nearest neighbor is A. So, NN~A, B! 5 NN~B, A! 5 1 and the MND between A and B is 2. However, NN~B, C! 5 1 but NN~C, B! 5 2, and therefore
MND~B, C! 5 3. Figure 5 was obtained from Figure 4 by adding three new
points D, E, and F. Now MND~B, C!
5 3 (as before), but MND~A, B! 5 5. The MND between A and B has increased by introducing additional points, even though A and B have not moved. The MND is not a metric (it does not satisfy the triangle inequality [Zhang 1995]). In spite of this, MND has been successfully applied in several clustering applications [Gowda and Diday 1992]. This observation supports the viewpoint that the dissimilarity does not need to be a metric.
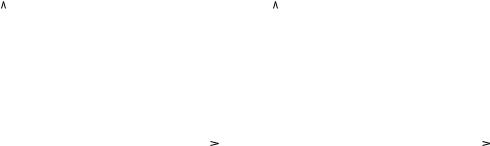
Watanabe's theorem of the ugly duckling [Watanabe 1985] states:
ªInsofar as we use a finite set of predicates that are capable of dis- tinguishing any two objects con- sidered, the number of predicates shared by any two such objects is constant, independent of the choice of objects.º
This implies that it is possible to make any two arbitrary patterns equally similar by encoding them with a sufficiently large number of features. As a consequence, any two arbitrary patterns are equally similar, unless we use some additional domain information. For example, in the case of conceptual clustering [Michalski and Stepp 1983],
the similarity between xi and xj is defined as
s~xi, xj! 5 f~xi, xj, #, %!,
where # is a set of pre-defined concepts. This notion is illustrated with the help of Figure 6. Here, the Euclidean distance between points A and B is less than that between B and C. However, B and C can be viewed as ªmore similarº than A and B because B and C belong to the same concept (ellipse) and A belongs to a different concept (rectangle). The conceptual similarity measure is the most general similarity measure. We
ACM Computing Surveys, Vol. 31, No. 3, September 1999