

6 курс / Неонатология / Научное_обоснование_механизмов_управления_младенческой
.pdf241
|
|
|
|
|
|
|
|
|
|
|
|
|
|
|
|
|
|
|
|
|
|
|
|
|
|
|
|
|
|
|
|
Figure 5.2. Marital status of puerperas, (%). |
Figure 5.3. Maternity hospital |
||||||
|
|
|
|
|
|
|
accommodation |
Most parturient women (63,9%) lived in urban areas, and 36,2% - in rural areas (figure 5.4).
Women-puerperas with the 2nd pregnancy predominated, accounting for 31,0%, in second place were women with the first ordinal pregnancy number – 27,2%, in the third - with the third – 18,8%, in the fourth - with the fourth – 16,4%, on the fifth - with the fifth – 6,6% (figure 5.5).
Figure 5.4. The place of residence of the maternity patients (%).
Figure 5.5. Serial number of pregnancy (%).
In 93,4%, the pregnancy of the study group of puerperas proceeded without complications. 6,6% of puerperas had complications during pregnancy (figure 5.6).
In the studied population of women in childbirth, the first place was occupied by women with the first serial number of childbirth, accounting for 32,9%, the second place - by the second serial number of childbirth 31,0%, the third - by the third 17,8%, the fourth - by the fourth 13,6%, the fifth - the fifth and more than 4,7% (Pic. 5.7).
242
|
|
|
|
|
|
|
|
|
|
|
|
|
|
|
|
Figure 5.6. Pregnancy conditions |
Figure 5.7. Serial number of genera (%). |
||||||||||||||
Without complications, childbirth proceeded in 90.6% of women in labor, with complications - in 9.4% (figure 5.8).
Physiological delivery was predominant, at 71.8%, and caesarean delivery was the lowest proportion at 28.2% (figure 5.9).
|
|
|
|
|
|
|
|
|
|
|
|
|
|
|
|
|
|
|
|
|
|
|
|
Figure 5.8. Complications of childbirth (%). |
Figure 5.9. The order of delivery (%). |
||||||
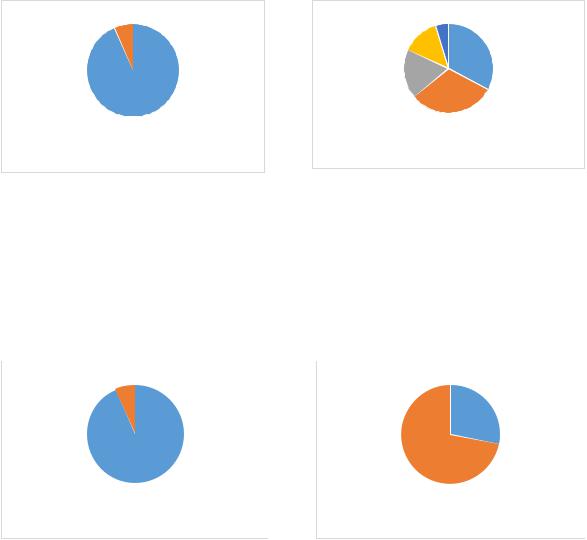
The results of the survey showed that 9,9% of mothers had bad habits. The largest proportion of respondents 90,1% did not have bad habits (figure 5.10).
Since most of the women in labor who were interviewed were married, the father's lifestyle, including his attitude to bad habits, also mattered. In the process of a sociological survey, it was revealed that 63,4% of fathers did not have bad habits, and 36,6% did (figure 5.11).
As a result of a survey of women in labor about the factor "adequate nutrition during pregnancy", 86,4% of respondents confirmed the fact of adequate nutrition during pregnancy, and 13,6% rejected it (figure 5.12).
31,5% of respondents testified to increased physical activity during pregnancy, while 68,5% stated the opposite (figure 5.13).
Рекомендовано к изучению сайтом МедУнивер - https://meduniver.com/

243
|
|
|
|
|
|
|
|
|
|
Figure 5.10. Bad habits of the mother (%). |
Figure 5.11. Bad habits of the father (%). |
||||||||
|
|
|
|
|
|
|
|
|
|
|
|
|
|
|
|
|
|
|
|
Figure 5.12. |
Adequate nutrition during Figure 5.13. Increased physical activity during |
pregnancy (%). |
pregnancy (%). |
The largest proportion of women in labor (87,8%) testified to the absence of infectious diseases in the family, 12,2% confirmed their presence (figure 5.14).
In the anamnesis of pregnancy, only 11,3% of women in labor confirmed the presence of sexually transmitted diseases, the remaining 88,7% testified to the opposite (figure 5.15).
Figure 5.14. The presence of infectious diseases in the family of pregnant women (%).
Figure 5.15. The presence of STDs in anamnesis of pregnant women (%)

244
61,1% of respondents were involved in the treatment of sexually transmitted diseases, 38,9% were not treated (figure 5.16).
Recovery after sexually transmitted diseases occurred in 92,3% of cases, in 7,7% there was no recovery (figure 5.17).
Figure 5.16. Treatment of STDs in anamnesis of pregnant women (%).
Figure 5.17. Recovery after treatment of STDs in anamnesis of pregnant women (%).
To the question "Presence of genetic diseases in the family" 78,9% of respondents denied their presence, 21,1% confirmed their presence (figure 5.18).
Less than 20% of the mothers surveyed noted the presence of diseases of the female genital area, a little more than 80% denied the presence of this group of diseases (figure 5.19).
Figure 5.18. The presence of genetic diseases in the family of pregnant women, (%).
Figure 5.19. The presence of diseases of the female genital area (%).
Menarche occurred at 12 years in 31,9%, 13 years in 28,6%, 14 years in 20,2%, 11 years in 13,2%, and 10 years in 6,1% , which testified to the normal physical development of mothers and full readiness for childbearing (figure 5.20).
Рекомендовано к изучению сайтом МедУнивер - https://meduniver.com/

245
Menstruation proceeded regularly in 88,3% of the respondents, 11,7% - irregularly (Figure 5.21).
Figure 5.20. Age of onset of menarche of mothers (%).
Figure 5.21. Regularity of menstruation in mothers (%).
The duration of the menstrual cycle in 56,8% of the respondents was 25-28 days, in 23,5% - up to 25 days, in 19,7% - over 28 days, which was characterized as a variant of the norm and indicated the maturity of the mother's body and readiness for bearing fetus and childbearing (figure 5.22).
In 74,7% of the respondents, menstruation was profuse, in 25.3% - not (figure
5.23).
Figure 5.22. Age of onset of menarche of mothers (%).
Figure 5.23. Menstruation was profuse (%).
The presence of somatic diseases was noted by 60,6% of women in labor, their absence - by 39,4% (figure 5.24).
The duration of somatic pathology in mothers was from 1 to 3 years in 40,8% of mothers, up to 1 year in 31,5% of mothers, from 3 to 5 years in 14,6% of mothers, over 5 years in 13,1% (figure 5.25).

246
|
|
|
|
|
|
|
|
|
|
|
|
|
|
|
|
|
|
|
|
|
|
|
|
|
|
|
|
|
|
|
|
|
|
|
|
|
|
|
|
Figure 5.24 The presence of somatic diseases |
Figure 5.25. The duration of the course of |
||||||||
of mothers (%). |
|
somatic diseases of mothers (%). |
|||||||
Only 43,7% of women in labor were engaged in preparation for childbirth, and 56,3% did not prepare for childbirth (figure 5.26).
When planning a pregnancy, 44,1% of women turned to genetic counseling, while 55,9% did not use it (figure 5.27).
Figure 5.26. Preparation for childbirth of mothers (%).
Figure 5.27. Genetic counseling when planning pregnancy (%).
39,3% of women received genetic counseling to identify the risks of miscarriage, and 60,7% did not receive it (figure 5.28).
The results of the assessment of the risk of miscarriage among those who underwent genetic counseling were distributed as follows: 71,4% were women with low risk, 17,4% - moderate risk, 11,2% - high risk (figure 5.29).
Рекомендовано к изучению сайтом МедУнивер - https://meduniver.com/

247
Figure 5.28. Genetic counseling to identify the risks of miscarriage, (%).
Figure 5.29. Genetic counseling for detection of miscarriage risk levels (%).
The gestational age of the newborn was 37-41 weeks in 85,5% of women, 41-42 weeks in 7,9%, up to 37 weeks in 6,6% (figure 5.30).
The majority of women (85.9%) noted that the actual term of childbirth corresponded to the expected one, 14.1% noted that the actual term of childbirth did not match the expected one (figure 5.31).
|
|
|
|
|
|
|
|
|
|
|
|
|
|
|
|
|
|
|
|
|
|
|
|
|
|
|
|
|
|
|
|
|
|
|
|
|
|
|
|
Figure 5.30. Gestational age of newborns (%). |
Figure 5.31. Correspondence of the actual |
||||||||
|
|
|
|
|
term of these births to the estimated one, (%). |
||||
Delivery in the form of partner labor was supported by less than half of the women (47,4%), 52,6% considered it inappropriate (figure 5.32).
The largest proportion of women (90,1%) positively assessed the health of newborns and rated them as "Healthy", 9,9% of women considered their child unhealthy (figure 5.33).

248
Figure 5.32. Delivery in the form of partner childbirth (%).
Figure 5.33. Newborn health (%).
The largest proportion of newborns was breast-fed (77,9%), 12,7% - mixed-fed, 9,4% - bottle-fed (figure 5.34).
The timing of discharges from the maternity ward was determined by the condition of the woman and the child, the method of delivery, and the presence of complications. The absence of pathology of the mother and the newborn made it possible to carry out an extract for 3-4 days after birth. When a woman was undergoing manipulations during childbirth (for example, suturing), the discharge was postponed for 5-6 days. In the presence of complications during childbirth (bleeding, etc.), the discharge was carried out no earlier than on the 7 th day. If delivery was carried out by caesarean section, they were discharged from the perinatal center on the 7-10th day.
|
|
|
|
|
|
|
|
|
|
|
|
|
|
|
|
|
|
|
|
|
|
|
|
|
|
|
|
|
|
|
|
|
|
|
|
|
|
|
|
|
|
|
|
|
|
|
|
|
|
|
|
|
|
|
|
|
|
|
|
|
|
|
|
|
|
|
|
|
|
|
|
|
|
|
|
|
|
|
|
|
|
|
|
Figure 5.34. Type of feeding of newborns (%). |
Figure 5.35. Terms of discharge from the |
||||||||||
|
|
|
|
|
perinatal center (on what day was discharged) |
||||||
|
|
|
|
|
(%). |
|
|
||||
Thus, discharge from the perinatal center was carried out on the 4th day in 46,9% of women, on the 5th day - in 17,4%, on the 6th day – 13,6%, on the 7 th day – 14,1%,
Рекомендовано к изучению сайтом МедУнивер - https://meduniver.com/

249
on the 8 th – 4,2%, 9 th – 3,2%, 10 th – 0,5% (figure 5.35). The data obtained indicated that childbirth without complications was less than 50%.
As medical and demographic determinants of infant mortality were the health indicators of mothers who gave birth to children, and accumulating many socioeconomic and organizational and medical factors that determine the level of health of women and children, laid down in the target indicators of specialized Federal and National projects. That is why it was extremely important to assess the dynamics of the incidence rates of women who gave birth to children both in the pre-reform period and during the period of the relevant state programs.
So, in the interval from 2016 to 2020, there was a significant decrease in the incidence of mothers, as evidenced by:
-correlation coefficient, reflecting a strong relationship between the signs (time and incidence) and amounting to 0,77;
-coefficient of determination, which explains the nature of the dynamics of changes in the incidence of women-mothers over time (0,6);
-regression coefficient (slope coefficient), which characterizes the value of changes in the incidence rate on average over 5 years (79,4 per 1000 women);
-coefficient of reliability (significance) (p < 0,05) (figure 5.36).
Figure 5.36. Incidence of mothers who gave birth to children in the Republic of Ingushetia in 2016-
2020 (‰).

250
The five-year characteristic of anemia, set as a diagnosis for pregnant women who gave birth to children in 2016-2020, had a steady downward trend, as evidenced by the correlation coefficient (0,87), determination coefficient (0,76), significance coefficient (0,05) and regression coefficient (-0,04) (figure 5.37).
Figure 5.37. Anemia in mothers who gave birth in the Republic of Ingushetia in 2016-2020 (‰).
There was a significant decrease in the “Threat of abortion” indicator from 304,9‰ to 239,6‰ in the interval from 2016 to 2020. Coefficients: correlations (0,87) characterized the presence of a strong relationship between the signs, determination (0,76) indicated the presence of a pronounced decrease in the indicator, regression (- 18,02) reflected the five-year average value of the decrease in the value of this nosological group, and the reliability coefficient ( 0,05) confirmed the presence of a significant difference between the studied indicators) (figure 5.38).
Figure 5.38. Threat of termination of pregnancy in mothers who gave birth to children in the
Republic of Ingushetia in 2016-2020. (‰).
Рекомендовано к изучению сайтом МедУнивер - https://meduniver.com/