

549_Sovremennye_problemy_telekommunikatsij_
.pdfnumbers. At last, we can talk about informativeness – a value, which shows us how much influence has the change of fuzziness to the value of the objective function. In practice this problem could stay for the process of maintenance of big network in the state of lack of resources. Knowing the informativeness, we can consider, which elements of our network are more important in terms of specifying their condition.
In this paper in most of the examples we are using the logarithmic entropy as the measure of |
|||
fuzziness: |
∫ |
( |
) |
|
|
|
|
where
Let’s consider a simple example to show the problem closely. Let each edge of G have a
triangular number |
|
|
|
|
|
as a fuzzy parameter. |
Operationsbetweenthemcould |
be |
|
||||
defined as: |
|
|
|
|||
Here we can consider these triangular numbers as probabilities of presence for the graph elements with some additional parameters ( and ).
(a)
(b)
1. Informativeness of network elements
On the Fig.1(a) we compare connection possibility (fuzzy analogue of connection probability) of two subgraphs connected by a bridge before and after changing the fuzziness of this bridge. At
the beginning, the fuzzy number corresponding to objective function value equals |
. |
||||||
If we now change the fuzzy parameter of bridge to |
|
|
connection possibility value becomes |
||||
equal to |
. |
|
|
|
|
||
In the |
case (b) we are |
calculating the possibility of connection of two subgraphs. Without |
|||||
changing parameters this value equals |
|
. Alternately modifying fuzzy numbers |
|||||
corresponding to both edges of the bridge, we |
get different |
results. It means that these elements are |
|||||
not equal in terms of informativeness.
111

Consequently, informativeness of elements can be affected not only by their own fuzzy parameters but also by the structure of the whole network and parameters of other edges. It is obvious that we only need to compare the values of informativeness of elements, so we can try to use different heuristic algorithms.
We are currently checking the hypothesis, which lets us to use not the whole graph but only some subgraphs containing the edges we try to compare. This localization could dramatically decrease the calculation difficulty (e.g. using the minimal chain containing objective edges makes the solution trivial).
3. Conversion of fuzzy numbers
Converting different types of fuzzy parameters is another important problem. If we get network parameters from different sources, they can be represented in different types of fuzzy numbers. So we have to convert them to one common type and keep the most information they initially have. The problem is: how to choose this common type to lose the least amount of informativeness?
Knowing the membership function of the fuzzy number we can easily find the logarithmic |
||
entropy. E.g. for triangular numbers |
it equals |
. Now if we know the measure of |
informativeness we can set arithmetic operations to correspond to any specific problem (depending on the objective function, network structure etc.). So we have to commit not only the measure but also the set of operations on our fuzzy parameters.
The problem appears when we try to convert these parameters from one type to another e.g. trapezoidal numbers to triangular or triangular numbers to intervals.
Let’sconsideranothersimpleexampletoshowit.
(a)
(b)
2. Converting fuzzy numbers
Let A be a triangular number |
As shown above, its logarithmic entropy equals |
|
|
||||
|
|||||||
. Let’s build a trapezoidal number |
by changing. |
the membership function to 1 on the interval with |
|||||
length |
(Fig.2(a)). Its entropy equals |
|
|
. As we see, logarithmic entropy |
|||
|
|||||||
|
|
112 |
|
|
|||
decreases and this can be treated as information loss since we don’t use any additional information about network to change that parameter.
If we try to keep the value of one chosen fuzziness measure (Fig.2(b)), we obviously get the changes in other ways of calculating it. So we have to choose this function carefully for the current problem in order to avoid the artificial changes of entropy.
Another important special case is representing fuzzy parameters by intervals, which actually can not be straightly represented as classic fuzzy numbers. Arithmetic of intervals is a special algebraic system, which formalizes operations on intervals. Converting classic fuzzy numbers to
intervals and back can be done in different ways. |
|
|
|
|
The easiest idea is to build membership function as constant on the interval with length |
. |
|||
Entropy then equals: |
( |
|
) |
|
|
|
|
|
|
Keeping the entropy value we can get |
or |
. But here we obviously |
lose |
|
information about the peak of the initial parameter. |
|
|
|
|
To show the reverse connection between these types of fuzzy numbers we formulate the following lemma:
Lemma 1.Let the fuzziness measure on intervals and triangular numbers be continuous, strictly
monotone functions |
and |
, and is differentiable on [0,1]. Now if for some interval |
with length |
we have |
, then additional fuzziness on converting in- |
terval to triangular number is bounded by the value depending only on .
Proof.Let’s point out that we only need to proof the case, where the entropy growth, i.e.:
Consequently from the condition of lemma: |
|
|
Then using the mean value theorem: |
) |
|
|
( |
|
Remark: In lemma proof |
is bounded[ ]by 1, but in practice this value can be much smaller. |
|
We can define membership function for intervals as 0.5 on the interval with length . It gives estimation for entropy difference ( ). Lemma gives rough estimation for reverse conversion and provides better results for special cases.
4. Algorithms examples
4.1. Search of spanning trees
Problem of searching the minimum spanning tree can be easily solved by many algorithms. Getting a single spanning tree is also a trivial task, which can be resolved by either depth-first search or breadth-first search in linear time. These trees can be used for calculating network connection probability.
For any graph, the number of spanning trees can be calculated using Kirchhoff’s matrix-tree theorem. In the fuzzy models we can try to find best spanning trees, or even trees with fuzzy restrictions. Difficulty of such problems can vary depending on our model. For example, we can represent the informal description of heuristic algorithm for searching the set of trees meeting the fuzzy restrictions on connection possibility. It is based on the local search method. On each iteration we try to change oneof the edges of current tree without breaking the connection. As a result we get
113
some set of spanning trees without the full search. Depending on the fuzziness measure and initial restrictions we can ignore ünpromising" trees during each iteration.
4.2. Connection of bipartite graph
Let G be a bipartite graph with a set of fuzzy edges as a bridge between its subgrapghs. We need to choose a subset of these edges to have the maximal connection possibility with limited summary weight (represented by another fuzzy parameter in common case).
With additional restrictions we can get different problems of discrete optimization. For example, with prohibition on "boundary" nodes to have more then one incidental edge from the
"bridge" set, we get the problem of maximal matching. Here we don’t have any additional restrictions, so we get the 0-1 knapsack problem. All initial parameters are considered fuzzy numbers.
Let’s look more carefully at the greedy algorithm. Like for the real parameters, it doesn’t always give the exact solution. For testing we used triangular numbers with two different sets of operations for weights and possibilities. Since the possibilitiesof presence must be limited by the fuzzy analogue of segment [0,1], operations were formulated in this way: centers were handled as usual probabilities and boundaries were found as mean values.
For weights we additionally had to define multiplicative inverse element and full order. So we |
|||||||||||
|
|
|
|
|
|
|
|
|
|
|
|
used operations defining the field of triangular numbers: |
|
|
|
||||||||
|
|
|
|
|
|
|
|
|
|
|
|
Multiplicativeinversevalue: |
|
|
|
|
|
|
|
|
|
|
|
|
|
|
|
|
|
|
|
||||
|
|
|
|
|
|
|
|
||||
It is possible to avoid defining some additional operations on weight, e.g. by using any other
function growing with possibility growth and decreasing with weight growth instead of common |
||||
ratio. Algorithm is obviously polynomial: sorting for |
( |
) and then passing elements. |
||
[ ] |
[ ] [ ] |
[ ] |
|
|
[ ] |
[ ] |
[ ] |
114

[ |
] [ |
] |
[ |
] |
|
In this algorithm we consider all values template, extending FuzzyNumber class (i.e. triangular numbers). All used operations must be defined for the exact types of fuzzy numbers. This approach has to use the multiplicative inversion, which we don’t need for brute-force search. And most of the results for the normal greedy algorithm for knapsack problem can be applied in our case as well.
Having the trivial realization, this problem shows flexibility and convenience of fuzzy models. This algorithm was implemented using object-oriented programming language Java, as a part of a big package dedicated to fuzzy networks. First of all, using interfaces allows to make a template algorithm without specifying type of fuzzy numbers and operations on them. Secondary, it is easy to think of hierarchy of fuzzy numbers, which can also be easily represented using object-oriented paradigm (Fig.3). Any algorithm can be implemented as a separate generic class, and interfaces allow to monitor the correctness of used operations.
3. Example of fuzzy numbers class hierarchy
5. Conclusion
The brief results presented above shows some problems in fuzzy modeling of unreliable telecommunications networks. We hope that the problem of using different presentations of uncertainness in description of one unreliable network will attract attention of other researchers. Our initial theoretical results for converting fuzzy parameters and informal descriptions of algorithms on fuzzy models may be useful for automation of constructing fuzzy models of telecommunication and other networks.
Our next goal is comparing network elements’ informativeness by using the “localization” method. We also want to check the advantages of switching between different types of fuzzy parameters on the examples of big networks with much fuzzy data represented in three or more ways.
115
Acknowledgements
This work is created with assistance of my scientific adviser, professor Alexey S. Rodionov, ICM&MG SB RAS.
Bibliography
1.C. J. Colbourn,TheCombinatorics of Network Reliability. New York, NY, USA: Oxford University Press, Inc., 1987.
2.L. Jereb, “Network reliability: models, measure and analysis,” in Proceedings of the 6th IFIP
Workshop on Performance Modeling and Evaluation of ATM Networks, 1998, pp. T02/1-T02/10.
3.B. Awerbuch and S. Event, “Reliable broadcast protocols in unreliable networks,” Networks, vol. 16, no. 4, pp. 381-396, 1986.[Online]. Available: http://dx.doi.org/10.1002/net.3230160405
4.P. Rafiee and S. G. Latif, “Evaluating the reliability of communication networks wan using their fuzzy fault tree analysis - a case study,” The Journal of Mathematics and Computer Science
(JMCS), |
vol. |
2, |
no. |
2, |
pp. |
262-270, |
2011. |
[Online]. |
Available: |
http://www.tjmcs.com/includes/files/articles/Vol2_Iss2_262 |
|
|
|
||||||
5.D. S. Jena and M. K. Deepthi, “Fuzzy reliability analysis in interconnection networks,” Interna- tional Journal of Computational Engineering, vol. 1, no. 1, pp. 262-270, 2011.[Online]. Available: www.ijceroline.com/papers/vol1_issue1/c0110115022.pdf
6.R. Sujatha and B. Praba, “Fuzzy reliability of a network using fuzzy sum of disjoint product technique,” International Journal of Recent Trends in Engineering, vol. 2, no. 2, pp. 10-12, November 2009.
116
Сравнение пропускной способности систем четвѐртого поколения сотовой связи для алгоритмов пла-
нирования Round Robin и Best CQI1
Д. В. Завьялова, А. В. Андреев
Целью данной работы является разработка имитационной модели, позволяющей оценить пропускную способность сети LTE для разных алгоритмов планирования частотно- временных ресурсов и при различных параметрах системы.
С помощью имитационной модели были получены графики зависимости пропускной способности системы от входной нагрузки, позволяющие наглядно оценить производительность системы при различной полосе и алгоритме планирования.
Для исследования были выбраны алгоритмы планирования Round Robin и Best CQI.
Ключевые слова: LTE2,, планирование, 4G.
1. Введение
Развитие сетей 4G (Fourth Generation) сейчас происходит бурными темпами, и наличие удобного инструмента для теоретического исследования данных систем будет полезно как при их проектировании, так и при эксплуатации.
Технология LTE – это основное направление эволюции сетей сотовой связи третьего поколения 3G (Third Generation). В январе 2008 г международное объединение 3GPP (Third Generation Partnership Project), разрабатывающее перспективные стандарты мобильной связи,
утвердило LTE в качестве следующего после UMTS (Universal Mobile Telecommunications
System) стандарта широкополосной сети мобильной связи.
LTE обеспечивает теоретическую пиковую скорость передачи данных до 326,4 Мбит/с от базовой станции к пользователю и до 172,8 Мбит/с в обратном направлении. Для сравнения, сети второго поколения 2G (Second Generation) теоретически способны обеспечить пиковую скорость передачи данных с помощью технологии GPRS (General Packet Radio Service) 56-
114 Кбит/с, а помощью EDGE (Enhanced Data rates for GSM Evolution) до 473,6 Кбит/с. Сети третьего поколения 3G обеспечивают скорость передачи данных до 3,6 Мбит/с. [1]
Сети 4G на основе стандарта LTE способны работать практически по всей ширине спектра частот от 700 МГц до 2,7 ГГц.
Пропускная способность системы сильно зависит от выбранного алгоритма распределения частотно-временных ресурсов (алгоритма планирования). Используемые алгоритмы не определены спецификациями, они разрабатываются поставщиками оборудования. Правильный выбор алгоритма может повысить пропускную способность системы, не увеличивая ширину полосы.
На данный момент разрабатывается множество алгоритмов, целью которых является повышение эффективности использования ресурсов системы. Исследования позволяют наглядно оценить эффективность каждого алгоритма, понять при каких условиях он наиболее эффективен, и выбрать оптимальный.
1CQI – Channel Quality Indicator
2LTE – Long-Term Evolution
117
Исследования в данной области проводят множество учѐных. На данную тему написано большое количество научных статей (для примера [2-3]). В них нет возможности исследования работы алгоритмов при различной полосе системы и различном числе активных пользователей. Эти недостатки были учтены при разработке нашей имитационной модели.
2. Краткие теоретические сведения
2.1. Физический уровень LTE
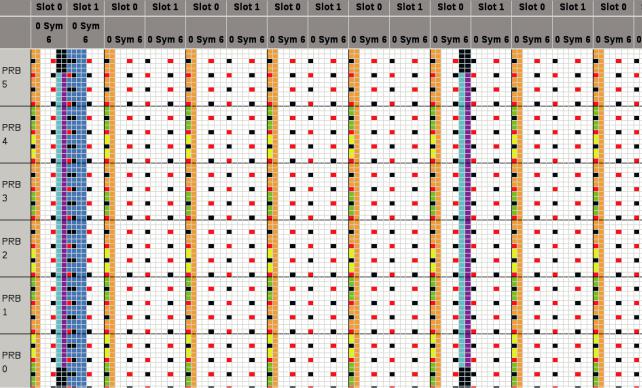
Стандарт LTE на физическом уровне использует технологию Orthogonal Frequency Division Multiplexing (OFDM). При использовании технологии OFDM передача данных осуществляется на множестве частотных поднесущих (subcarrier). Весь канальный ресурс разбивается на ресурсные блоки (РБ, Resource Block, RB). Один блок состоит из 12 расположенных рядом поднесущих, занимающих полосу 180 кГц, и одного временного слота (6 или 7 OFDM символов общей длительностью 0.5 мс). Ниже на рис. 1 изображена структура фрейма LTE, и показано, как размещены различные физические каналы [4].
Рис. 1. Размещение каналов по ресурсным элементам.
Как уже было сказано, ресурсы абоненту для передачи данных выделяются ресурсными блоками (РБ). Решение о том, какое число РБ нужно абоненту, какие схемы модуляции и кодирования использовать принимает планировщик частотных ресурсов.
2.2. Алгоритмы планирования
Существуют различные способы планирования. В самом простом случае, ресурсы между абонентами распределяются в порядке поступления запросов, не учитывая структуру передаваемых данных и прочие условия (алгоритм Round Robin). Другие алгоритмы принимают решение, основываясь на качестве канала, выделяя абоненту ресурсы с наилучшим качеством
118
(алгоритм Best CQI). Такой алгоритм планирования позволяет увеличить пропускную способность системы, за счет оптимального использования схемы модуляции и кодирования.
Более сложные алгоритмы планирования учитывают, какие данные присутствуют в запросе абонента, и осуществляет выделение ресурсов в порядке приоритета имеющихся данных. В настоящее время пользователи могут запускать большое множество различных приложений на своих клиентских устройствах. При этом каждое приложение имеет свои требования к качеству обслуживания. Каждому типу данных приписан свой идентификатор QoS
(Quality of Service) класса (QoS Class Identifier, QCI). Каждый QCI определяет значения для следующих параметров QoS: приоритет, допустимая задержка и допустимое количество потерянных пакетов [5].
Как правило, значения приоритета и допустимой задержки определяют каким образом планировщик на eNodeB (Evolved Node B) будет обрабатывать пакеты данных.
3.Результаты моделирования
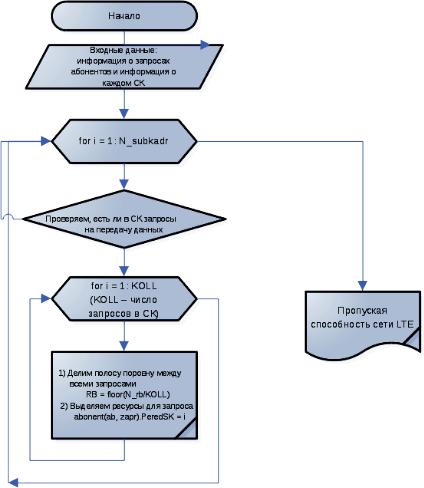
Входе исследования были разработаны имитационные модели алгоритмов планирования Round Robin и Best CQI. Ниже, на рис. 2, приведена краткая блок-схема алгоритма планирования.
Рис. 2. Функциональная блок схема алгоритма планирования
Имитационная модель позволяет оценить пропускную способность системы LTE при различных параметрах для алгоритмов Round Robin и Best CQI. В ходе исследования были получены следующие графики зависимости, приведѐнные на рис. 3 и 4.
119
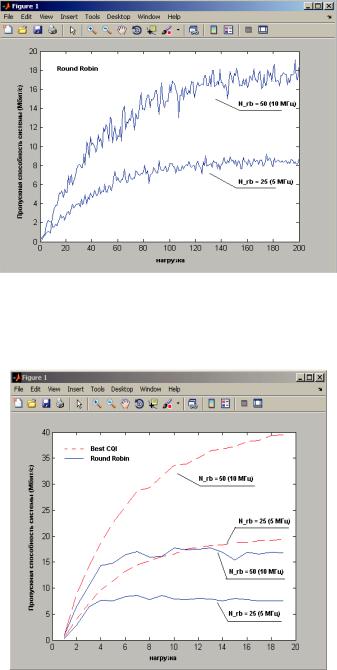
На рис. 3 представлены графики зависимости пропускной способности системы от интенсивности входной нагрузки для различных параметров системы.
Рис. 3. Графики зависимости пропускной способности системы от интенсивности входной нагрузки для алгоритма планирования Round Robin при различной полосе системы (5 и 10 МГц)
На рис. 4 представлены графики зависимости пропускной способности системы от интенсивности входной нагрузки для алгоритмов планирования Round Robin и Best CQI.
Рис. 4. Графики зависимости пропускной способности системы от интенсивности входной нагрузки для алгоритма планирования Round Robin и Best CQI при различной полосе системы (5 и 10 МГц)
4. Обсуждение результатов
Из графика на рис. 4 можно сделать вывод, что используя различные алгоритмы планирования можно увеличить пропускную способность системы при прочих равных условиях. При одной и той же полосе системы пропускная способность в 2 раза выше при использовании алгоритма Best CQI по сравнению с алгоритмом Round Robin.
Реальная пропускная способность системы при алгоритме планирования Round Robin может достигать 18 Мбит/с при полосе 10 МГц и 8 Мбит/с при полосе 5 МГц.
120