

Ceramic Technology and Processing, King
.pdfSlip Preparation Procedures 73
Viscosity
Viscosity is a measure of the resistance of a slip to flow, or a liquid to shear. When pouring a slip out of a beaker, if the viscosity is high, it will pour slowly like molasses. When the viscosity is low, it will pour out like water. In both these cases, the flow rate is low and shear-like. When one increases the shear rate, by squirting the slip out of a hypodermic needle, slips will act differently when compared to being poured out of a beaker. This introduces a complication that has to be understood and coped with since it can make a large difference in subsequent processes. If the slip or paste is difficult to squirt with increasing velocity, it would also be more difficult to pump or extrude. Alternatively, if a slip or paste becomes easier to force out with increasing velocity, the material would be easy to pump or extrude. A third case is where the slip looks like a paste but becomes fluid when stirred. This is akin to latex paint. We will now discuss these three most common types of rheology.
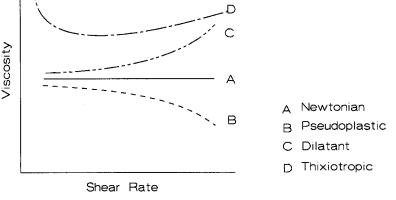
Plotting shear rate against viscosity determines the rheology of the slip. The principal choices are pseudoplastic, dilatant, and thixotropic, as alluded to above. Just to be a little more thorough, there are also Newtonian and Bingham rheologies. Newtonian behavior is more typical of nonpolar liquids such as hydrocarbons or water where viscosity stays the same as the shear rate changes. Slips are not Newtonian. Aqueous ceramic slips may show Bingham behavior where there is a yield point that has to be exceeded before the slip flows; this may probably not be evident except at low shear rates using a very sensitive rheometer. However, this is important with low shear rate phenomena when there are problems with sag or leveling. It usually takes some time for thixotropic thickening to build up in slips. Sometimes, this period is measured in hours and could be a problem for a thick cast. Clay slips are usually thixotropic.
Figure 4.10 schematically demonstrates these flow curves. Newtonian is shear independent. Pseudoplastic is shear thinning. Dilatant is shear thickening. Thixotropic thickens with time.
74 Ceramic Technology and Processing
Figure 4.10: Slip Rheology Curves
Most slips are pseudoplastic in that viscosity decreases as the shear rate increases; this can be called shear thinning. The more one stirs these slips the thinner they become. Coarse grained slips are dilatant when the volume percent solid is high. A dilatant slip feels solid when poked. Tip the container and the slip will readily flow. One can observe this quality with corn starch in water as it forms a dilatant slip. Just where dilatancy occurs depends on the particle packing, which in turn depends on the size distribution and shape. Slips around 65-70 volume % solids or higher usually are dilatant.
Viscous behavior is important in ceramic processing. With fine grained slips, the following factors control viscosity: volume % solids, deflocculant concentration, dissolved polymers, pH, particle size distribution, and ionic strength. Ionic strength is generally expressed as the concentration of an electrolyte in the slip. These are the variables one can work with; a combination of them determines the slip's processing properties. Dissolved polymers are often binders that will increase green strength and aid in pressing a part. Temperature is also a factor as slips become thinner with an increase in temperature. Milling often significantly
Slip Preparation Procedures 75
increases the temperature of the slip; hence, before measuring viscosity, the slip should first cool to room temperature.
Viscometers
Viscometers measure the viscosity of a fluid or slip as is illustrated in Chapter XI that deals with property measurements. The two principal viscometers are of the rotor cup geometry and the plate and cone geometry. Both these viscometers are suitable for fine-grained slips. When the particle size is coarse, one can only use the rotor type. Rotor size is chosen to put the measurements on scale with the instrument and with the slip. Higher viscosities are on scale with smaller rotors. Viscosity measurements are taken incrementally at increasing rotor speeds, first up and then down. A viscometer measures viscosity with rotor rpm. A rheometer measures shear stress with shear rate. From this data, one can determine the viscosity. Standards are available for viscosity and used to calibrate the instrument.
There are two types of rheometers: a shear-rate-controlled rheometer and a stress-controlled rheometer. Most rheometers are shear rate controlled, which means that the rotor speed is adjusted and the shear stress is measured. The stress-controlled rheometers do just the opposite, setting the stress and then measuring the shear rate necessary to produce that stress level. If the slip's rheology is sensitive at low strain rates, a stress-controlled rheometer is preferred. Problems with inks, silk screening, leveling, or sagging are typical applications where low strain rates are important. For most ceramic slips, a strain-rate-controlled viscometer is suitable.
The Zahn cup is a cylindrical stainless steel cup with a rounded bottom and a hole through which the slip can drain. One measures the time it takes to drain the cup. It is inexpensive and is better than nothing as a QC tool. However, it does not give information on the slip's sensitivity to the shear rate, which is an important factor.
76 Ceramic Technology and Processing
Viscosity-Milling Time
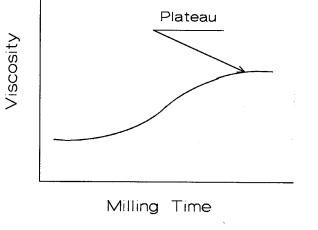
Ordinarily, when starting with a fine powder, the powder is agglomerated and has to be milled to obtain a dispersed slip. Viscosity increases with milling due to the generation of additional active surfaces. Material within an agglomerate is not available to interact with the slip rheology. After it is released by milling, it becomes an active participant, causing the viscosity to increase. A typical viscosity curve is shown in Figure 4.11.
Figure 4.11: Viscosity vs Milling Time. Viscosity increases with milling time as agglomerates provide additional active surface.
The curve appears to level out with longer milling times as it becomes much more difficult to fracture smaller fragments in the mill. One questions when it is appropriate to stop milling. The answer is linked to sintering behavior, which in turn is governed by the particle size distribution (PSD), green density, sintering temperature, and soak time. This is a very good scenario for a statistically designed experiment. The independent variables are known. One can determine the dependant variables from the following properties: density, strength, toughness, or perhaps thermal shock resistance.
Slip Preparation Procedures 77
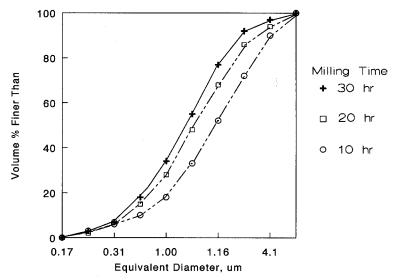
The particle size distribution becomes finer as the slip is milled for longer times, as shown in Figure 4.12.
Figure 4.12: Particle Size Distribution vs Milling time. Milling decreases the particle size but more gradually as the size becomes finer.
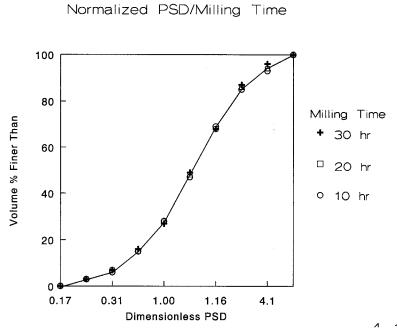
As suggested in the Figure 4.12, it becomes more difficult to move the distribution to the left as the particles become finer. The curves tend to cluster up. When the distribution is normalized by dividing each value by the d50 value, all of the curves fall on top of each other showing that while the particle size is reduced the relative particle size distribution is fixed, as seen in Figure 4.13.
78 Ceramic Technology and Processing
Figure 4.13: Normalized Particle Size Distribution. When each data point is divided by the mean, all of the distribution curves fall on top of each other.
The above relationship suggests that the particles in the slip are being fragmented similarly for their size as the milling progresses. There are limitations to controlling the particle size distribution. The ceramic powder can be milled finer, but the character of the distribution is fixed, at least for ball milling.
Too high a viscosity slows the milling rate. Usually, 500-1000 cps is about right. Mills are run at 60-70% of the critical speed. Critical speed is when the centrifugal force just equals the force by gravity. At that speed,

Slip Preparation Procedures 79
the media will just ride around the inner surface of the mill and not grind anything. Ideally, the media should cascade in the mill where impacts between the media grind the particles in the batch. It is questionable when one should stop the milling process. The answer is linked to the sintering behavior, which in turn is governed by the particle size distribution, green density, sintering temperature, and soak time. These are the usual independent variables for this type of example. This is a very good scenario for a statistically designed experiment. The independent variables are as shown above. The dependant variables are determined by the following properties: density, strength, toughness, or perhaps thermal shock resistance.
Percent-Solids Viscosity
Fine-grained slips show a sharp increase in viscosity above 50 volume % solids. This is shown in Figure 4.14.
Figure 4.14: Viscosity vs. Volume % Solids. Viscosity increases sharply as more solids are added due to solid-solid contacts.
80 Ceramic Technology and Processing
Perhaps not invariably but frequently, the volume % solids are chosen to be as high as possible consistent with viscosity restrictions. For a fine slip, 55% is high. If the slip is going to be spray dried, it is a good idea to back off a little to avoid clogging problems on the nozzle and to obtain better shaped spheres. High % solids are otherwise preferred for the following reasons: to retard segregation, to increase the casting rate, to produce a more uniform cast, and to possibly obtain a higher green density.
High solid slips need to be handled appropriately as an irreversible process called gelation could result. If the mill overheats, the organic additives will get overheated and cause the slip to gel. Addition of concentrated chemicals to the slip can also cause gelation at the location of contact where the concentration is very high. Chemicals like acids, bases, or even surfactants can cause the slip to gel at that location. It may not then re-disperse. A preferred practice is to place the additives into the water and to stir the contents before adding in the ceramic powder.
Surfactant Concentration
For slip casting, a little flocculation is often desirable to keep the cast permeable and to provide a little drying shrinkage so that the piece releases from the mold. Therefore, it is desirable to move off of the minimum of the curve but just a little to one side. The mark on the figure suggests a location. This slip will be just a little bit flocculated and will retain permeability throughout the casting. The cast will have a little drying shrinkage so it will release from the mold.
Figure 4.15 shows the viscosity vs. surfactant concentration. Viscosity drops rapidly as the surfactant is added going through a minimum and then increases again. The best concentration is often just off from the minimum where the slip is slightly flocculated as suggested by the mark.
Besides viscosity, the saturation amount of surfactant can be determined by the residual surfactant concentration in the liquid. A plot of the amount of surfactant added vs. the amount retained in the liquid shows a plateau as indicated in Figure 4.16.

Slip Preparation Procedures 81
Figure 4.15: Viscosity vs. Surfactant Concentration
Figure 4.16: Surfactant Saturation. The amount of surfactant left in the solution plateaus as the surface becomes saturated. Plateau compositions are preferred.
82 Ceramic Technology and Processing
When the surfaces of the particles get saturated, the residual surfactant levels out in the liquid. This is called a titration technique. One can measure the concentration using a differential refractometer or by applying other analytical techniques. Of course, standards can be made up of solutions of known properties for calibration purposes.
There are large number of surfactants that are available. Traditionally, such materials as sodium silicate, lignosulfonates, and tetra sodium pyrophosphates are available. Currently, a variety of acrylate compounds are widely used.
There is another technique to evaluate surfactant sedimentation. The method is simple but time consuming. A dilute slurry of the ceramic powder is suspended in a liquid containing a surfactant. The slurry is poured into a test tube capped to avoid evaporation, and not agitated. A well-deflocculated slip settles slowly, taking a few weeks. But when it settles it forms a hard pack. Slips that are partially flocculated soon develop a clear liquid above the slurry, but do not completely settle out in the same period. The height of the clear liquid layer and time will indicate the way the surfactant behaves.
Figure 4.17 shows the data on a sub micrometer diameter SiC powder with a variety of surfactants. Three surfactants showed diffraction banding since the particle segregation, based on particle diameter, was astonishingly perfect. Turn back the pages and take another look at the frontispiece. The best place to choose a surfactant is toward the left of the diagram, but not all the way over.
A similar experiment was repeated using isopropyl alcohol as the medium. This is shown in Figure 4.18. Surfactants are not as active in alcohol as in water. None of the surfactants showed diffraction bands. Since isopropyl alcohol is not as polar as water, the results are not as dramatic, and none of the samples showed diffraction. Since there are so many surfactants, there may be a problem in selecting a suitable one for your material. It is time consuming to perform many experiments for this selection. Personal contacts and the literature help to narrow the selection to a reasonable number.