- •Investment Case 11
- •Valuation summary 37
- •Investment case 53
- •Investment Case
- •Companies Compared Stock data
- •Key metrics
- •Per ha comparison
- •Management credibility
- •Market Overview Summary
- •Ukraine in global context Ukraine produces 2-3% of world soft commodities
- •Sunflower oil, corn, wheat, barley and rapeseed are Ukraine’s key soft commodities to export
- •Ukraine is 8th in arable land globally
- •Key inputs used in crop farming Ukraine`s climate favorable for low-cost agriculture
- •Soil fertility map
- •Machinery use far below developed countries
- •Land trade moratorium makes more benefits
- •Fertilizer use
- •Inputs prices: lease cost is Ukraine’s key cost advantage
- •Case study: Production costs in Ukraine vs. Brazil for corn and soybean
- •Farming Efficiency Ukrainian crop yields lag the eu and us, on par with Argentina and Brazil, above Russia’s
- •5Y average yields, t/ha and their respective 10y cagRs
- •Yields at a premium in Ukraine on the company level
- •Growth Growth should come from yield improvement, crop structure reshuffle and acreage increase
- •Crop structure is gradually shifting to more profitable cultures
- •Combined crop structure of listed companies
- •Ukraine`s 2012 harvest outlook
- •Valuation
- •Valuation summary
- •Asset-based approach
- •Asset-based valuation
- •Valuation premium/discount summary
- •Location matters: Value of land by region
- •Yields efficiency comparing to benchmark region
- •Cost efficiency
- •Adding supplementary businesses
- •Valuation summary for other assets
- •Cost of equity assumptions
- •Model assumptions
- •Landbank growth capped at 30%
- •Crop structure
- •Biological revaluation (ias 41) excluded
- •Land ownership
- •Company Profiles Agroton a high cost producer
- •Investment case
- •Valuation
- •Operating assumptions
- •Financials
- •Income statement*, usd mln
- •Agroton in six charts
- •Operati
- •Industrial Milk Company Corn story
- •Investment case
- •A focus on the corn explains high margins
- •Location favourable for corn
- •Well on track with ipo proceeds
- •Weak ebitda margin in 2012 explained by non-cash items
- •Valuation
- •Valuation
- •Operating assumptions
- •Financials
- •Income statement*, usd mln
- •Ksg Agro On the road to space/Not ready to be public
- •Investment Case
- •A 5x yoy boost in total assets looks strange to us
- •Valuation
- •Operating assumptions
- •Financials
- •Income statement*, usd mln
- •Ksg Agro in six charts
- •Mcb Agricole Acquisition target with lack of positives for minorities
- •Investment Case
- •Inventories balance, usd mln
- •Overview of acquisitions of public farming companies in Ukraine
- •Valuation
- •Operating assumptions
- •Financials
- •Income statement, usd mln
- •Mcb Agricole in six charts
- •Mriya Too sweet to be true
- •Investment Case
- •Valuation
- •Operating assumptions
- •Financials
- •Income statement*, usd mln
- •Mriya in six charts
- •Sintal Agriculture
- •Investment Case
- •25% Yoy cost reduction in 2011 should improve margins
- •Irrigation is a growth option
- •Inventory balance, usd mln
- •Valuation
- •Valuation
- •Operating assumptions
- •Financials
- •Income statement*, usd mln
- •Sintal Agriculture in six charts
- •Astarta Sugar maker
- •Kernel Grain trader actively integrating upstream
- •Poultry producer
- •Appendices Land value
- •Current landowner income capitalization model
- •Farmer income capitalization model
- •Normative value
- •Biological asset revaluation
- •How do we adjust the income statement to be on a cost basis?
- •Ias 41 application summary
- •Appendix: Crop production schedule Crop schedule, based on 2012 harvesting year
- •Investment ratings
- •Contacts
Key inputs used in crop farming Ukraine`s climate favorable for low-cost agriculture
Ukraine has a temperate continental climate with annual precipitation of 500 mm, 300 mm of which falls during the growing season (April to October). 62% of Ukraine’s agricultural land is covered by superior quality black soil which contains an enriched humus layer (40-60 cm vs. 10-30 cm in neighboring EU countries).
Soil fertility map
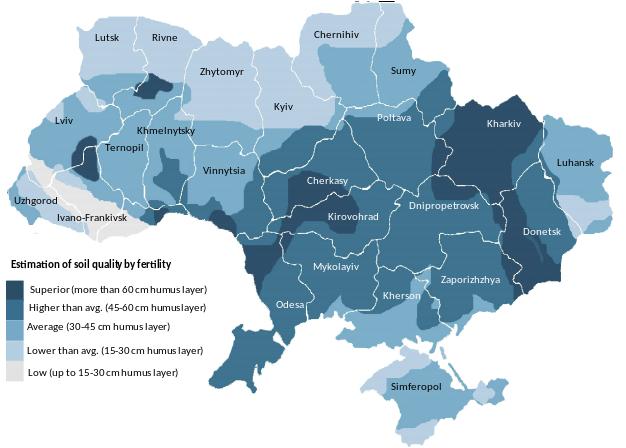
Source: Ministry of Agrarian Policy of Ukraine
As in Russia, crops in Ukraine are harvested once per year with a normal growing season from April to October. This is different from Argentina and Brazil, which are located in the Southern hemisphere.
Another difference with Brazil and Argentina is that up to 15% of fields there can deliver crops twice per year (soybean first, corn second), though with a lower yield during the second harvest. Ukraine historically produces one crop per year, though some agronomists argue that southern regions could deliver two crops.
Machinery use far below developed countries
Tractor use in Ukraine is generally on par with Brazil and Argentina, but more prevalent than in Russia. Comparison to the EU and US averages shows significant underutilization of equipment by all four UBRA countries (some part of the gap to the EU figure can be explained by its historical focus on low-scale business models and usage of smaller tractors).
Tractors per 100 sq km of arable land |
|
Source: FAO Statistical Yearbook 2012 |
Land trade moratorium makes more benefits
Agricultural land is not tradable in Ukraine, unlike in Russia, Brazil and Argentina. The moratorium on the sale of agricultural land was set by parliament more than a decade ago when ownership rights for agricultural land were introduced and has been prolonged on an annual basis, even though the market has been flooded with rumors the moratorium would be abolished for at least the last five years.
Farming companies lease land, primarily from individuals, in small plot sizes (1.5 ha on average) at a cost of USD 35-90/ha, with lease tenors of three to ten years common. Should land become tradable, current leaseholders have a preemptive right to purchase the plot.
Without exception, all public companies we have talked to have said they prefer the current framework where all companies are leasing land. There are several reasons why we agree with the companies and prefer the lease business model:
Lower capital intensity, with only USD 500-1,500/ha needed for operations on leased land, while its buyout could require additional USD 2,000-10,000/ha
Farmers focus on operating efficiencies rather than landbank appreciation (all listed Brazil and Argentinean farming companies are more developers than farmers: they plant only 40%-75% of their landbank and derive around 3/4 of their ROE from landbank appreciation)
Higher growth opportunities, as lease rights acquisition varies in the range of USD 250-1,000/ha vs. the minimum estimate for land prices of USD 2,000/ha