

печень
.pdfCH A P TER |
Liver |
|
|
|
|
|
|
|
|
|
|
|
|
|
|
Anatomy
Technique
Cysts
Benign Tumors
Hemangiomas
Focal Nodular Hyperplasia
Hepatic Adenoma
Malignant Tumors
Metastases
Hepatocellular Carcinoma
Lymphoma
Infections
Pyogenic Abscess
Fungal Abscess
Granulomatous Disease
Parasitic Infection
Trauma
Diffuse Parenchymal Disease
Hepatitis
Fatty Infiltration
Cirrhosis
Vascular Disease
Normal Hemodynamics
Portal Hypertension
Passive Hepatic Congestion
Hepatic Transplant Complications
Portosystemic Shunts
For Key Features summary see p. 83
ANATOMY
The liver is the largest solid organ in the normal abdomen, occupying most of the right upper quadrant. The right lobe contains an anterior and posterior segment, and the left lobe contains a medial and lateral segment. The right hepatic vein runs between the right
anterior and posterior segments, the left hepatic vein runs between the left medial and lateral segments, and the middle hepatic vein runs between the left medial and the right anterior segment (Fig. 3-1A). The middle and left hepatic veins usually join together just before entering the inferior vena cava (IVC). Smaller, dorsal hepatic veins from the posterior right lobe and the caudate lobe often drain into the vena cava below the level of the three main veins (Fig. 3-2). Whereas the hepatic veins separate the hepatic segments, the portal veins run through the middle of the segments, and each branch is named according to the segment it supplies. The exception is the umbilical segment of the left portal vein, which runs between the left medial and lateral segments (see Fig. 3-1B). The portal veins can be distinguished from the hepatic veins by the periportal fibrofatty tissue, which produces brighter echoes around the portal veins as well as the adjacent hepatic arteries and bile ducts (see Fig. 3-1A).
The ligamentum teres is a useful landmark that travels between the medial and lateral segments of the left lobe (see Fig. 3-1C to F). It contains the fibrous remnant of the umbilical vein and travels from the umbilicus to the anterior aspect of the umbilical segment of the left portal vein. The interlobar fissure is a shallow indentation on the posterior aspect of the liver that separates the right and left lobes (see Fig. 3-1C) and identifies the location of the gallbladder fossa (see Fig 3-1D). The caudate lobe is a small segment of the liver located immediately anterior to the IVC. It is contiguous with the right lobe and separated from the lateral segment of the left lobe by the fissure for the ligamentum venosum (see Fig. 3-1B and E). The fissure for the ligamentum venosum extends to the posterior aspect of the umbilical segment of the left portal vein
(see Fig. 3-1B). Table 3-1 reviews these important hepatic landmarks and the segmental anatomy of the liver.
Because surgeons can now resect subsegments of the liver, it is important to expand the classic segmental
49
50 ULTRASOUND: THE REQUISITES
A B C
D E F
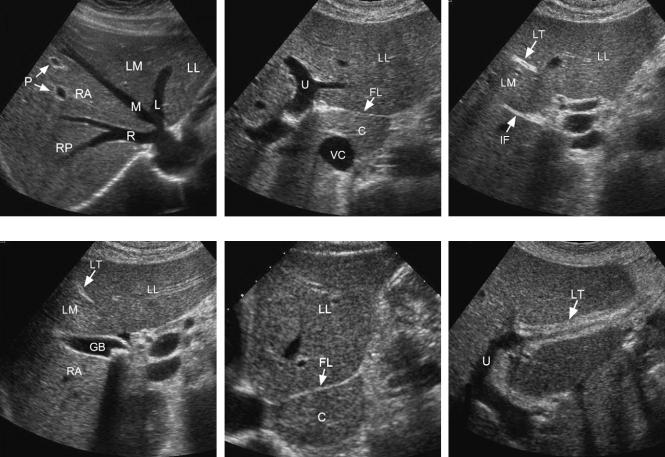
Figure 3-1 Normal liver anatomy. A, Transverse view of the hepatic vein confluence shows the right (R), middle (M), and left (L) hepatic veins. The segments of the liver are also shown: left lateral segment (LL), left medial segment (LM), right anterior segment (RA), and right posterior segment (RP). Two portal vein branches (P) in the right anterior segment differ from the hepatic veins by the echogenic fibrofatty tissue surrounding the vessel. B, Transverse view at the level of the left portal vein shows the fissure for the ligamentum venosum (FL) separating the caudate lobe (C) and the left lateral segment (LL). The fissure for the ligamentum venosum connects to the umbilical segment of the left portal vein (U). Also seen is the inferior vena cava (VC). C, Transverse view just inferior to B shows the ligamentum teres (LT) immediately below the anterior aspect of the umbilical segment of the left portal vein. The interlobar fissure (IF) is seen posteriorly. The left lateral segment (LL) and the left medial segment (LM) are separated by the ligamentum teres. D, Transverse view just inferior to previous image shows the gallbladder (GB) immediately below the interlobar fissure. The interlobar fissure and the gallbladder fossa separate the left medial segment (LM) from the right anterior segment (RA). The ligamentum teres (LT) and the left lateral segment (LL) are also seen. A gallstone is present in the gallbladder. E, Longitudinal view from the midline of the abdomen shows the caudate lobe (C) and the left lateral segment (LL) separated by the fissure for the ligamentum venosum (FL). F, Longitudinal view through the left lobe shows the umbilical segment of the left portal vein (U) and the ligamentum teres (LT). Note that the ligamentum teres connects to the anterior most aspect of the umbilical segment of the left portal vein.
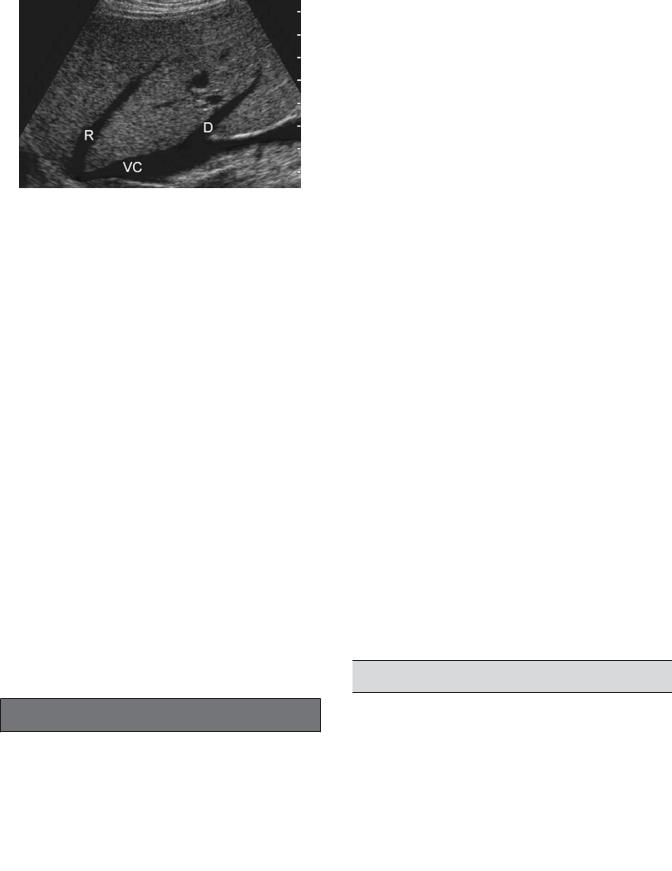
Figure 3-2 Dorsal right hepatic vein. Longitudinal view of the right lobe of the liver shows the right hepatic vein (R) draining into the vena cava (VC) superiorly. A dorsal right hepatic vein (D) is also seen draining into the vena cava inferiorly.
nomenclature. The Couinaud system divides the left lateral, right anterior, and right posterior segments into superior and inferior subsegments and maintains the caudate lobe and the medial left segment as single segments. This results in eight anatomic subsegments numbered as follows: I—caudate, II—left lateral superior, III—left lateral inferior, IV—left medial, V—right anterior inferior, VI—right posterior inferior, VII—right posterior superior, and VIII—right anterior superior. A separate portal venous branch supplies each of these subsegments.
The common hepatic artery normally arises from the celiac axis and passes anterior to the portal vein (Fig. 3-3A and B). The gastroduodenal artery arises from the common hepatic and descends along the anterior aspect of the pancreatic head. Beyond the gastroduodenal artery, the hepatic artery is called the proper hepatic artery. The proper hepatic artery ascends in the gastroduodenal ligament to the porta hepatis. It then divides into the right and left hepatic artery. The right hepatic artery passes posterior to the common bile duct and anterior to the portal vein (see Chapter 4).
Variations in the hepatic arteries are very common. A replaced (i.e., the only existing vessel arises from an
Table 3-1 Hepatic Segmental Landmarks
Segments |
Separating Landmarks |
|
|
Left lateral/left medial |
Ligamentum teres, umbilical |
|
segment of left portal vein, left |
|
hepatic vein |
Left medial/right anterior |
Interlobar fissure, gallbladder, |
|
middle hepatic vein |
Right anterior/right posterior |
Right hepatic vein |
Caudate lobe/left lobe |
Fissure for ligamentum venosum |
|
|
Liver 51
anomalous origin) or an accessory (i.e., an additional vessel arises from an anomalous origin) right hepatic artery arising from the superior mesenteric artery is present in approximately 20% of individuals. Replaced or accessory left hepatic arteries arising from the left gastric artery are just as common. They pass into the left lobe of the liver through the fissure for the ligamentum venosum rather than the porta hepatis (see Fig. 3-3C and D). Replaced/accessory right hepatic arteries pass posterior to the portal vein and anterior to the vena cava (see Fig. 3-3E and F).
A common variation that is seen in the periphery of the liver is deep fissures caused by hypertrophied diaphragmatic muscle bundles (Fig. 3-4). In certain imaging planes, these may appear as echogenic lesions on the surface of the liver. However, because they are long bands of muscle, it is possible to rotate the transducer parallel to the long axis of the band and show that the “lesion” is linear and not spherical. True accessory fissures also occur but are not commonly visualized on sonography.
The size of the liver can be difficult to gauge on sonography because its shape and volume distribution between right and left lobe is so variable. Normal upper limits of liver length measured in the midclavicular line range from 13 to 17 cm (15 cm is used most frequently). Indirect signs of hepatomegaly include extension of the right lobe below the lower pole of the kidney (in the absence of a Riedel lobe), rounding of the inferior tip of the liver, and extension of the left lobe into the left upper quadrant above the spleen.
The liver parenchyma is normally homogeneous and is only interrupted by the portal triads and the hepatic veins. Echogenicity of the liver should be slightly greater than or equal to that of the right kidney but less than that of the spleen (Table 3-2). The liver is less echogenic than the spleen and is usually less echogenic than the pancreas, although the liver and pancreas may be isoechoic in younger individuals.
TECHNIQUE
The liver is usually best scanned with a sector or a curved-array transducer, with center frequency ranging from 2 to 5 MHz. Linear-array transducers of even higher frequency are useful for imaging superficial abnormalities, diffuse parenchymal abnormalities (e.g., cirrhosis), and the surface of the liver. The left lobe can be imaged effectively in most patients from an anterior subxiphoid approach. The right lobe should be scanned from both a subcostal and intercostal approach to optimize detection and characterization of focal lesions. Intercostal scans are usually most effective with the patient supine and
52 ULTRASOUND: THE REQUISITES
A B
C D
E F
Figure 3-3 Normal and variant hepatic artery anatomy. Transverse (A) and longitudinal (B) views of the normal celiac axis show the celiac (C) arising from the aorta (A). On the transverse view, the common hepatic artery (H) is seen traveling anterior to the portal vein (P). The splenic artery (SP) is also seen. On the longitudinal view, the superior mesenteric artery (S) is seen inferior to the celiac axis. Transverse (C) and longitudinal (D) views of a replaced left hepatic artery (arrows). On the longitudinal view, the artery appears as a small round dot within the echogenic linear fissure for the ligamentum venosum. Transverse (E) and longitudinal (F) views of a replaced right hepatic artery. On the transverse view, the replaced right hepatic artery (RH) is seen arising from the superior mesenteric artery (S). Also seen is the aorta (A), vena cava (C), left renal vein (V), and portal vein (P). The longitudinal view shows the replaced right hepatic artery posterior to the portal vein and the proper hepatic artery (PH) anterior to the portal vein.
are best done during normal respiration so that the right lung base and its associated shadowing are not obscuring the superior aspects of the liver. Rib shadowing can be minimized by imaging in an oblique plane that is parallel to the long axis of the intercostal spaces. Subcostal scanning should be performed with the patient in a left lateral decubitus or left posterior oblique position so
that the liver shifts slightly medial and inferior. More inferior displacement of the liver and further enhancement of subcostal and subxiphoid scanning can be achieved by imaging during deep patient inspiration. It is important to angle the transducer superiorly while scanning from a subcostal approach so that the dome of the liver can be visualized.

Liver 53
A B
Figure 3-4 Diaphragmatic fissures. A, Two adjacent echogenic triangular defects are identified on the surface of the liver. These represent two external fissures caused by the diaphragm (D). B, View 90 degrees from that in A shows the larger of these two defects as an elongated band of diaphragmatic muscle external to the liver.
CYSTS
Simple hepatic cysts are the most common focal liver lesions. Because the liver is such a homogeneous organ, cysts are usually easy to detect and generally display the three classic sonographic criteria of an anechoic lumen, increased through transmission, and a well-defined back wall (Fig. 3-5A and B). Many hepatic cysts have at least a partial septation or puckering of the wall that disturbs the normally smooth contour of uncomplicated cysts (see Fig. 3-5C). Cysts are referred to as complex if they have internal echoes, a thick wall, septations that are numerous or thick, solid elements, or calcification. Complex cystic lesions include hematomas, abscesses, bilomas, echinococcus, cystic metastases, and hemorrhagic or necrotic tumors. Biliary cystadenomas and cystadenocarcinomas are rare neoplasms that appear as multiseptated cystic masses (Box 3-1). Vascular lesions such as aneurysms, arterioportal fistulas, and portal hepatic vein fistulas can simulate cysts on gray-scale sonography but are easily distinguished with Doppler
Table 3-2 Characteristics of Normal Liver
Characteristic |
Appearance |
|
|
Size |
<15 cm |
Echogenicity |
≥Right kidney, <pancreas, <spleen |
Parenchyma |
Homogeneous |
Surface |
Smooth |
|
|
analysis (Fig. 3-6). Lymphoma is a solid tumor that can rarely simulate a cyst.
The liver is involved in 40% to 50% of cases of autosomal dominant polycystic disease. Despite extensive replacement by cysts, liver function remains normal in the majority of patients unless there is associated hepatic fibrosis. Symptoms may arise from the mass effect of the numerous cysts or result from cyst hemorrhage (Fig. 3-7).
BENIGN TUMORS
Hemangiomas
Hemangiomas are the most common benign liver neoplasm, occurring in approximately 7% of adults. They are found more often in women than men. With the exception of cysts, hemangiomas are the most common incidental lesions detected on hepatic sonography. Structurally, they are much like a sponge filled with blood. Multiple, small, blood-filled spaces are separated by fibrous septations and lined by endothelial cells. Approximately 10% are multiple. It is unusual for hemangiomas to bleed or to cause symptoms, although giant hemangiomas may have enough mass effect to be symptomatic. Platelet sequestration and destruction by hemangiomas has been reported as a rare cause of thrombocytopenia (Kasabach-Merritt syndrome).
The typical appearance is a homogeneous, hyperechoic mass that is usually less than 3 cm in size. Sixty to 70 percent of hemangiomas are typical (Fig. 3-8). The margins are usually sharp and smooth, and they may be round or slightly lobulated. Larger lesions are more likely to appear atypical as a result of fibrosis, thrombosis, and necrosis. Calcifications can occur but are rare.
54 ULTRASOUND: THE REQUISITES
A B C
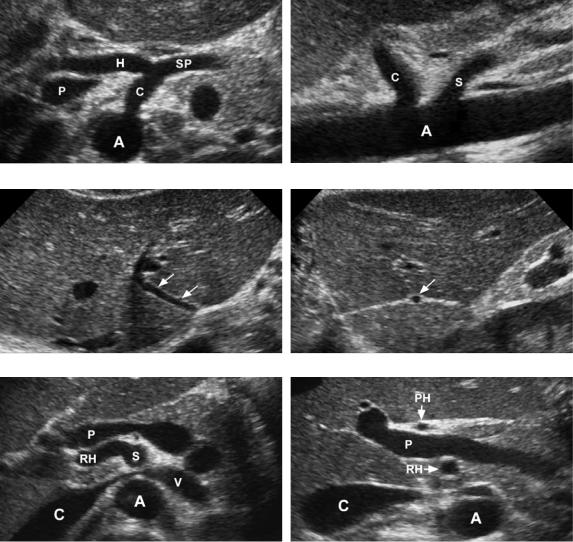
Figure 3-5 Hepatic cysts in different patients. A, Small hepatic cyst (<1 cm). Despite the small size, the cyst is anechoic with a well-defined back wall and minimal but detectable increased through transmission. B, Larger hepatic cyst shows classic findings and obvious increased through transmission. C, Hepatic cyst shows peripheral puckering, which is frequently seen in otherwise simple hepatic cysts.
Box 3-1 Causes of Cystic Lesions in
the Liver
COMMON |
UNCOMMON |
RARE |
Cysts |
Abscess |
Aneurysm |
|
Hematoma |
Arterioportal fistula |
|
Cystic metastases |
Portal-hepatic vein fistula |
|
Biloma |
Hemorrhagic adenoma |
|
Echinococcus |
Biliary cystadenoma |
|
|
(carcinoma) |
Figure 3-7 Polycystic disease. Transverse view of the liver demonstrates multiple simple hepatic cysts. The largest cyst shows a fluid cellular layer secondary to hemorrhage.
A B
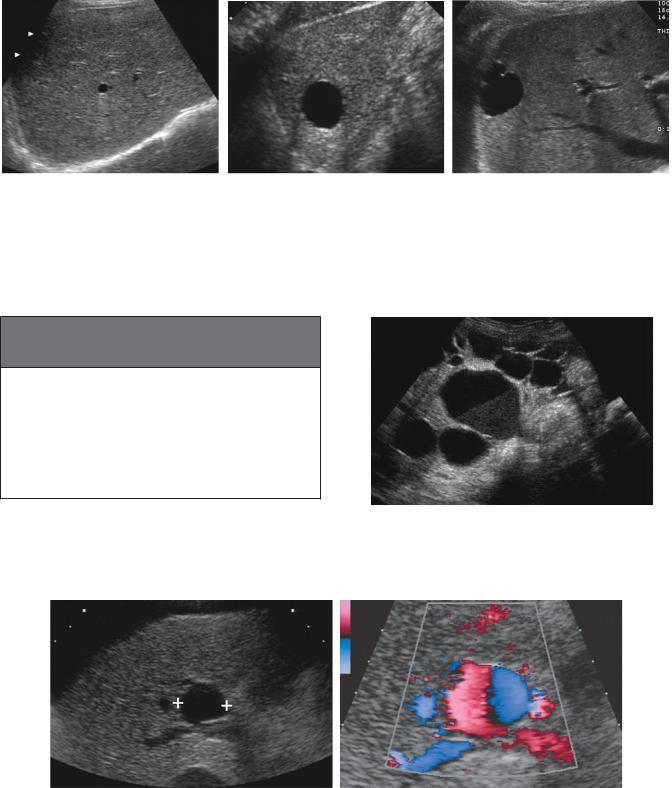
Figure 3-6 Portal vein aneurysm simulating a hepatic cyst. A, Gray-scale view of the liver demonstrates an anechoic structure (cursors) with a well-defined back wall and increased through transmission. This has a typical appearance of a hepatic cyst. B, Doppler analysis demonstrates flow throughout the lesion. Pulsed Doppler analysis showed a venous waveform consistent with a portal vein aneurysm.
Liver 55
A B C
D E F
G H I
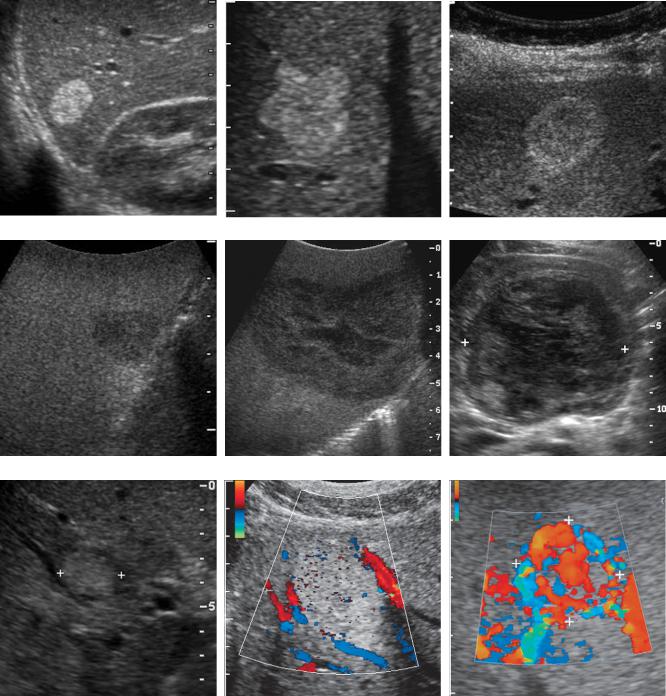
Figure 3-8 Hemangiomas in different patients. A, Typical homogeneous hyperechoic well-defined mass. B, Homogeneous hyperechoic mass with scalloping of the margin. C, Lesion with isoechoic center and a thick peripheral hyperechoic halo. This appearance is sometimes referred to as a reverse target appearance. D, Atypical hemangioma appearing as a hypoechoic lesion with slight through transmission. This occurred in the setting of an otherwise fatty infiltrated liver. E, Large atypical hemangioma that is predominantly hypoechoic and heterogeneous with a large central region of decreased echogenicity likely caused by fibrosis or thrombosis. F, Large atypical hemangioma (cursors) that is diffusely heterogeneous. G, Small hemangioma (cursors) that has a targetoid appearance. This appearance, which closely simulates a malignant lesion, is only rarely seen with hemangiomas. H, Color Doppler view of a typical hemangioma showing flow in vessels adjacent to the lesion but no flow within the lesion. I, Color Doppler view of an atypical hemangioma with abundant detectable internal flow (cursors).
56 ULTRASOUND: THE REQUISITES
A B
Figure 3-9 Contrast enhancement of hemangioma. A, View of a large atypical hemangioma (cursors) shows heterogeneous echotexture that is predominantly hypoechoic. B, After administration of intravenous contrast material, peripheral contrast enhancement is seen with a typical puddling pattern similar to what is well described on CT.
A significant percentage of atypical hemangiomas have a hyperechoic periphery and a hypoechoic center. This “reverse target” appearance is fairly characteristic of hemangiomas and is only rarely seen in malignant disease. Posterior enhancement is often included in the description of hemangiomas, but it is not a common finding; and because other solid liver tumors can have posterior enhancement, it is not a useful finding. Despite the vascular nature of hemangiomas, blood flow is generally too slow to be detected with Doppler techniques. Therefore, detection of flow within a hepatic mass that otherwise appears like a hemangioma on gray-scale imaging should raise suspicion for metastatic disease or hepatocellular carcinoma. With intravenous ultrasound contrast agents, hemangiomas demonstrate peripheral puddling similar to what is seen on contrast medium–enhanced CT (Fig. 3-9).
As one would expect for a benign lesion, hemangiomas are usually stable over time. However, approximately 10% will undergo a decrease in echogenicity, and
5% will regress partially or completely. Only 2% of hemangiomas enlarge on follow-up scans. Rarely a hemangioma will change its sonographic appearance during the course of a single examination (Fig. 3-10); no other hepatic lesion is known to do this.
The differential diagnosis for hyperechoic masses in the liver primarily includes other neoplasms, especially liver metastases and hepatocellular cancer. Focal fatty infiltration can also produce nodular regions of increased echogenicity. Minimal shadowing is occasionally seen with focal nodular fat but is not a feature of hemangiomas.
The work-up of a homogeneous hyperechoic hepatic mass depends on the patient’s risk of malignancy. If the patient has a prior history or current evidence of an extrahepatic malignancy capable of metastasizing to the
liver, or a history of chronic liver disease, the suspected diagnosis of hemangioma should be confirmed with another imaging modality. MRI is probably most useful, although CT can also be used for larger lesions. If the lesion is larger than 2 cm and not adjacent to the heart or major hepatic vascular structures, technetium 99m– tagged red blood cell (RBC) scintigraphy can be used. If the patient does not have these risk factors, a homogeneous hyperechoic liver lesion requires no further evaluation.
A B
Figure 3-10 A rapid change of hemangioma. A, Initial view of hemangioma (cursors) shows a typical homogeneous hyperechoic pattern. B, Similar view obtained 33 seconds later demonstrates change in the appearance of this lesion to a predominantly hypoechoic pattern. (Case courtesy of Dr. Andy Fisher, Denver, CO.)

Occasionally, noninvasive tests will not establish the diagnosis of hemangioma in a patient at risk for malignancy, and the patient will require a biopsy. Despite the vascular nature of hemangiomas, biopsies can be performed safely. However, the needle should pass through normal parenchyma before entering the hemangioma to achieve some tamponade effect. Core needle biopsies using a 20-gauge or larger needle can obtain sufficient tissue for diagnosis in the majority of cases. Fine-needle aspirations generally obtain only blood and are not sufficient to make the diagnosis.
Focal Nodular Hyperplasia
Focal nodular hyperplasia (FNH) is a benign tumor of the liver that is composed of Kupffer cells, hepatocytes, and biliary structures but lacks the typical normal lobular hepatic features of portal triads and central veins. Although uncommon, it is the second most frequently encountered benign liver tumor after hemangiomas. Interestingly, the two lesions occur together at an increased rate, especially in patients with multifocal FNH. It is hypothesized that FNH develops from a congenital vascular malformation that promotes focal hyperemia and hepatocellular hyperplasia. It is typically unencapsulated and often has a central, stellate scar. Ten to 20 percent are multiple. FNH is supplied by an internal arterial network that is arranged in a spoke-wheel pattern. They are much more common in women (80% to 90%). Unlike hepatic adenomas, they are not related to use of birth control pills, although birth control pills may promote their growth. They seldom bleed or cause any clinical symptoms, although pain may be encountered when the lesions are large.
FNH is usually detected as an incidental mass that enhances brightly and transiently during the arterial phase of CT scans. Sonography is not typically part of the work-up of suspected FNH unless it is used to guide percutaneous biopsy. This may change with the more widespread use of intravenous ultrasound contrast agents. Although the appearance of FNH varies on sonography, most are isoechoic or nearly isoechoic to liver parenchyma (Fig. 3-11). This makes sense because their cellular makeup is similar to that of liver. They may also have a target appearance. Calcification, cystic changes, hemorrhagic areas, and necrosis are very uncommon. The central stellate scar, which is frequently seen on CT and MRI, is uncommonly seen on conventional ultrasound (but should be seen with contrast medium enhancement). However, the spoke-wheel pattern of internal vascularity is better displayed on color or power Doppler imaging than on CT or MRI. This is composed of one or occasionally more than one dominant feeding artery that enters the tumor from the periphery, travels to the center of the lesion, and then
Liver 57
divides into multiple branches that radiate back out to the periphery of the lesion (see Fig. 3-11B and E).
The differential diagnosis of FNH includes fibrolamellar carcinoma, hepatic adenoma, hepatocellular carcinoma, hemangioma, and vascular metastases. In most cases the clinical history will point in the right direction. Fibrolamellar cancer most closely simulates FNH because it has a central scar and a spoke-wheel pattern of vascularity. Any features of malignancy (metastases or adenopathy) or lesional calcification or necrosis would suggest fibrolamellar cancer.
When a lesion suspected to represent FNH is initially detected with ultrasound, hepatic scintigraphy with sulfur colloid can be very useful. Because of the concentration of Kupffer cells, approximately 60% of FNH will be either hot (more intense than adjacent liver) or warm (isointense to adjacent liver). The typical features on ultrasound (in particular the spoke-wheel arterial pattern) and these findings on sulfur colloid scans are sufficient to make the diagnosis with a high degree of certainty. If the lesion is cold on sulfur colloid scans, then FNH remains a possibility, but other lesions also need to be considered. MRI with reticuloendothelial contrast agents is also becoming a popular way of confirming suspected FNH.
Hepatic Adenoma
Adenomas are rare benign tumors that contain normal (or occasionally slightly abnormal) hepatocytes but few Kupffer cells and virtually no bile ductules. Tumor capsules are usually absent or incomplete. Adenomas occur most commonly in women taking birth control pills, and their incidence is related to both dose and duration of use of oral contraceptives. They also occur in men taking anabolic steroids. Multiple adenomas may occur in patients with type I glycogen storage disease, and multiplicity defines a condition known as hepatic adenomatosis. Their propensity to bleed makes them surgical lesions despite their benign histology. They also have a low but real risk of malignant degeneration. Their sonographic appearance is varied and nonspecific, and in most cases additional imaging is necessary to confirm the diagnosis. They are usually not suspected in a patient unless the clinical history includes known use of oral contraceptives or previous bleeding episodes.
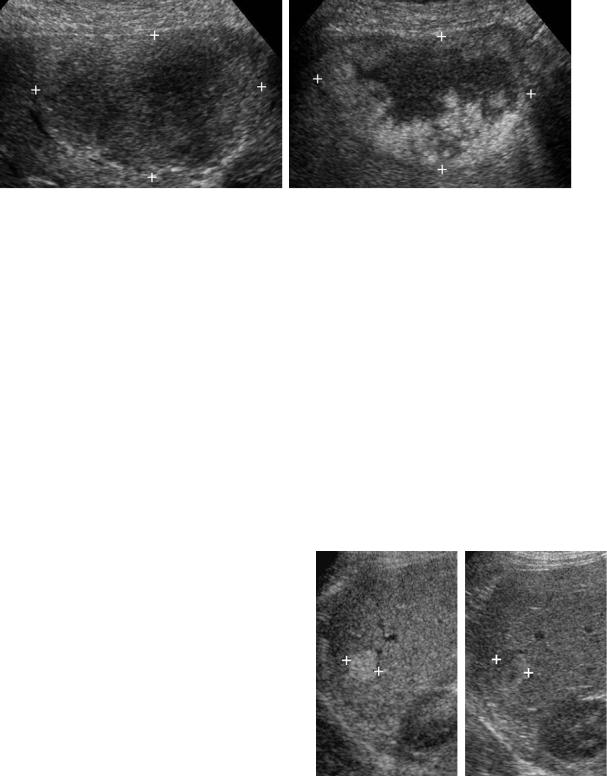
Simple, small uncomplicated adenomas tend to be homogeneous and are often hypoechoic. Internal hemorrhage or necrosis usually produces a heterogeneous appearance and/or complex cystic components
(Fig. 3-12). Intratumoral fat may result in a hyperechoic appearance. Calcifications occur in 10% of cases. Free intraperitoneal fluid may be seen in cases of intraperitoneal rupture.
58 ULTRASOUND: THE REQUISITES
A B C
D E F
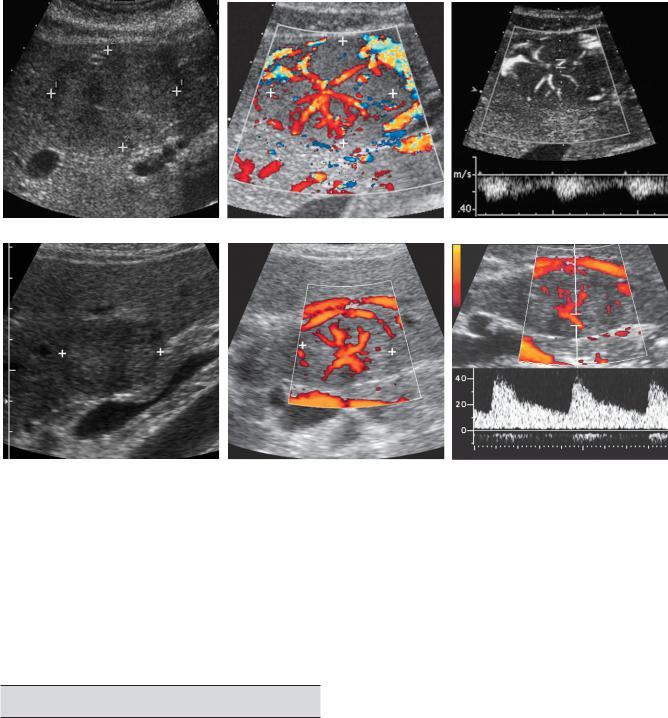
Figure 3-11 Focal nodular hyperplasia in different patients. Gray-scale (A), color Doppler (B), and pulsed Doppler (C) views of a patient with typical focal nodular hyperplasia (cursors). The grayscale view shows a slightly heterogeneous mass that is predominantly isoechoic to the liver. Color Doppler imaging shows the typical spoke-wheel arrangement of internal vascularity. Pulsed Doppler waveform confirms the arterial nature of the central vascular flow. D to F, Similar views of another patient with focal nodular hyperplasia (cursors). The gray-scale view shows a target lesion that is slightly hyperechoic centrally but has a hypoechoic halo. Color Doppler view again demonstrates the spoke-wheel pattern, and the pulsed Doppler view confirms arterial flow within the lesion.
MALIGNANT TUMORS
Metastases
The lungs and liver are the most frequent sites of distant metastatic disease, and metastases are the most common malignant liver lesion in North America. Up to 50% of patients dying of cancer have liver metastases.
Metastases are multiple in up to 98% of cases, and they usually involve both lobes of the liver. Signs and symptoms of liver disease are absent in approximately one half of patients with liver metastases. Liver function tests are
also unreliable in detecting liver metastases. Therefore, imaging plays a critical role in patients with suspected liver metastases.
The majority of metastatic lesions have a target appearance with an echogenic or isoechoic center and a hypoechoic halo (Fig. 3-13). When the halo is thin, it may represent dilated peritumoral sinusoids or compressed liver parenchyma. Thick halos represent proliferating tumor. After metastases, the most common cause of target lesions is hepatocellular carcinoma. Lymphoma can also produce target lesions. Abscesses, adenomas, and FNH may appear as target lesions, but these lesions