

печень
.pdfLiver 69
A B C
D E F
G H I
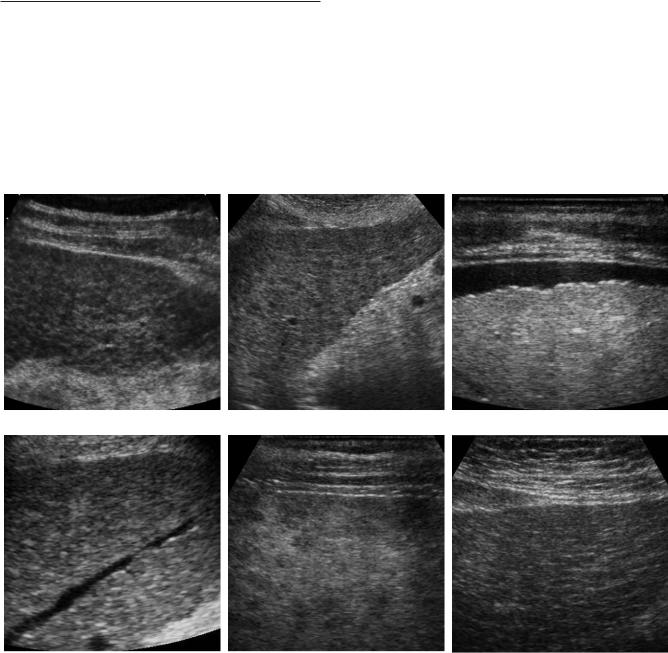
Figure 3-26 Fatty infiltration of the liver in different patients. A, Longitudinal view of the liver and right kidney shows marked discrepancy between the hyperechoic liver and the normal right kidney. B, Transverse view through the liver shows marked discrepancy between the hyperechoic liver and the normal pancreas. C, Transverse view of the liver demonstrates attenuation of the sound beam with progressive decreased echogenicity of the deeper aspects of the liver, indicating more advanced fatty infiltration. D, Transverse view shows loss of detectable internal vascular structures in the liver and very poor definition of the diaphragm, indicating very advanced fatty infiltration. E, Transverse view through the portal bifurcation demonstrates a focal area of decreased echogenicity (cursors) anterior to the portal vein secondary to focal parenchymal sparing. F, Longitudinal view showing a gallbladder with stones and a focal area of decreased hepatic parenchymal echogenicity (cursors) adjacent to the gallbladder due to focal parenchymal sparing. G, Oblique view through the liver shows a non-spherical area of increased echogenicity posteriorly that does not displace the hepatic vein in that area. This is typical of a focal region of fatty infiltration. H, Longitudinal view through the left lobe of the liver shows an oval area of increased echogenicity anteriorly (cursors) secondary to focal nodular fatty infiltration. This was located immediately adjacent to the ligamentum teres. I, Longitudinal view of the liver demonstrating multiple focal nodular areas of increased echogenicity. MRI confirmed this was multifocal fatty infiltration.
70 ULTRASOUND: THE REQUISITES
certain and no further evaluation is necessary. On the other hand, fatty infiltration may rarely cause focal or multifocal nodular regions of increased echogenicity in atypical locations. This can closely simulate metastatic disease or hemangiomas. In such cases, MRI should be considered to confirm the diagnosis of nodular fatty infiltration.
Cirrhosis
Cirrhosis is caused by hepatocellular death and resulting fibrosis and regeneration. It occurs most commonly from alcohol abuse, which causes micronodular changes (<1 cm). Hepatitis is the next most common cause, and it results in macronodular cirrhosis (nodules between 1 and 5 cm). Surface nodularity can easily be detected sonographically in the presence of ascites and is a
reliable sign of cirrhosis (Fig. 3-27). In the absence of ascites, surface nodularity is best detected using a highresolution linearor curved-array transducer focused on the liver surface. Nodularity can also be seen where liver interfaces with structures that are anechoic (e.g., anechoic gallbladder or hepatic veins) or echogenic structures (e.g., perihepatic fat). Coarsening and nodularity of the liver parenchyma is another useful sign of cirrhosis that can be seen especially well with the high-resolution probes focused on the superficial liver parenchyma (see Fig. 3-27). Although the liver shrinks in advanced disease, there is frequently an initial redistribution of liver volume toward the caudate lobe and the lateral segment of the left lobe. Ratios comparing the size of the caudate lobe and the right lobe have been used in the past to make the diagnosis of cirrhosis. This technique has now been replaced by more direct analysis of the liver
A B C
D E F
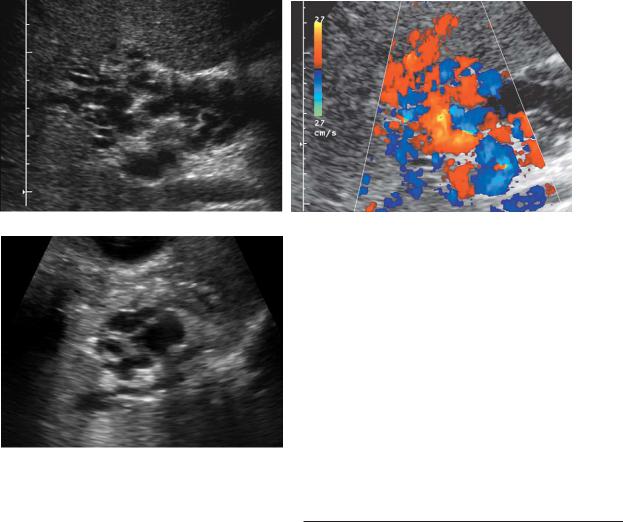
Figure 3-27 Cirrhosis in different patients. A and B, Conventional views show diffuse heterogeneity and nodularity to the liver parenchyma. C, High-resolution view of the liver surface shows surface nodularity. D, View of a hepatic vein shows multiple nodular impressions on the hepatic vein lumen. E, High-resolution view of the superficial liver parenchyma demonstrates scattered multifocal hypoechoic nodules. F, High-resolution view of the liver surface demonstrates diffuse heterogeneity and hyperechoic strands of parenchymal fibrosis.
surface and the liver parenchyma. Unless there is associated fatty infiltration, cirrhosis does not typically result in significant attenuation of sound.
VASCULAR DISEASE
Normal Hemodynamics
The portal vein normally supplies 75% of the blood flow to the liver. Because it is isolated from the systemic veins and the right atrium, it is relatively unaffected by the pressure changes that occur during cardiac contraction and relaxation. Therefore, portal flow is usually characterized by little or no pulsatility (Fig. 3-28). However, portal vein pulsatility can be normal, especially in thin individuals. Normal flow velocities average 20 to 30 cm/sec. Antegrade portal flow into the liver is referred to as hepatopetal.
The hepatic veins drain into the IVC near the right atrium, and the flow is very dependent on right atrial activity. Figure 3-29 illustrates the normal hepatic venous waveform and describes its relationship to atrial contraction and relaxation. Because the waveform is pulsatile with two antegrade pulses and one retrograde pulse, it is referred to as triphasic. A deep inspiration can cause blunting and occasionally complete loss of hepatic vein pulsatility, so hepatic vein waveforms should be obtained at normal end expiration. Antegrade hepatic venous flow is away from the liver and is referred to as hepatofugal.
Hepatic arterial flow is similar to arterial flow to other solid organs such as the kidney and brain. It has a low-resistance arterial waveform with well-maintained antegrade flow throughout diastole.
Portal Hypertension
Portal hypertension can be divided into intrahepatic, extrahepatic, and hyperdynamic categories (Box 3-5).
Intrahepatic portal hypertension is the most common type in North America, owing to the prevalence of alcoholic cirrhosis. In this disease, hepatocellular death results in scarring, which causes increased resistance to
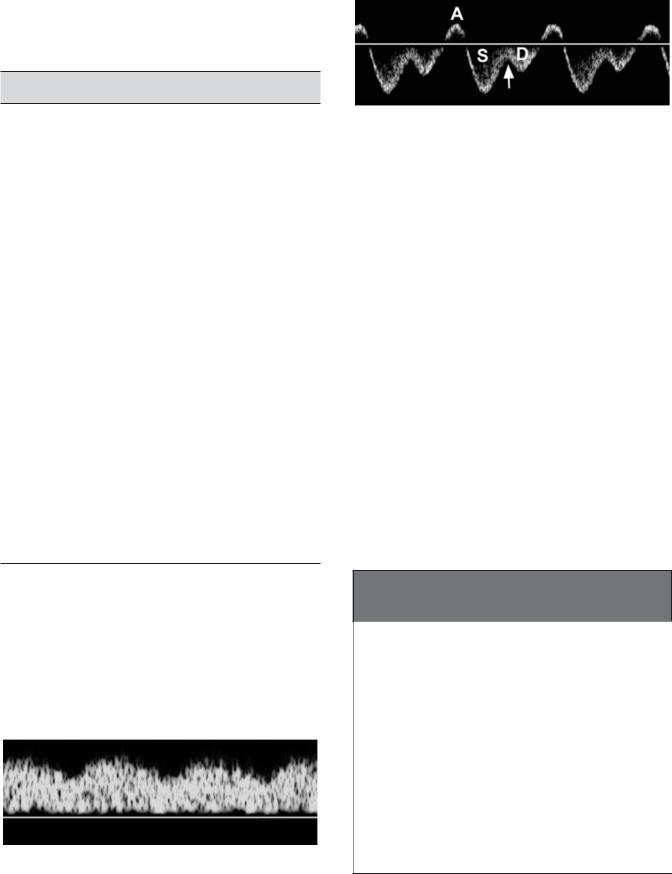
Figure 3-28 Normal portal vein waveform. Minimal pulsatility is identified and is related to the cardiac cycle.
Liver 71
Figure 3-29 Normal hepatic vein waveform. During right atrial contraction (A), flow is in a retrograde direction back into the liver. After right atrial contraction, there is a phase of rapid right atrial filling and rapid outflow of blood from the hepatic veins into the right atrium, which is visualized as a large pulse below the baseline, referred to as the S wave (because it occurs during ventricular systole). As the right atrium gets progressively fuller, flow out of the hepatic vein starts to slow and the waveform starts to return to the baseline. When the tricuspid valve opens (arrow), blood from the right atrium starts to flow into the right ventricle, promoting a second pulse of flow out of the hepatic veins and into the right atrium called the D wave (because it occurs during ventricular diastole). This second antegrade pulse is usually smaller than the first. After the D wave, the right atrium contracts again and the cycle repeats itself.
flow in the hepatic sinusoids and the small centrilobular veins that drain the sinusoids. Initially, the portal venous pressure increases so that total portal flow to the liver is maintained. However, the resistance to flow into the liver eventually becomes equal to resistance in potential portosystemic collaterals and some of the portal flow becomes diverted into those collaterals. As portal flow decreases, hepatic arterial flow increases to partially compensate for the diminished portal inflow. Eventually, resistance to flow in the sinusoids and central veins becomes so great that even the high-pressure hepatic
Box 3-5 Classification of Portal
Hypertension
INTRAHEPATIC |
EXTRAHEPATIC |
HYPERDYNAMIC |
Postsinusoidal |
Prehepatic |
Arterioportal Fistula |
Cirrhosis |
Portal vein |
Post-traumatic |
Veno-occlusive |
thrombosis |
Congenital |
disease |
Portal vein |
Atherosclerotic |
|
compression |
|
Presinusoidal |
Posthepatic |
|
Hepatic |
Hepatic vein |
|
fibrosis |
thrombosis |
|
Schistosomiasis |
IVC obstruction |
|
Lymphoma |
Constrictive |
|
Sarcoidosis |
pericarditis |
|
IVC, inferior vena cava. |
|
|
72 ULTRASOUND: THE REQUISITES
arterial flow has difficulty getting through the normal channels into the hepatic veins. At this point, some hepatic artery flow gets diverted into the portal system through microscopic collaterals in the peribiliary plexus and vasa vasorum of the portal vein. When this occurs, flow in the portal vein reverses.
There are a number of sonographic findings seen with portal hypertension. On gray-scale imaging, they include enlargement of the portal vein, splenomegaly, and ascites. Portal vein diameter is an attractive measurement because it is easy to obtain. Unfortunately, there is a wide range of accepted normal values (10 to 17 mm) and variations occur with patient positioning, respiration, and fasting status. One commonly quoted figure is 13 mm measured in the anteroposterior direction where the portal vein crosses the IVC in a supine patient during quiet respiration. Detection of portosystemic collaterals is relatively sensitive and is the most specific sign of portal hypertension. The easiest collateral to detect with ultrasound is the umbilical vein (Fig. 3-30). This communicates with the umbilical
segment of the left portal vein located between the medial and lateral segment of the left lobe of the liver. It travels in the ligamentum teres and communicates with periumbilical collaterals in the ligamentum teres and the abdominal wall. It ultimately drains into the inferior epigastric veins or less commonly the superior epigastric veins. In some patients the fibrous band of the obliterated umbilical vein can be seen as a hypoechoic tubular structure in the ligamentum teres (see Fig. 3-1F). Therefore, detection of hepatofugal venous flow on Doppler analysis is required to establish patency of this potential collateral. On gray-scale imaging, this structure should not exceed 3 mm in diameter.
The next most easily detected collateral on sonography is the coronary vein. It can be seen behind the left lobe of the liver arising from the splenic vein (near the portosplenic confluence) and extending superiorly and usually toward the left (Fig. 3-31). It typically travels over the branches of the celiac bifurcation, although it may be identified posterior to the bifurcation. In normal patients it should not exceed 6 mm. Reversed coronary
A B C
D E F
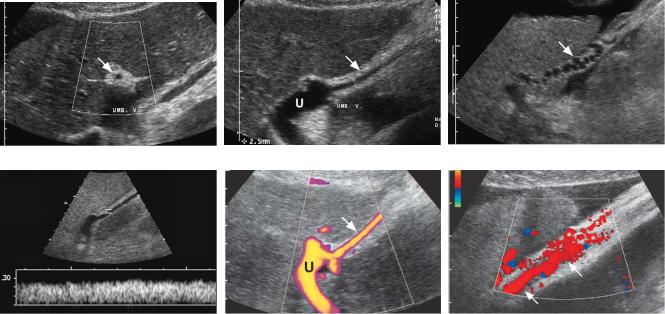
Figure 3-30 Umbilical vein collateral in different patients. A, Transverse view of the left lobe of the liver demonstrates the echogenic ligamentum teres (arrow). It contains an umbilical collateral that appears as a small central hypoechoic, round structure. B, Longitudinal view of the left lobe of the liver shows the ligamentum teres (arrow) and an umbilical collateral seen as a small, 2.5 mm, central vessel (cursors). Note that the umbilical vein collateral communicates with the umbilical segment of the left portal vein (U). C, Longitudinal view of the ligamentum teres (arrow) shows a very tortuous vascular structure within the ligament consistent with a paraumbilical collateral. D, Pulsed Doppler waveform from an umbilical vein collateral shows hepatofugal venous flow directed out of the liver. E, Power Doppler view shows blood flow within the umbilical segment of the left portal vein (U) communicating with an umbilical vein collateral (arrow). F, Color Doppler view shows an umbilical collateral (arrows) as it starts to supply multiple periumbilical collaterals (*).
Liver 73
A B
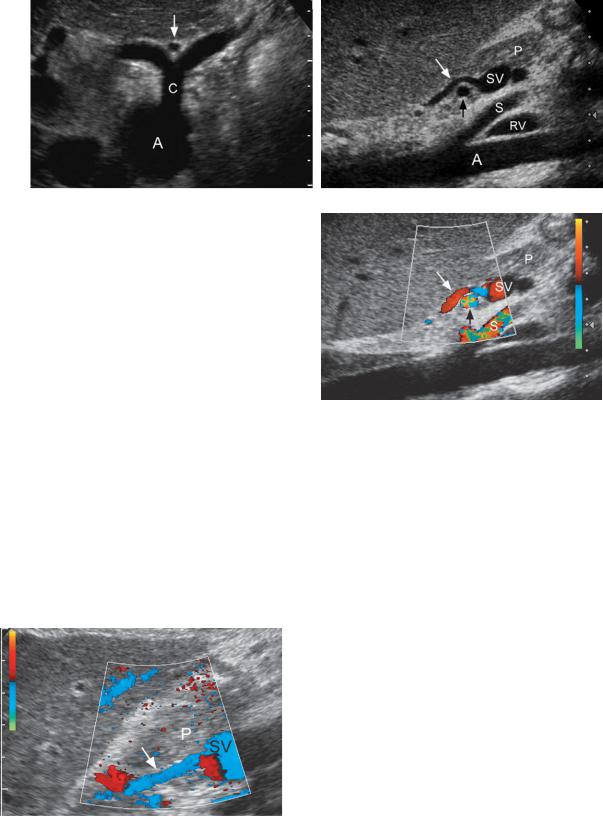
Figure 3-31 Normal coronary vein. A, Transverse view shows the aorta (A) and the celiac axis (C). The coronary vein (arrow) is seen immediately anterior to the bifurcation of the celiac axis. B, Longitudinal view shows the splenic vein (SV) immediately posterior to the body of the pancreas (P) and anterior to the superior mesenteric artery (S). The coronary vein (white arrow) is seen arising from the splenic vein and draping over a branch of the celiac axis (black arrow). This branch could either be the hepatic artery or the splenic artery. Also seen on this view are the left renal vein (RV) and the aorta (A). C, Longitudinal color Doppler view similar to that in B shows flow in the coronary vein directed toward the splenic vein, as expected.
vein flow (i.e., away from the splenic vein and toward the gastroesophageal junction) and enlargement indicate portal hypertension (Fig. 3-32). In fact, reversed flow in any tributary of the portal or splenic vein is a sign of portal hypertension. Many other potential portosystemic collaterals exist but are more difficult to detect sonographically. These include splenorenal,
Figure 3-32 Abnormal coronary vein. Longitudinal view shows the splenic vein (SV) immediately posterior to the body of the pancreas (P). The coronary vein (arrow) has flow directed away from the splenic vein.
C
splenoretroperitoneal, superior mesenteric, and inferior mesenteric venous collaterals.
Detection of hepatofugal (retrograde) flow in the portal vein is another relatively specific sign of portal hypertension that occurs in more advanced cases. Initially, it occurs in isolated peripheral branches of the portal vein (Fig. 3-33A). With more advanced disease, it involves the central right and left portal branches and eventually the main portal vein itself (see Fig. 3-33B). It can be recognized on Doppler waveforms when portal flow is on the opposite side of the baseline from the hepatic arteries (see Fig. 3-33C). In patients with large umbilical collaterals, it is common to have reversed flow in the right portal vein that crosses the bifurcation and supplies antegrade flow to the left portal vein and ultimately to the umbilical vein. Box 3-6 reviews the sonographic findings in portal hypertension.
Extrahepatic causes of portal hypertension are divided into prehepatic and posthepatic. Prehepatic causes include portal vein thrombosis and portal vein compression. Portal vein compression usually occurs owing to tumors in adjacent organs or lymphadenopathy (Fig. 3-34). Portal vein thrombosis frequently occurs in patients with slow portal flow caused by portal hypertension. It also occurs in patients with hypercoagulable
74 ULTRASOUND: THE REQUISITES
A B C
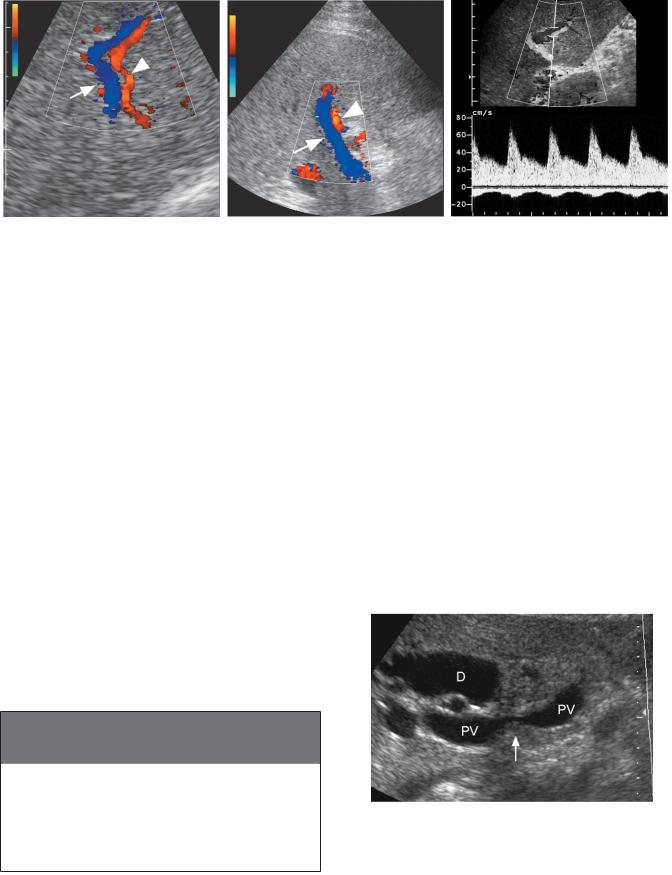
Figure 3-33 Portal vein flow reversal in different patients. A, Magnified color Doppler view of the peripheral aspect of the right lobe of the liver shows a portal vein (arrow) adjacent to a hepatic artery (arrowhead). Flow direction in these two vessels is different. Hepatic arterial flow is directed toward the periphery of the liver, and portal vein flow is directed away from the periphery of the liver. B, Longitudinal view of the porta hepatis shows the main portal vein (arrow) and adjacent hepatic artery (arrowhead). As in A, hepatic arterial flow is directed into the liver and portal vein flow is directed out of the liver. C, Pulsed Doppler waveform from an adjacent intrahepatic portal vein and hepatic artery shows arterial flow above the baseline and portal venous flow below the baseline indicating reversal of portal vein flow.
states and intestinal infection or inflammation (i.e., appendicitis, diverticulitis, inflammatory bowel disease). On gray-scale imaging, detection of thrombosis depends on identification of an intraluminal filling defect or abnormal intraluminal echoes. The latter finding may be difficult to distinguish from the artifactual low-level echoes that often appear in the portal vein. Thrombus can appear hyperechoic, isoechoic, hypoechoic (Fig. 3-35), or rarely anechoic. In the latter case it will be undetectable with gray-scale sonography; therefore, color and duplex Doppler imaging studies are important adjunctive tools. On color Doppler analysis, portal vein thrombosis appears as a localized flow void or as complete lack of detectable intraluminal flow. When no flow is detected but no thrombus is seen on gray-scale imaging, then the possibility of a patent vein with very slow flow should be considered (Fig. 3-36). Because portal flow increases after a meal, rescanning after eating may
Box 3-6 Sonographic Signs of Portal
Hypertension
Ascites
Splenomegaly
Portal vein enlargement
Portosystemic collaterals
Enlarged hepatic arteries
Hepatofugal (reversed) portal flow
convert slow undetectable flow to faster flow that is detectable. If this fails, another imaging study using an intravenous contrast agent (CT, MRI or US) should be performed to document thrombosis or establish portal vein patency. The overall accuracy of color Doppler imaging in diagnosing portal vein thrombosis is high, with a sensitivity and specificity of approximately 90%. False-negative results are very uncommon, and the negative predictive value is 98%. One potential cause of a false-negative examination is when a single, isolated, large, periportal collateral is confused with a patent portal vein (Fig. 3-37). The clue to this diagnosis is that the
Figure 3-34 Extrahepatic portal hypertension secondary to portal vein compression. Longitudinal view of the porta hepatis shows the portal vein (PV) with an area of marked narrowing (arrow). This was due to a cholangiocarcinoma that encased the portal vein. Also noted is a markedly dilated bile duct (D).
Liver 75
A B
C D
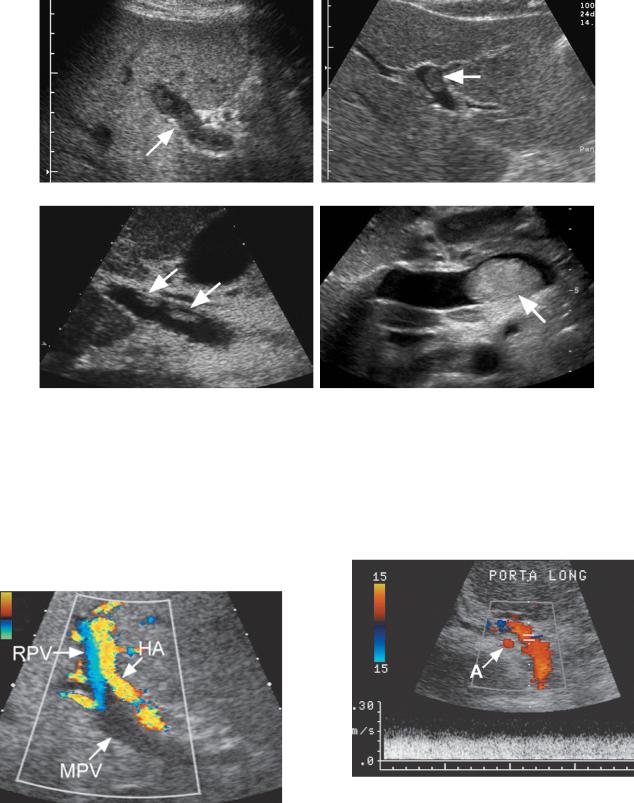
Figure 3-35 Portal vein thrombosis in different patients. A, Longitudinal view of the main portal vein (arrow) shows hypoechoic thrombus throughout the venous lumen. B, Transverse view of the left portal vein shows focal isoechoic thrombus (arrow) within the lumen. C, Longitudinal view of the main portal vein shows focal hyperechoic thrombus (arrows) within the lumen. D, Transverse view of the main portal vein shows a large hyperechoic thrombus (arrow) near the splenic vein confluence.
Figure 3-36 Slow portal venous flow. Longitudinal view of the portal vein shows flow in the hepatic artery (HA) and detectable but reversed flow in the right portal vein (RPV). No flow is detected in the main portal vein (MPV). Subsequent MRI examination showed slow flow in a patent main portal vein.
Figure 3-37 Periportal collateral simulating a patent portal vein. Longitudinal color and pulsed Doppler view demonstrates a large vessel in the porta hepatis with hepatopetal venous flow. This could easily be mistaken for a patent portal vein. However, it is located anterior to the hepatic artery (A). This patient had chronic portal vein thrombosis, and the portal vein was small and fibrotic and could not be visualized.
76 ULTRASOUND: THE REQUISITES
A B
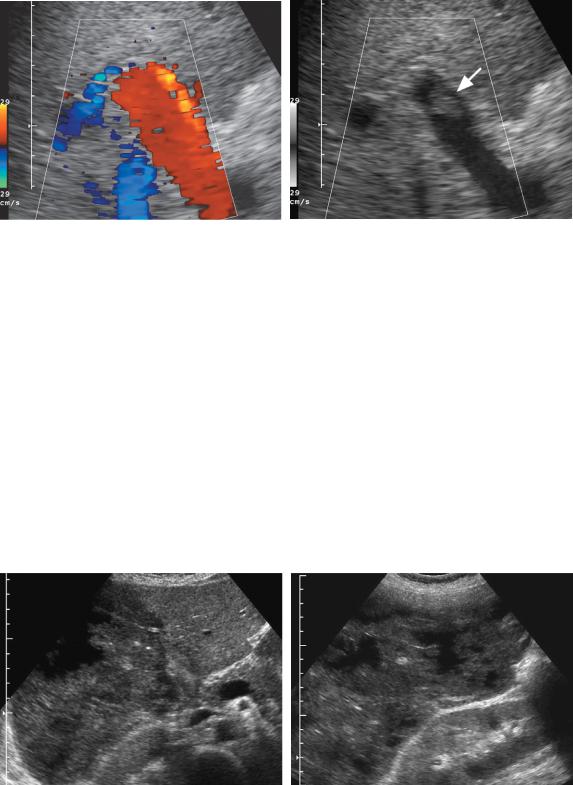
Figure 3-38 Color Doppler blooming artifact obscuring focal portal vein thrombosis. Longitudinal color Doppler views of the portal vein with the color Doppler information displayed (A) and not displayed (B). A, With the color Doppler signals being displayed on the image, there is no evidence of a filling defect within the portal vein. B, When the color Doppler signal is not displayed, so that the background gray-scale image can be seen, a focal nonocclusive thrombus (arrow) is seen in the portal vein lumen.
collateral is almost always located anterior to the hepatic artery. Another potential pitfall is when focal non-occlu- sive thrombus is obscured by blooming artifact on color Doppler analysis (Fig. 3-38). Therefore, it is important to perform a careful gray-scale evaluation as well as a Doppler evaluation. As mentioned earlier, false-positive results can occur because of slow portal vein flow. Fortunately, modern Doppler techniques have made this uncommon. Intravenous contrast agents will undoubtedly make the sonographic diagnosis of portal vein thrombosis easier.
Because of the dual arterial and portal blood supply, liver infarcts are uncommon even in the setting of total portal vein thrombosis. They usually occur only in the setting of advanced underlying vascular disease of the liver. The sonographic appearance of liver infarcts depends on their age: acute infarcts are hypoechoic, and chronic infarcts are hyperechoic. Although a wedge shape is characteristic, it is not always seen sonographically (Fig. 3-39).
In addition to bland thrombus, tumors can invade the portal vein and produce intraluminal tumor thrombus. Expansion of the portal vein suggests tumor thrombus.
A B
Figure 3-39 Hepatic infarction in a patient with HELLP (hemolysis, elevated liver enzymes, and low platelets) syndrome. A, Transverse view of the liver demonstrates diffuse decreased echogenicity and areas of liquefaction throughout the right lobe of the liver. The left lobe of the liver is normal. B, Longitudinal view through the right lobe of the liver shows multiple areas of liquefaction secondary to hepatic necrosis.
Tumor thrombus can confidently be diagnosed if blood flow is seen within the thrombus on color Doppler imaging (Fig. 3-40). As mentioned earlier, HCC is the tumor most likely to invade the portal vein.
In some cases of portal vein thrombosis, prominent periportal collaterals with hepatopetal flow will develop anterior to the portal vein. The collaterals typically form in the hepatoduodenal ligament (Fig. 3-41), but they have also been identified in the wall of the common bile duct. This is referred to as cavernous transformation of the portal vein, which is actually a misnomer and should not be confused with recanalized portal vein thrombosis.
Posthepatic causes of portal hypertension include hepatic vein thrombosis, IVC thrombosis, IVC membranes, and constrictive pericarditis. Hepatic vein thrombosis can potentially produce all the signs of portal hypertension described earlier. On gray-scale imaging, thrombus can occasionally be seen in the hepatic veins (Fig.
3-42A). In addition, it can cause several characteristic changes in the hepatic vein flow. The most obvious is lack of flow in the hepatic veins despite clear identification of the veins on gray-scale imaging (see Fig. 3-42D).
Liver 77
In some cases the hepatic veins cannot be identified on gray-scale imaging and no flow is detected on color Doppler imaging. In many cases, collateral drainage will develop to compensate for the occluded hepatic veins. This drainage may flow into a main hepatic vein or accessory hepatic vein that has been spared into normal veins that drain the caudate lobe (see Fig. 3-42E), or into subcapsular veins. When collaterals develop, the hepatic vein that supplies the collateral will have reversed flow (see Fig. 3-42B). In addition, because the hepatic veins are isolated from the right atrium, pulsatility will be blunted, and in most cases the waveform will be monophasic and flat (Fig. 3-42C). Other causes of blunted hepatic vein pulsatility include cirrhosis, diffuse metastatic disease, extrinsic compression of the vein, liver transplant rejection, other diffuse parenchymal diseases, and a deep inspiration. The sensitivity of Doppler ultrasound in making the diagnosis of hepatic vein thrombosis is quite high when relying on two criteria: (1) hepatic vein(s) seen on gray-scale imaging with no detectable flow or reversed flow on color Doppler, and (2) hepatic vein(s) not seen on either grayscale imaging or color Doppler ultrasound analysis.
A B
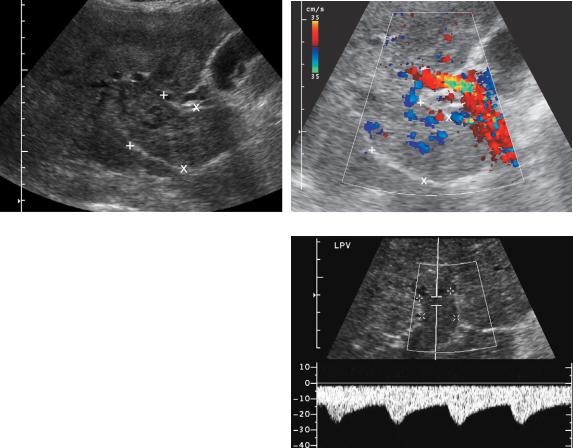
Figure 3-40 Portal vein tumor thrombus. Longitudinal gray-scale (A) and color Doppler (B) views of the porta hepatis show a markedly expanded portal vein (cursors) filled with solid tumor. In B, there is internal blood flow within the thrombus confirming that this represents vascularized tissue and thus tumor thrombus. C, In a different patient, pulsed Doppler analysis of thrombus in the left portal vein (cursors) shows hepatofugal arterial flow.
C
78 ULTRASOUND: THE REQUISITES
A B
C
Unfortunately, approximately 15% of patients with advanced cirrhosis but no hepatic vein thrombosis will have one or more hepatic veins that cannot be identified on either gray-scale or color Doppler imaging. Therefore, the specificity of ultrasound is not as good as its sensitivity.
The last category of portal hypertension is called hyperdynamic, and it refers to arterioportal fistulas. These fistulas may be congenital or post-traumatic (e.g., following liver biopsy) and can also result from a hepatic artery aneurysm that erodes into the adjacent portal vein. They generally appear as a multilobulated, multicystic mass in the liver. Doppler analysis will reveal arterial flow within the lesion and reversal of flow and arterialization of the draining portal vein. In patients with hereditary hemorrhagic telangiectasia (Osler-Weber-Rendu syndrome), tiny arterioportal fistulas may occur. These are usually not detectable with either gray-scale or color Doppler imaging. However, the hemodynamic consequences of localized peripheral portal vein flow reversal and enlargement of the hepatic arteries are visible (Fig. 3-43).
Figure 3-41 Cavernous transformation of the porta hepatis. Longitudinal gray-scale (A) and color Doppler (B) views of the porta hepatis demonstrate multiple cystic and tortuous tubular-appearing structures. No normal portal vein is seen. Color Doppler view shows blood flow throughout all of these structures, consistent with extensive periportal collateralization. C, Gray-scale view in a different patient shows less extensive collateral formation in the porta hepatis.
Passive Hepatic Congestion
Heart failure can result in passive congestion of the liver, causing right upper quadrant pain and liver function abnormalities. It can be suggested on gray-scale imaging by noting hepatomegaly, enlarged hepatic veins, and an enlarged IVC. Pulsed Doppler waveforms from the portal vein will show prominent pulsatility related to the cardiac cycle. The minimum degree of portal vein pulsatility required to diagnose right-sided heart dysfunction is not uniformly agreed upon. However, most would agree that when pulsatile portal flow either reaches or goes below the Doppler baseline, right-sided heart dysfunction is very likely to be present (Fig. 3-44A).
Right-sided heart failure will also produce increased pulsatility in the hepatic veins so that the antegrade and retrograde components are more equalized and the waveform has a “W”-shaped appearance (see Fig. 3-44B). Tricuspid regurgitation causes the normally antegrade systolic hepatic vein flow to invert and produces a waveform with only one antegrade pulse that occurs during diastole (see Fig. 3-44C).