

Rheo3000Help_EN
.pdfFigure 1: Event configuration dialog
(1)On the “Default” page it is specified for which blocks these events are valid (see also Block Selection Field)
(2)“Event definition” page to manage events
(3)Parameter selection field (input size)
(4)Comparison operator selecting field
(5)Comparison value (incl. option of choosing unit)
(6)Time after this block has run through according to which measuring points are checked for the event.
(7)Action if comparison is applicable (selection field)
(8)Text field for user-specific message only available for actions “Notification”.
(9)configured event is added to a list
(10)chosen event is removed from the list
(11)List of current events (max 15 are allowed)
Example A (see figure 1):
If T[°C] >= 25 then cancel the program execution (11)
The above shown example would cancel the measurement (the program execution) if the temperature is greater or equal to 25 °C. A total of 15 events may be defined for each block. The applicability of all conditions is checked upon input of a measuring point. The sequence of the processing corresponds to table display.
Event Counter

A counter is available as an important element of the events. This counter can be used as an input size as well as be changed by the reaction. If for example it is requested when specifying a liquid limit that the block is cancelled after 4 consecutively following shear rate values > 0.5s-1, in order not to destroy the medium, then this can be completed via the following event definition of the block:
Example B :
Event 1: If D[1/s] > 0.5 then increase event counter (+1)
Event 2: If D[1/s] <= 0.5 then reset event counter (0)
Event 3: If counter = 3.0 the cancel program
Event -1 increases the counter by 1, if it is D > 0.5 s-1, while event – 2 resets the counter as soon as a value D <=0.5 s-1 appears. Once the counter reaches the value 3 the block is cancelled by event -3. The counter value 3 is only reached if 3 measuring values back to back result in a shear rate greater than 0.5 s-1 . If a measuring point with a shear rate < 0.5 s-1 is in between, then the counter is reset via event -2.
Related topics:
∙Block Overview

Lift Control Block
Some devices possess a lift mechanism that is used to move the measuring system or the substance against each other. The task of the block is to control such functions.
Configuration dialog options
(1)If this checkmark is set then the device searches first the reference point, in a normal case the upper position
(2)If this checkmark is set then the device searches for the attachment point where the measuring system is attached on the bottom.
(3-6) These are positions that launch the device
(3)If selected the device will drive to the reference position
(4)If selected the device will drive to the unloading position, where the substance can be removed
(5)If selected the device will drive to the cupola position, where the measuring device can be removed or exchanged without needing to drive to the reference positions
(6)Drives the device to the measuring position into the substance
Warning: In the event of a malfunction the lift process on the device may be cancelled. If possible an employee should be present during the test when using this block, to be able to intervene if necessary.
Related topics:
∙Block Overview

 (I)
(I)  (II) Soft Solid Blocks (SST)
Soft Solid is a special form of the rheological analysis. For this purpose the measuring parameter are configured for the test via the SST-specification block (I) and the respective analysis evaluation options via the SST Analysis block (II).
The Soft Solids Analysis Functions enable the quantification of properties of tested materials using regression analyses and peak-value identifications.
Soft Solid is distinguished here into two test types – the creep test and the shear modulus or modulus test. Depending on which type you decide to use it must be set accordingly in the specification block and the analysis block (3) (21).
1. SoftSolid Specification Block
SST shear modulus test
Figure 1: SST Specification Block Configuration (Modulus)
(21)Select SST test type (creep or shear modulus test)
(22)Test period
(23)Specification parameter
(24)If a checkmark is set then the last value of the previous measuring block is transferred, if possible.
(25)Default value

(26) Number of measuring points over time
SST creep test
Figure 2: SST Specification Block Configuration (Creep)
(31)Time allowed for creep share
(32)Time allowed for recovery share
(23) Parameter selection option
(33) Default value
(26) Number of measuring points over time
(34) Here the automatically specified measuring point distribution is read.

2. Soft Solid Evaluation / Analysis Block
As in most of the analysis blocks the tables and diagram views can be configured here as well under figure3 –(1). The SST specification block this analysis refers to can be selected in the block selection field (2), using the same type (as under (3)). The settings are saved by clicking on “OK”.
SST shear modulus analysis
Under (4) and (5) the lower and upper percent limit of the maximum value are specified. Typically the limits are at 20% and 70%, however they should be adjusted to longer or shorter linear ranges.
Figure 3: SST Evaluation Block Configuration (Shear Modulus)
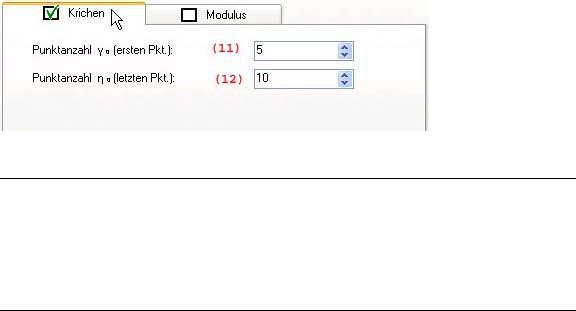
SST Creep Test Analysis
For the creep analysis the number of points to be used for the regression must be specified here. For the momentary reaction (Gamma-0) calculation the number of points (11)as of the beginning and for the viscous reaction (Eta-0) calculation, the number of points (12) from the end (the maximum value) backwards. Typical values for this are 5 and 20 points.
Figure 4: SST Evaluation Block Configuration (Creep)
Related topics:
∙Block Overview
∙Temperature Regulation
(Text of previous SW-Help)
Yield / Modulus
The peak value within the data range is reported as Yield Point
values for Stress and Torque. The Strain and Angular Displacement at the yield point are also reported. A regression is performed on the range defined in Configuration and the gradient of the stress vs. strain curve is reported as Modulus. The regression coefficient, B, and the standard deviation, S, is also reported. Creep Two regressions are performed on the creep data to obtain: Instantaneous Response: A regression is performed on the range defined in Configuration to obtain values for instantaneous Compliance, Strain and angular Displacement. Viscous Response: A regression is performed on the range defined in Configuration to obtain Creep Viscosity. The intercept on the y axis (strain, Displacement or Compliance) is then divided by the maximum value (last data point) of the creep curve to obtain Elastic Index Configuration Modulus: The upper and lower limits of the range for the modulus regression is defined here
as percentages of the peak value.
Creep: The number of points for the regressions for
Instantaneous Response and Viscous Response are entered here.

Maintenance Block
With help from the Maintenance Block a program may be interrupted for a specific amount of time or until the user input.
If the checkmark is set on (1)in the configuration window (figure 1) then the dialog (figure 2)opens during the program execution. In this case the program will remain at a standstill until the user chooses "OK" or "Cancel". If clicking "OK" the program will continue to run and if choosing "Cancel" the program exits out. If the checkmark is not set (1) then a maintenance period may be specified under (2) which will pause the program for execution.
Figure 1: Maintenance Block Configuration
Figure 2: Wait for user input
Related topics:
∙Block Overview

 Display Block
Through this display block other performance data windows may be configured, which will then open during the program execution. Only previous measuring blocks and their data are available for selection. The tables and diagram settings occur analog to the standard Performance Display Window
Related topics:
∙Block Overview
Regression Block
This evaluation block allows applying different regressions to the performance data. Via the configuration dialog displayed in (figure 1) the parameter and the design are defined.
Regression types:
∙Newton
∙Bingham
∙Ostwald
∙Casson
∙HershelBulkley
∙SteigerOry
∙Best
The Best regression, searches the regression from all the ones previously mentioned (as far as can be calculated) using the highest stability index.
Please observe: The individual regression types require a minimum number of measuring values for calculation. If insufficient measuring points exist within one step then the regression curve can not be calculated.

Configuration dialog
The design can be changed via the “diagram” and “table” (1) pages. The regression settings are done on the “Default” page. Under (2) blocks are chosen where the performance data are used for the regression chosen under (5), etc.…
Based on the rheological definition, some regressions always have a firmly pre-set parameter shearing strain (Tau[Pa]) and shearing rate (D[1/s]) while others can be chosen freely.
Figure 1: Regression Block Configuration Dialog
(3)Selection field for the x-parameter + text fields to limit the definition range
(4)Selection field for the y-parameter + text fields to limit the value range
(5)Choosing the regression type
(6)Formula belonging to the regression type
(7)Only if a checkmark is set will a new window open with the regression result, else only the reuse will remain in a Report Block
(8)If a checkmark is set then changes can be made in the result window, else the settings are firm.