

corruption_in_ukraine_2007-2009_2011_engl
.pdfCORRUPTION IN UKRAINE
COMPARATIVE ANALYSIS OF NATIONAL SURVEYS:2007–
2009, 2011
KYIV, 2011
All MS World ENG.indd 1 |
09.08.2011 23:29:28 |

Corruption in Ukraine. Comparative Analysis of National Surveys: 2007–2009, 2011 Kyiv – 47 p.
This report was prepared by the European Research Association in cooperation with Kyiv International Institute of Sociology in the framework of the USAID funded project «The Ukraine National Initiatives to Enhance Reforms (UNITER)» implemented by Pact Inc. Ukraine. Presented in the report are comparative results of National sociological surveys on the state of corruption in Ukraine conducted in 2007, 2008, 2009 and 2011. The survey was targeted at measuring public perception of the problem of corruption and its experience with it. This report is intended to reach a wide readership.
All MS World ENG.indd 2 |
09.08.2011 23:29:28 |

CONTENT |
|
CONTENT............................................................................................................................................................ |
3 |
SUMMARY........................................................................................................................................................... |
5 |
KEY FINDINGS..................................................................................................................................................... |
5 |
I. INTRODUCTION............................................................................................................................................. |
10 |
Survey methodology...................................................................................................................................... |
10 |
General characteristics of the 2011 survey sample....................................................................................... |
11 |
Qualitative survey ......................................................................................................................................... |
12 |
2. ATTITUDES TOWARD THE GOVERNMENT.................................................................................................. |
13 |
Trust in government........................................................................................................................................ |
13 |
Responsibility for the fight against corruption .............................................................................................. |
15 |
Will of the government to fight corruption.................................................................................................... |
16 |
3. PERCEPTIONS OF KEY PROBLEMS............................................................................................................... |
17 |
4. PERCEPTIONS OF CORRUPTION.................................................................................................................. |
18 |
Sources of information on cases of corruption.............................................................................................. |
18 |
Leading causes of corruption......................................................................................................................... |
19 |
Can corruption be justified?.......................................................................................................................... |
20 |
Changes in the level of corruption since 2004............................................................................................... |
21 |
Spread of corruption and the effectiveness of preventative measures......................................................... |
23 |
Overall corruption perceptions index by region............................................................................................ |
26 |
5. CITIZENS’ EXPERIENCES WITH CORRUPTION ........................................................................................... |
27 |
Citizens’ transactions with government agencies and functions................................................................... |
27 |
Extortion, voluntary bribes and use of personal connections (by sector) ..................................................... |
28 |
Corruption by types of bribery ...................................................................................................................... |
29 |
Citizen victimization by corruption................................................................................................................ |
32 |
Overall corruption experience indices by region........................................................................................... |
34 |
Corruption within the healthcare system...................................................................................................... |
37 |
Corruption in schools..................................................................................................................................... |
39 |
Corruption within institutions of higher education....................................................................................... |
40 |
Corruption within the state auto inspection (sai) agency.............................................................................. |
41 |
6. CITIZEN RESPONSES TO CORRUPTION....................................................................................................... |
43 |
Filing complaints and standing up for one’s rights......................................................................................... |
43 |
Effectiveness of anticorruption programs...................................................................................................... |
45 |
Anticorruption measures .............................................................................................................................. |
46 |
3
All MS World ENG.indd 3 |
09.08.2011 23:29:28 |

4
All MS World ENG.indd 4 |
09.08.2011 23:29:28 |
SUMMARY
InMarch–May2011alargescalenationalsurveyofpublicopiniononcorruptioninUkrainewasconductedunder the aegis of the UNITER project financed by the United States Agency for International Development (USAID). The survey was based on the methodology used in 2007–2009, when three surveys were conducted in Ukraine, which were specifically targeted at measuring public perception of the problem of corruption and its experience with it.
The 2007-2009 surveys were of a monitoring nature, therefore their findings enabled to trace the changes in perceptions and experience with corruption in Ukraine over an extended period of time. The baseline survey was conducted at the beginning of 2007 and created the basis for further comparison of the findings of the surveys at the beginning of 2008 and 2009, as well as the latest data obtained in early 2011. All four surveys were conducted by the Kyiv International Institute of Sociology (KIIS): in 2007-2009 under the leadership of Management Systems International (MSI) and in 2011 – in cooperation with the European Research Association and UNITER Project implemented by PACT, Inc. Ukraine.
During 2009-2010 different branches of government, the donor community, non-government organizations and other agencies drafted and partially implemented reforms and different activities aimed at the fight against corruption in Ukraine. In addition to that, many significant political and economic events that are likely to have hadanimpactonpublicperceptionofcorruptionandtrendsofcorruptbehaviorshaveoccurredinUkraineduring this period. In particular, there were several phases of reshuffling of staff in the government. The financial crisis precipitated a halt to economic growth and a decrease in industrial output over the period 2009 – 2010, which resultedinadecreaseinbusinessactivityonthewholeandadropinpeople’sstandardsofliving.Theresultsofthe 2011 survey confirmed the previous years’ findings, sustainability of the perceptions of corruption (in most cases) and reflected certain changes.
Key findings
Perceptions and experience of corruption. A comparative analysis of the survey data between 2007 and 2009 indicates a decrease in the actual corruption experiences, though an increase in the perception that corruption is widespread. In 2011, i.e. almost two years after the last survey, the situation changed slightly: citizens’ perception ofthespreadofcorruptionhasremainedalmostattheleveloftwoyearsago,whilethecorruptionexperiencehas not spread, it has increased in its intensity, which is primarily due to the increase in the number of government bodies where citizens are confronted with open extortion on the part of the bureaucrats.
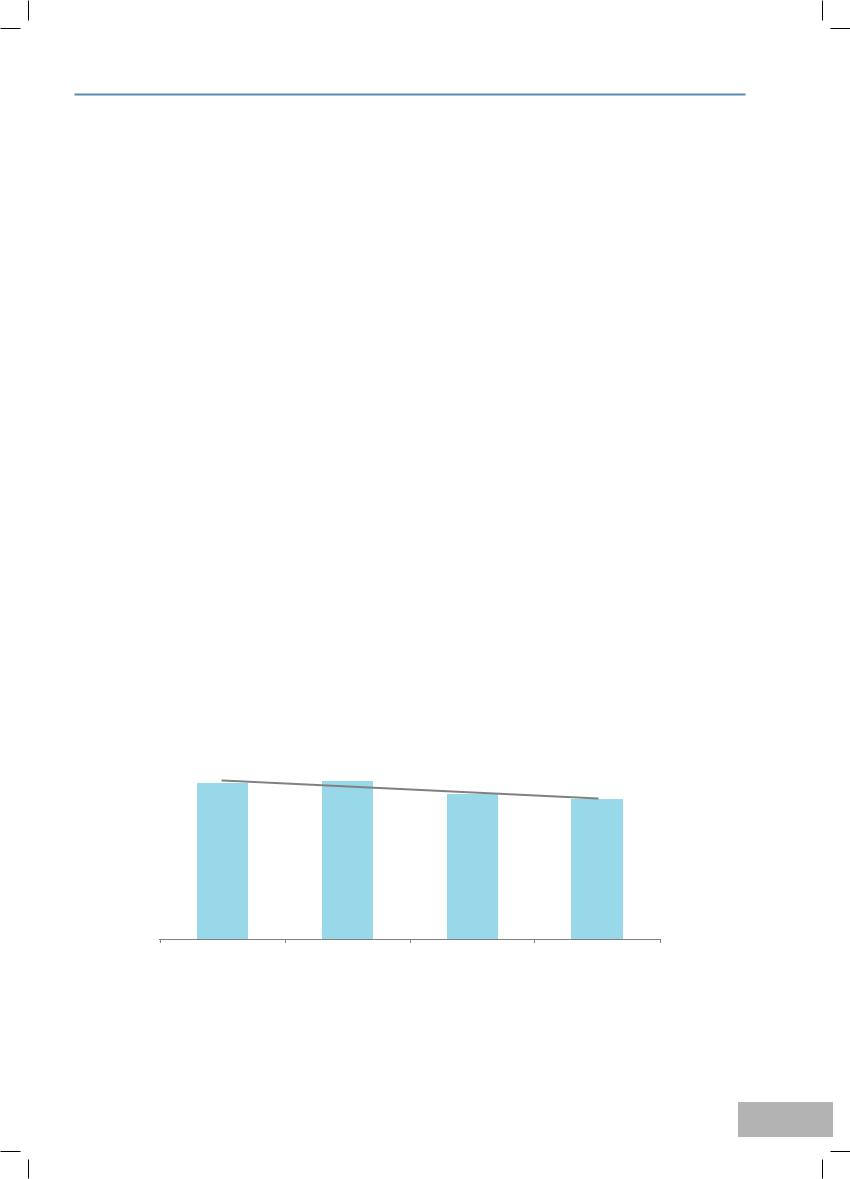
While the overall level of corruption remains extremely high in Ukraine, the 2009 and 2011 surveys show that the level has slightly dropped off. Indeed, in 2011 a total of 60.1% of respondents said they were involved in corrupt transactions with government officials over the past 12 months as compared to 62.5% in 2009 and 67% in 2007.
Involved in Corruption over the Past 12 Months
67,0% |
67,8% |
62,5% |
|
|
|
||
|
|
60,1% |
|
|
|
|
|
2007 |
2008 |
2009 |
2011 |
|
|
N(2007)=10528; N(2008)=1993; N(2009)=10511; N(2011)=10600 |
|
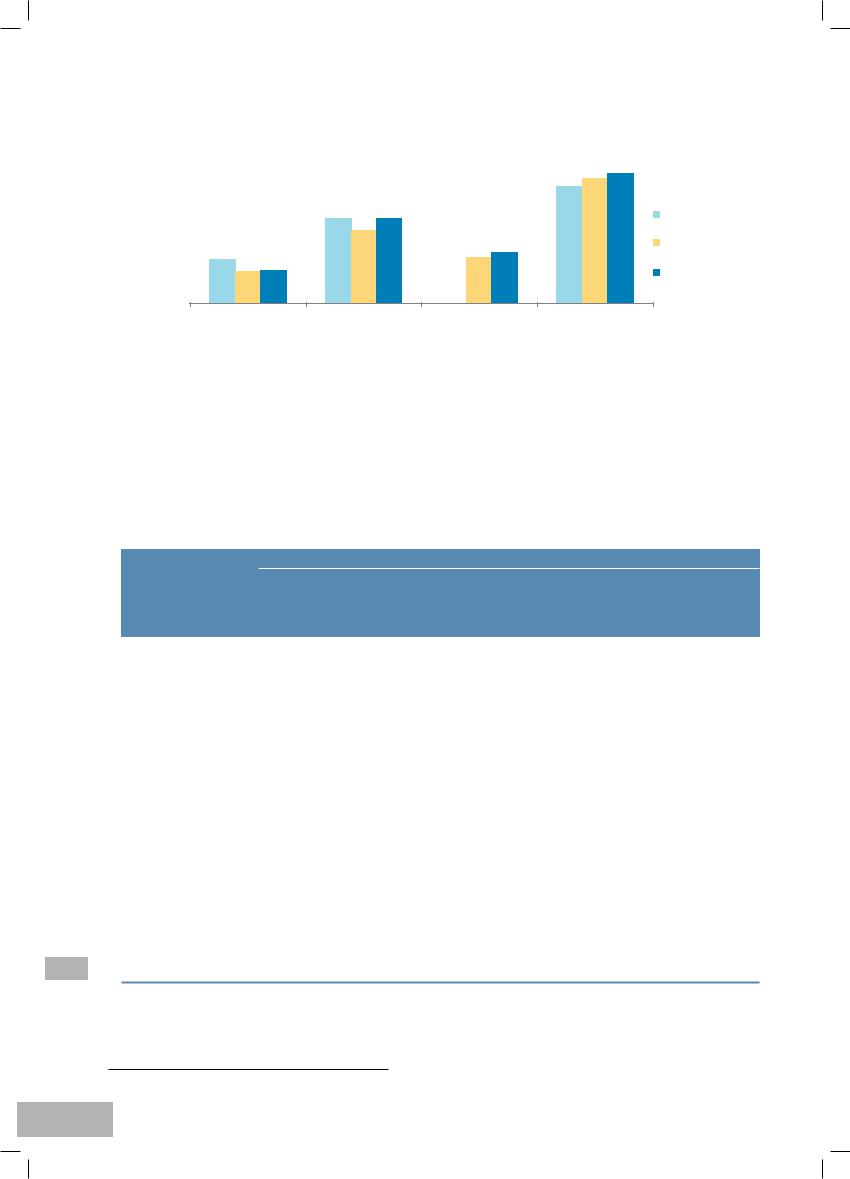
Specific forms of corruption. When looking at the specific forms of corruption that have been encountered, the resultsshowthatextortionhasreturnedtothe2007level(25.8%in2011and25.6%in2007),eventhoughin2009 it declined to 22.1%. Voluntary offering of bribes, after decreasing to 9.9% in 2009 from 13.1% in 2007, remains
5
All MS World ENG.indd 5 |
09.08.2011 23:29:29 |
SUMMARY 6
at the same level of 10.0% in 2011. The use of personal connections has increased from 13.7% in 2009 to 15.3% in 2011. As earlier, there is a variance across government functions – in some of them, corruption transactions increased, while in the others they decreased (for more details see the report).
Corruption Indices for Ukraine: 2007-2011
|
|
|
|
|
|
35,4 38,1 |
39,4 |
|
|
25,6 |
25,8 |
|
|
|
2007 |
|
|
|
22,1 |
|
|
|
|
|
|
|
|
|
|
|
|
13,1 |
10,0 |
|
|
13,7 |
15,3 |
|
2009 |
9,9 |
|
|
|
|
|
2011 |
|
|
|
|
|
|
|
|
|
Voluntary Bribes |
Extortion |
PersonalConnections |
Perceived Spread |
||||
Note: Indices represent mean values for corruption experience and perception across the entire
sample for all sectors and institutions monitored in the survey
Victimization by corruption. Those who experience the most corruption remain the same as in previous years: young people, persons with a higher education and individuals with a higher income. At the same time, citizens fromthesegroupsusuallyarethemostactiveinfightingcorruption.However,onlybyathirdoftheadultpopulation of Ukraine declared their readiness to actively fight corruption.
Basic corruption trends observed in Ukrainian society as a whole also extend to the spheres that the Ukrainian government defined in 2006 as requiring the most significant anti-corruption measures (see table below).1
|
|
CORRUPTION INDICES |
|
|
||
Sphere |
Perceptions of |
Extortion |
Experience using |
Cases of |
||
Widespread |
Personal |
Voluntary |
||||
|
Experience |
|||||
|
Corruption |
Connections |
Bribery |
|||
|
|
|||||
Business regulation |
29,3% 34,0% |
35,4% 40,2% |
25,2% 24,9% |
19,9% |
14,5% |
|
and inspection |
||||||
|
|
|
|
|
||
Courts |
59,3% 60,3% |
31,8% 30,2% |
17,7% 21,2% |
8,6% 10,7% |
||
|
|
|
|
|
|
|
Customs |
38,6% 42,1% |
29,5% 36,1% |
14,0% 10,0% |
16,6% |
10,7% |
|
|
|
|
|
|
|
|
Government |
42,2% 42,1% |
40,1% 47,1% |
25,9% 30,3% |
14,8% |
16,1% |
|
permits |
||||||
|
|
|
|
|
|
|
Land privatization |
47,1% 45,9% |
25,3% 32,0% |
18,7% 18,4% |
7,1% 9,9% |
||
and ownership |
||||||
|
|
|
|
|
|
|
Registration or |
|
|
|
|
|
|
privatization of real |
35,4% 33,5% |
22,6% 32,2% |
17,1% 22,0% |
8,8% 11,6% |
||
estate |
|
|
|
|
|
|
|
|
|
|
|
|
|
State notaries |
26,2% 26,8% |
12,7% 11,1% |
11,5% 11,1% |
5,1% |
6,7% |
|
|
|
|
|
|
|
|
Universities |
49,0% 47,1% |
43,8% 49,7% |
26,9% 20,5% |
27,3% |
25,5% |
|
.
Note: Symbol denotes a negative trend (increase in corruption); symbol denotes a positive trend (decrease in corruption); and no symbols - no change in 2011 compared to 2009
1 It was in these spheres that the MCC Threshold Program initiated its major activities in 2007-2009.
All MS World ENG.indd 6 |
09.08.2011 23:29:29 |

As perceived by citizens, in 2011 compared to 2009 increase in corruption was observed in the sphere of business regulations, tax inspections and customs procedures, while its level was lower in universities and real estate transactions. However, respondents believe that actual cases of corruption slightly differ. The use of personal connections and voluntary bribe-giving is negligible, while a decrease in the level of extortion in any of the aforementioned sectors was not observed. In fact, half of the respondents point to a rise in the level of extortion.
Based on the findings of the 2001 survey corruption trends are as follows:
1.Attitudes toward the government
1.1.The changes that took place in the central executive bodies and at the political Olympus as a result of the 2010 presidential elections were viewed by Ukrainians as a prospect of changes promised in the election campaign. This expectation is reflected in the increase in trust to the key bodies of power, which could be calleda“creditoftrust”,withthemostevidentincreaseoftrustinthePresident(from4.7%in2009to14% in 2011). As earlier, the highest level of public trust is in local authorities at the rural level (20.1%).
1.2.No more than 17% of the population believes in the desire of government authorities to fight corruption. However, the share of respondents that would like to believe so saw a considerable increase after it had sharply dropped in 2009. 16.8% of respondents are convinced that the President is demonstrating a strong desire to overcome corruption. And though the belief in the desire of other government bodies to overcome corruption slightly increased, it still remains extremely low.
1.3.Citizens continue to depend on the President to take on a leadership role in the fight against corruption (77.6% of respondents), and this indicator is on the rise together with an increase of trust in this institution of power and the hope in the president’s desire to truly fight corruption. According to onethird of respondents, the Cabinet of Ministers, the law enforcement bodies and the Prosecutor General’s
Office have approximately the same responsibility for fighting corruption. No more than 18% respondents perceive the fight against corruption as the responsibility and duty of average citizens.
1.4.Citizens’ views of these problems, a list of which was provided in the questionnaire, are undoubtedly highly important and relevant, with corruption among government authorities traditionally ranked in the topfour.Asfoundintheprevioussurveys,94.9%oftherespondentsbelievethemainprobleminUkraine is low standards of living, while 93.5% responded that the high costs and low quality of healthcare are a major problem. The only problem that citizens see as having become more urgent over the past two years is the unjustified correlation in the cost and quality of public utilities precipitated by a considerable increase in tariffs for such services.
2.Changes in the perception of corruption
2.1.Electronicmassmediaremainsthemainsourceofinformationregardingcorruption.30.4%ofrespondents receive this information through television and radio. Print media outlets continue losing their positions, which is accompanied by the increasing number of Internet users. According to the respondents, the mass media’slevelofobjectivityregardingcorruptionhasincreasedfrom32%to37.5%.Informalcommunication also remains a significant source of information on corruption (25.4%).
2.2.Ukrainianviewsaboutthemainreasonsforcorruptionarequiteentrenched.Asearlier,themostsignificant reasons are abuse of power by officials, the absence of proper government control, the absence of the political will to reduce corruption and confusing legislation.
2.3.Although the population’s customary approach to settling problems through corruption is often referred to as the main engine of corruption, over time the number of those believing that corruption is in no way justifiable, even if it is the quickest way settling important matters, slightly increased to 41.2% from 36.9% in 2009. Moreover, the number of those willing to use dishonest schemes any time and at any cost is in decline. It should be noted that the share of respondents that view corruption as unacceptable is unfailingly growing with the age of respondents/ In 2011, the share of such respondents increased in every age category.
2.4.SupportersofthePartyofRegionsandthepoliticalforcethatsupportstheSpeakeroftheVerkhovnaRada are inclined to believe the current level of corruption in Ukraine is lower than it was before the Orange Revolution, while over 60% of the supporters of the “orange” forces are convinced that compared to 2004 the level of corruption has increased.
2.5.Afteranotableincreaseincitizens’perceptionsofcorruptionwidelyobservedin2009,thelevelofperception
SUMMARY 7
All MS World ENG.indd 7 |
09.08.2011 23:29:29 |

SUMMARY 8
haspracticallyreturnedthelevelin2007inallgovernmentbodiessurveyed.Asearlier,Ukrainiansfeelthat themostcorruptbodiesofgovernmentaretheVerkhovnaRada,whiletheperceptionofcorruptioninside the Presidential Administration has decreased more than that inside the Cabinet of Ministers. As regards specific institutions and sectors, Ukrainian citizens are convinced that the most corrupt officials work for the State Auto Inspection (SAI) (64%), the judicial system (60%), the medical/healthcare system (60%) and the militsiya (police -59%).
2.6.Ukrainiansperceivecorruptionatapproximatelythesamelevelasitwasin2009.ThecumulativeCorruption Perception Index increased from 38.1% in 2009 to 39.4% in 2011.
3.Changes in experiences of corruption
3.1.The share of respondents who had personal experience with various forms of corruption over the past year has decreased from 62.5% to 60.1% since 2009.
3.2.Astatisticallysignificantdecreaseinthelevelofextortionwasnotobservedinanysector.Onthecontrary, a considerable increase in extortion practices was observed in such public services as registration or privatization of real estate (from 22.6% to 32.2%), the State Auto Inspection (from 39.7% to 45.1%), tax authorities(from19.6%to28.7%),themilitsiya(from46.1%to53.1%),etc.Findingsofthe2011surveyshow that most frequently bribes are indirectly demanded in the following areas: state healthcare institutions (66%),secondarylearninginstitutions(61%),themilitsiya(53%)andinstitutionsofhighereducation(50%), obtaining various government permits (47%), the State Auto Inspection (45%) and agencies that regulate entrepreneurial activities (40%).
3.3.The last two years show a certain decline in the frequency of voluntary bribery, but we can only assume what has caused it to a greater extent –enhanced public consciousness or the economic crisis. Most often bribesareproposedtothoseworkinginsecondarylearninginstitutions(62%),thestatehealthcaresystem (36%) and the SAI (30%). In spite of a general decrease in voluntary bribe-giving, a statistically significant improvementwasobservedinonlyonesector–publicutilities(from11.1%to7.5%).Conversely,problems of bribery have been observed in government subsidized housing (from 16% to 29.5%), applying for a job with state institutions (from 10.4% to 15.3%), registering ownership of land (from 7.1% to 9.9%) and real estate (from 8.8% to 11.6%).
3.4.The use of personal connections as a “soft” form of corruption is somewhere between extortion and voluntarybribe-giving.Theonlysectorinwhichtheuseofpersonaltieshasconsiderablydeclinedoverthe lasttwoyearsishighereducation,whichcanbeindirectprooftheintroductionoftheExternalIndependent Testingsystem.Ontheotherhand,therehasbeenanincreaseintheuseofpersonaltieswhenregistering or privatizing real estate, dealing with the militsiya and customs officials and applying for a job with state institutions.
3.5.Extortionis2.5timesmorefrequentthanthevoluntaryofferofbribes.Thisratiohasincreasedconsiderably since 2009 when it was 2:1. Citizens typically experience extortion in one of every four transactions with officials, but engage in voluntary bribe-giving only 10% of the time. Ukrainians use personal ties more often than voluntary offering bribes – about 15% of the time.
3.6.Young people and citizens with a higher education and higher income experience greater extortion and theyaccountforthemajorityofcaseofvoluntarilyofferingbribes. Conversely,alowerlevelofextortion is observed only in the senior age group, which is in the low-income group of pensioners.
4.Changes in experiences of corruption in three sectors
4.1.Corruption within the healthcare system:
•Healthcareinstitutionsaregreatestindemandwithalmosttwo-thirdsofthepopulationvisitingthemover a period of one year.
•Overtheyearsofmonitoring,briberywithinthehealthcaresystemhasgonepracticallyunchanged:almost halfofailingcitizensmustprovidetheirownmedicationsandinstrumentswhenadmittedbyadoctor,while 26% feel it as their obligation even when they are not forced to do so. More than a half of patients (52%) were forced to make monetary contributions to hospital funds, while 16% of patients did so voluntarily. One third of patients were immediately asked to make unofficial payments for services rendered, while 15% of patients voluntarily offered such payments to medical personnel.
•Ukrainian citizens continue tofeelsympathyforstaff in thehealthcaresectorunderstanding perfectlywell
All MS World ENG.indd 8 |
09.08.2011 23:29:30 |

that there is practically no alternative to corruption. They believe that allocation of additional budgetary funds to the healthcare sector and raising the salaries of its employees will help curb bribery and fraud.
4.2. Corruption in schools:
•Of the 22% of respondents who have school-aged children, a significant share is enticed into engaging in various forms of corrupt activities (61.1% were extorted bribes and 61.6% voluntarily offered bribes).
•Over the last two years, the spread of corrupt practices in this sector has not changed. The main forms of corruptactionsaremonetarydonationstoschoolorclassfunds(55%),payingforclassroomrepairs(56%), and donating money for flowers and gifts for teachers (33%). The last form of contribution is more often voluntarilyprovidedattheparents’initiative(51%).Thereisaslightincreaseinthenumberofparentsthat offer bribes to ensure that their children are admitted to a selected school, are given higher grades and those that forced to hire the additional services of private tutors in schools.
•As for the medical sphere, the respondents believe that curbing corruption in the schools should be accomplished through allocating more funds for education from the state budget. At the same time, the share of those willing to pay such money to teachers instead of financing the sector as a whole is on the rise.
4.3. Corruption in the SAI:
•The situation with bribery within the SAI remains complicated, though relatively unchanged over this last period. The most widespread form of corruption during transactions with SAI workers is still unofficial payments for violating traffic rules. The share of drivers extorted by inspectors has increased from 35% in 2009 to 42%, while the share of those who initiate bribes themselves has decreased from 23% to 21%. Another reason for increased instances of bribery in the SAI is technical inspections of vehicles: 25.2% in 2011 versus 19% in 2009.
•In contrast to healthcare and schools, Ukrainians do not often sympathize with SAI employees. They recommend stricter punishment for corruption and abuse of power as the best way to fight bribery.
5.Responses to corruption
5.1. Only 4% of victims of corruption admitted that they tried to defend their rights. The main reason for not filing complaints against an official remains the belief that such actions will be futile.
5.2. The share of respondents indicating that they are ready to stand up for their rights is about a third of the population: 33% in 2007, 36% in 2009 and 34% in 2011. As earlier, males, young people, citizens with a higher education and higher incomes make up the most active group of citizens willing to defend their rights. This group also experiences the highest number of cases of corruption.
5.3. For the first time the initiatives of incumbent authorities, in particular, those under the current president) are declared more often than corruption is exposed in the mass media: 33% of respondents are aware of the anti-corruption activities of the president as compared to 30% of respondents who discovered information about cases of corruption in the mass media. Moreover, the respondents are convinced that the effectiveness of the president’s anti-corruption programs has increased. It should also be emphasized that while no more than 17.6% of respondents consider any anti-corruption measures in Ukraine to be effective, it should be stressed that this percentage was derived from the number of the citizens that are aware of such programs.
5.4. Thesurveyfindingsshowthatthenotionofintensifyingstrictmeasuresagainstcorruptofficialsisbecoming less popular among Ukrainians. At the same time, such less radical and more progressive measures of modifyingandimprovinglegislationand,whatismoreimportant,enhancingthelevelofpublicawareness andintroducingpubliccontrolaregaininginpopularity.Inspiteofthis,Ukrainiancitizenscontinuetoinsist on the need to strip the Verkhovna Rada deputies of their immunity status and consider the equality of all before the law a prerequisite to effective implementation of any anti-corruption efforts.
SUMMARY 9
All MS World ENG.indd 9 |
09.08.2011 23:29:30 |

I. INTRODUCTION
In 2007 – 2009, three series of public opinion surveys entitled Corruption in Ukraine were was conducted as a part of the project Promoting Active Citizen Engagement in Fighting Corruption in Ukraine (ACTION) with the aim of increasing public involvement in fighting corruption in Ukraine. To complement the corruption monitoring, another large scale public opinion survey was conducted in 2011. This report presents the comparative results of identical corruption surveys conducted in 2007 – 2009 and 2011 to monitor trends in corruption perceptions and the experience of Ukrainian citizens.
Four nationwide surveys were conducted by the Kyiv International Institute of Sociology (KIIS) and financed by the United States Agency for International Development (USAID). The baseline survey was conducted in February
- March 2007 (N = 10580) . A mid-term survey was conducted in March – April 2008 (N = 2013) and February – March 2009 (N = 10577). Those three surveys were conducted under the leadership of Management Systems
International (MSI). The last survey was conducted in March – April 2011 (N = 10639) under the leadership of the UNITER project implemented by PACT Inc. Ukraine and in cooperation with the European Research Association
(ERA).
In most cases, the analysis in this report focuses on the comparison of the 2007, 2009 and 2011 surveys, while the large sample size of the three surveys offers a more sound analysis in separate oblasts (provinces) of Ukraine. However, the 2008 mid-term survey results are included when they offer additional insight or reveal interesting dynamics.
Survey methodology
All four surveys collected quantitative information on the following issues:
•Attitudes of the adult population in Ukraine towards the problem of corruption;
•Citizen experiences with corruption;
•Citizen assessments of the effectiveness of anti-corruption measures taken by authorities and other anticorruption activists;
•The public’s willingness to engage in anti-corruption activities.
The sample developed for each of the four surveys is representative of the adult population of Ukraine (18 years and older) as a whole and separate regions. Data from the 2007, 2009 and 2011 surveys are also representative of each oblast of Ukraine, including the Autonomous Republic of Crimea and the city of Kyiv. The methodology developedamultistageprobabilitysamplewithquotaselectionatthefinalstage.Duringthefirststageofsampling, randomsettlementswereselectedwithineveryoblastandtheARofCrimeaproportionaltotheirpopulations.The second stage used random selection of postal districts within the selected settlements. In these postal districts randomstreets,buildings,andapartmentswereselected.Thefinalstageconsistedofrespondentselectionwithin a household. The data obtained was compared to that of the 2001 All-Ukrainian Population Census.
Table 1.1 presents the basics characteristics of all four surveys
|
|
|
|
Table 1.1 |
|
|
Basic Survey Characteristics |
|
|
||
|
Baseline survey |
Mid-term |
Mid-term |
Final survey |
|
|
survey |
survey |
|||
|
(2007) |
(2011) |
|||
|
(2008) |
(2009) |
|||
|
|
|
|||
Field interviews |
21 February – |
26 March – |
19 February – |
18 March — |
|
21 March |
9 April |
24 March |
26 April |
||
|
|||||
|
|
|
|
|
|
Sample size |
10 580 |
2 013 |
10 577 |
10 639 |
|
|
|
|
|
|
|
Margin of error (for |
1,0% |
2,2% |
1,0% |
1,0% |
|
Ukraine as a whole) |
|||||
|
|
|
|
||
2Management Systems International (2007) Corruption in Ukraine: 2007 Baseline National Survey for the MCC Threshold Country Program. Kyiv: MSI
10
All MS World ENG.indd 10 |
09.08.2011 23:29:30 |