

4.1.5. Double-layer capacitance of carbon materials
It is usually anticipated that the capacitance of a porous car- bon (expressed in F g−1 ) will be proportional to its available surface-area (in m2 g−1 ). Whilst this relationship is sometimes
observed [44,71], in practice it usually represents an over- simplification [30,72,73]. The major factors that contribute to what is often a complex (non-linear) relationship are: (i) assump- tions in the measurement of electrode surface-area; (ii) variations in the specific capacitance of carbons with differing morphol- ogy; (iii) variations in surface chemistry (e.g., wettability and pseudocapacitive contributions discussed above); (iv) variations in the conditions under which carbon capacitance is measured.
The surface areas of porous carbons and electrodes are most commonly measured by gas adsorption (usually nitrogen at
77 K) and use bet theory to convert adsorption data into an esti-
mate of apparent surface-area. Despite its widespread use, the application of this approach to highly porous (particularly micro- porous) and heterogeneous materials has some limitations [74], and is perhaps more appropriately used as a semi-quantitative tool. Possibly the greatest constraint in attempting to correlate capacitance with BET surface-area, is the assumption that the surface-area accessed by nitrogen gas is similar to the surface accessed by the electrolyte during the measurement of capac- itance. While gas adsorption can be expected to penetrate the majority of open pores down to a size that approaches the molec- ular size of the adsorbate, electrolyte accessibility will be more sensitive to variations in carbon structure and surface proper- ties [75]. Electrolyte penetration into fine pores, particularly by larger organic electrolytes, is expected to be more restricted (due to ion sieving effects) and vary considerably with the electrolyte used [76]. Variations in electrolyte–electrode surface interac- tions that arise from differing electrolyte properties (viscosity, dielectric constant, dipole moment) will also influence wettabil- ity and, hence, electrolyte penetration into pores.
The specific double-layer capacitance (expressed per unit of
BET area, in F cm−2 ) of a range of carbon materials is listed
in Table 5. The reported values vary considerably and appear to be highly dependent on carbon morphology. Most notably, the double-layer capacitance of the edge orientation of graphite is reported to be an order of magnitude higher than that of the basal layer [61,77]. One determinant of specific double-layer capacitance could therefore be the relative density of edge and basal plane graphitic structures in carbon materials. Carbons with a higher percentage of edge orientations (i.e., high Lc /La ratio) could be expected to exhibit a higher capacitance.
The low capacitance recorded when the basal layer of graphite is exposed to solution has been examined in detail by Randin and Yeager [78,79]. By treating basal plane carbon as a semi-conductor, they were able to show that there is a dis- tribution of charge carrier concentration (charge density) that gives rise to a semi-conducting space-charge region on the car- bon side of the interface. This means that some of the applied potential extends into the carbon and a space-charge capacitance (Csc ) develops. This capacitance is in series with other capac-
Table 5
Typical values for electrochemical double-layer capacitance of carbonaceous materials [5]
Carbonaceous material Electrolyte Double-layer capacitance ( F cm−2 )a Remarks
Activated carbon 10% NaCl 19 Surface-area 1200 m2 g−1
Carbon black 1 M H2 SO4 8 Surface-area 80–230 m2 g−1
31 wt.% KOH 10
Carbon fiber cloth 0.51 M Et4 NBF4 in propylene carbonate 6.9 Surface-area 1630 m2 g−1
Graphite
Basal plane 0.9 N NaF 3 Highly oriented pyrolytic graphite
Edge plane 0.9 N NaF 50–70
Graphite powder 10% NaCl 35 Surface-area 4 m2 g−1
Graphite cloth 0.168 N NaCl 10.7 Surface-area 630 m2 g−1
Glassy carbon 0.9 N NaF ∼13 Solid
Carbon aerogel 4 M KOH 23 Surface-area 650 m2 g−1
a Values based on estimates. For a comprehensive discussion see Ref. [48].
itive components of the double-layer, namely, the Helmholtz (CH ) and diffuse (Cdiff ) double-layer contributions. In effect, the stored charge, at a given potential, is spread over an addi- tional dielectric element. The capacitance of the electrode (C) is then represented as
1 1 1 1
(5)
C = Csc + CH + Cdiff
For the semi-conducting basal graphite layer, the space- charge capacitance is significantly less than Cdiff and CH, and therefore dominates the overall interface capacitance. In fact, Randin and Yeager’s calculations show that at the point of zero charge essentially all of the potential is associated with the space-charge region within the carbon electrode. By con- trast, the edge orientation of graphite has a higher charge carrier density since its conductivity is more like that of a metal. The space-charge capacitance is correspondingly greater so that the overall interface capacitance is now dominated by Cdiff and CH .
The original work by Randin and Yeager was later re-
examined by Gerischer [80], this time treating carbon as a metal and applying density-of-states arguments. While this treat- ment produced similar capacitance results to the earlier work, it also allowed Ko¨ tz and Hahn [81,82] to explain some of the behaviour of carbon in greater detail. In particular, these authors noted that the magnitude of both the capacitance and the conductivity can be directly related to the density of elec- tronic states. Further, this treatment also provides an expla- nation for the observation that capacitance and conductivity both vary strongly with potential and exhibit minima close to the potential of zero charge (pzc). Central to this behaviour is the conclusion that both properties are essentially limited by the number of available charge carriers within the carbon space-charge region. This limitation is alleviated at potentials either side of the pzc because charging of the carbon elec- trode increases the numbers of available charge carriers. The authors also indicate that these relationships have important ramifications for the future development of carbon-based super- capacitor electrodes. For example, as carbons are activated to greater degrees, the pore walls become thinner. As a result, the effective thickness of the electrode material becomes similar to the dimensions of the space-charge region (defined by the Fermi length, and approximately equivalent to one graphene layer). In this situation, space-charge regions begin to overlap and less capacitance is generated per unit electrode area. This explanation is consistent with the smaller than expected capaci- tance often observed for highly activated carbon materials with extremely large surface areas (and correspondingly thinner pore walls) [81,83].
The measurement of carbon capacitance is also very depen- dent on the experimental conditions employed. For example, Fig. 5 demonstrates that the capacitance values measured for a range of porous carbons can vary substantially with dis- charge current [84]. The capacitance of microporous carbons are particularly affected by variations in discharge current due to the greater possibility of restricted electrolyte diffusion in narrower pores. Ideally, reported capacitance values of carbon
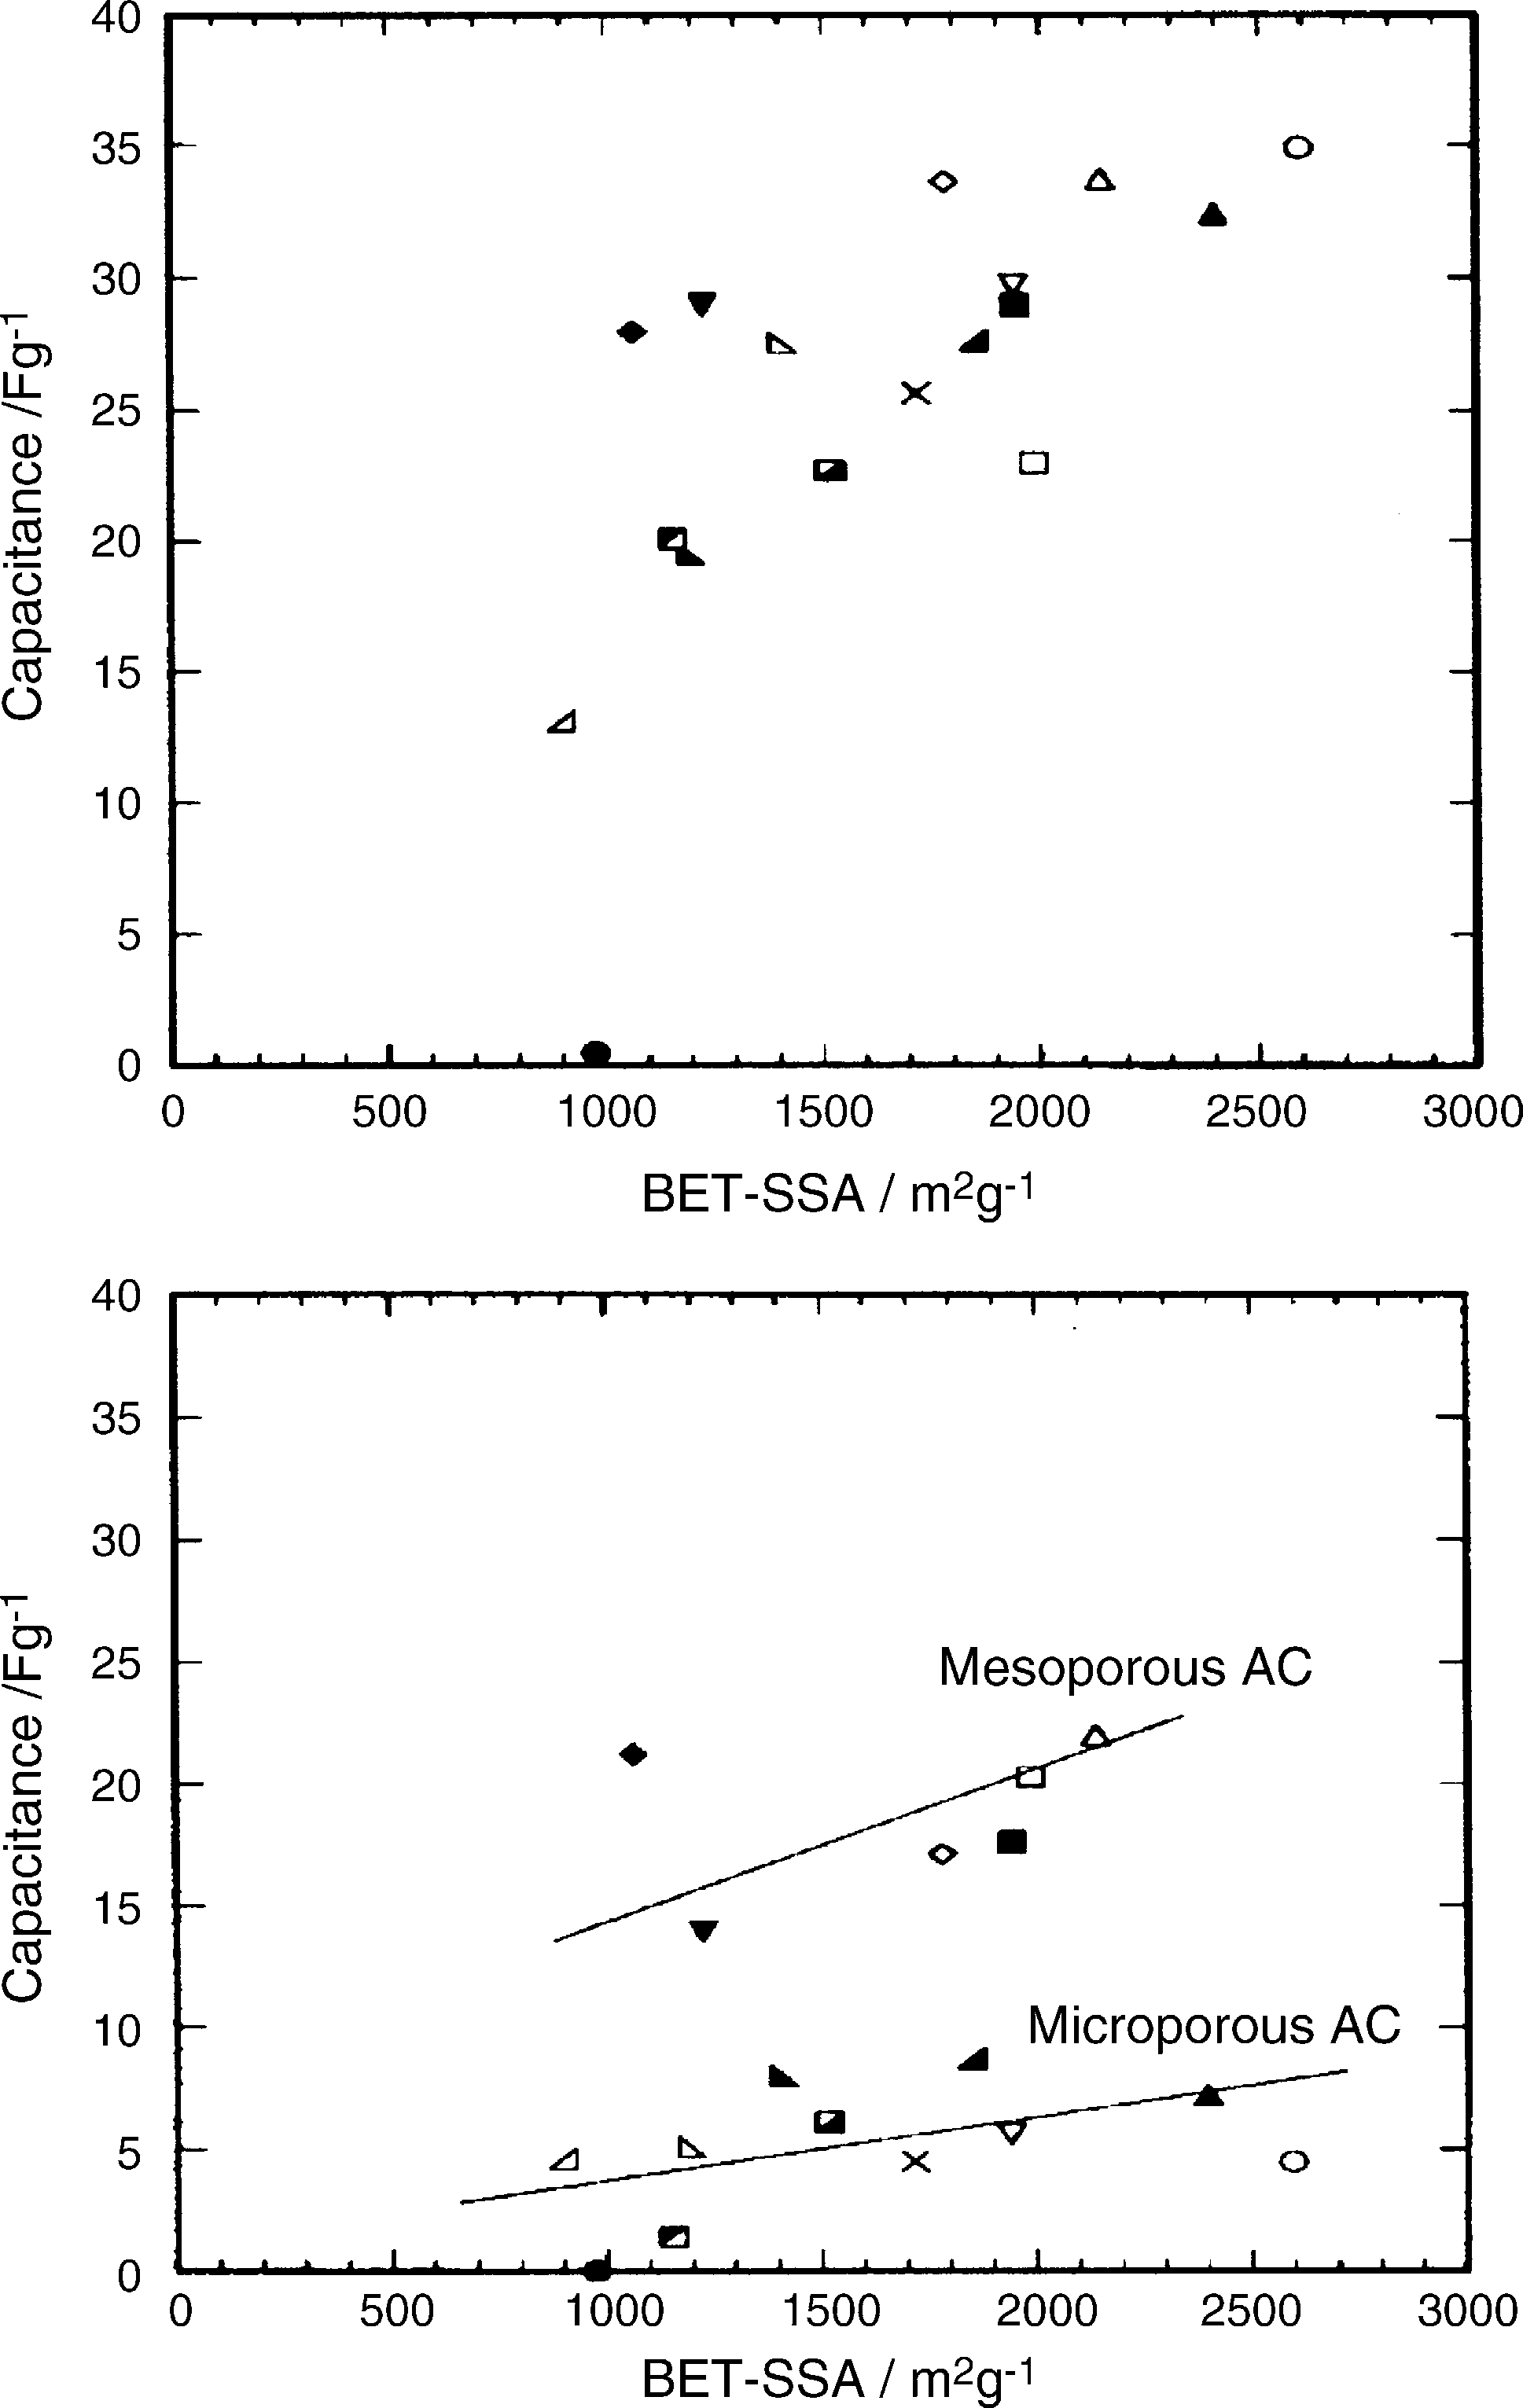
electrodes, particularly when used for comparative purposes, should be measured and compared at a fixed current den- sity.