


STRONGLY COUPLED DUSTY PLASMAS AND PHASE TRANSITIONS 447
it is not separately dependent on κ. Moreover, if the dissipation is su ciently high, θ > θcr, then the ratio DL/D0 becomes practically independent of θ as well. On the other hand, for θ θcr, numerical results tend towards those obtained for nondissipative systems by Ohta and Hamaguchi (2000a). In the intermediate case, the ratio DL/D0 depends on θ, as indicated above. The phenomenological expression describing this dependence was proposed by Vaulina and Vladimirov (2002), and it has the form
D |
L |
|
θγ exp( |
3γ /γ ) |
|
|
|
= |
− |
M |
. |
(11.78) |
|
|
|
|
|
|||
D0 |
6(1 + 2πθ) |
|
||||
This phenomenological expression demonstrates reasonable agreement with numerical data for γ 30, as follows from Fig. 11.9. Using this expression we can also submit an estimate: θcr 1/2π ≈ 0.2. Finally, the dynamic criterion of crystallization, requiring that DL/D0 ≈ 0.1 in the liquid phase near the crystallization curve, turns out to be applicable to strongly dissipative systems, but is not confirmed for weakly dissipative systems (θ θcr).
The above–described results can, in principle, be used for dusty plasma diagnostics. However, the direct application of the results of 3D modeling of Debye– H¨uckel systems to the analysis of experiments on dusty plasmas under microgravity conditions and of laboratory experiments with fine powders is largely limited for a number of reasons (e.g., plasma anisotropy, long–range interactions including shadowing e ects, the e ect of external forces and/or boundary conditions, particle charge variations, etc.).
11.3.2Experimental investigation of phase transitions in dusty plasmas
11.3.2.1 Dusty plasma crystals in an r.f. discharge. Since the discovery of dusty plasma crystals in 1994, the investigation of phase transitions in di erent types of dusty plasmas has been actively performed in dozens of laboratories. Phase transitions in the dust component are studied in capacitive and inductive discharges, glow d.c. discharge, thermal plasmas of combustion products of di erent fuels, as well as nuclear– and photo–induced plasmas. Below in this section we will discuss those experiments in which strong coupling of the dust component, leading to phase transitions to ordered states, is revealed in the most striking way.
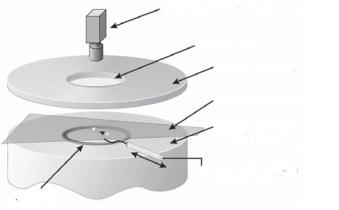
Dusty plasma crystals were discovered in a capacitively coupled low–pressure r.f. discharge in inert gases almost simultaneously in several laboratories (Chu and I 1994; Thomas et al. 1994; Hayashi and Tachibana 1994; Melzer et al. 1994). The schematic of a typical experimental setup is shown in Fig. 11.10. The experimental apparatus includes a lower electrode 5–10 cm in diameter capacitively coupled to an r.f. generator (f = 13.56 MHz) and an upper grounded electrode. The electrodes are placed into a vacuum chamber. Micron-sized dust particles fill a container and can be introduced into the discharge through a metallic grid. The electrode separation is typically 3–10 cm. The particle visualization is performed with the use of laser illumination. The laser beam is transformed into a
448 |
DUSTY PLASMAS |
CCD video camera
Glass window
Grounded electrode
Sheet of laser light
RF electrode
Probe for
Up excitation
Copper ring
Fig. 11.10. Schematic of experimental setup used to investigate the formation of ordered
structures in an r.f. discharge.
sheet approximately 100 m thick using a lens and illuminates the particles in the horizontal or vertical plane. The particles introduced into the plasma become (highly) charged negatively and levitate in the sheath above the lower electrode, which, on the average, acts as a cathode over a period of applied r.f. voltage. To confine the particles horizontally, a metallic ring with an inner diameter of 3–6 cm and a height of 1–3 mm is placed on the lower electrode. Sometimes, instead of a ring, a special curved electrode is used. The light scattered by the particles is recorded by a video camera.
Dust particles (of not too large a size) usually levitate in the sheath above the lower electrode due to the balance of the main forces, which include the electrostatic force (directed upwards for a negatively charged particle), the force of gravity (directed downwards), and the ion drag force (also directed downwards
– in the direction of the time–averaged electric field). Under certain conditions, the particles form an ordered structure consisting of several fairly extended horizontal layers. The number of particles in such a structure can reach 103−105, while the number of layers can vary from one to a few dozen (Zuzic et al. 2000). Figure 11.1a illustrates an image of the horizontal cross–section of the ordered structure (fragment of one layer) consisting of monodispersed polymer (ρ = 1.5 g cm−3) particles 6.9 m in diameter (Morfill and Thomas 1996). The structure displayed is highly ordered and exhibits a hexagonal lattice. The particles are usually settled strictly below each other in di erent horizontal layers, forming a cubic lattice between layers. Such an arrangement can be a consequence of ion focusing downstream from the particles – the wake e ect.
It is di cult to obtain real three–dimensional structures in ground–based experiments in r.f. discharges. In these conditions, dusty plasma crystals have substantially a two–dimensional, or more exactly so–called 2 12 –dimensional, character. This is directly connected to the action of gravity. To support particles

STRONGLY COUPLED DUSTY PLASMAS AND PHASE TRANSITIONS 449
against gravity, strong electric fields are required. Such strong fields can be established only in plasma sheaths which are characterized by a high degree of anisotropy and suprathermal (or even supersonic) ion flows. External forces acting on the dust particles are comparable to the interparticle forces. Hence, the dust systems are strongly compressed, inhomogeneous, and anisotropic in the vertical direction. In these conditions, comparison with theoretical results obtained for 3D Debye–H¨uckel systems is incorrect.
For reference, we summarize typical plasma and particle parameters in these experiments. Particle diameters usually lie in the range from 1 to 30 m. The neutral (typically inert) gas pressure ranges from 0.01 to 1 torr. Plasma concentration in the bulk of a discharge is ne ni 108 −1010 cm−3, the electron temperature is Te 1−5 eV, and ions are typically assumed to be in equilibrium with neutrals (usually at room temperature), so that Ti Tn 0.03 eV. Let us also emphasize some properties of sheaths where the particles levitate. The sheath is a region of a positive space charge, so that the ion concentration exceeds that of electrons even in the absence of dust. The ion velocity at the edge
of the collisionless sheath satisfies the Bohm criterion u ≥ ci = Te/mi. For the collisional sheath, the ion directed velocity can be lower than the velocity of sound, but the ions are still typically suprathermal: u vTi . The characteristic spatial scale of the particle charge screening in this case is given by the electron Debye radius λDe, because fast ions do not contribute considerably to screening. Finally, it should be recalled that the potential of interaction between the particles is highly anisotropic. In the direction perpendicular to the ion flow, the interparticle interaction is determined as before by a screened Coulomb potential (with a screening length close to λDe), while in the direction parallel to the flow the e ects caused by ion focusing downstream from the particles become important (see Section 11.2.4).
Structural properties of strongly coupled dusty plasmas were investigated by Chu and I 1994; Thomas et al. (1994); Hayashi and Tachibana (1994); Melzer et al. (1994); Quinn et al. (1996); Hayashi (1999); and Zuzic et al. (2000). Crystalline structures such as bcc, fcc, and hcp, as well as their coexistence, were found for certain plasma and particle parameters. For the quantitative analysis of the ordered structures of particles observed in experiment, it is common to use the following three characteristics (Quinn et al. 1996): the pair correlation function g(r), the bound–orientational correlation function g6(r), and the structure factor S(k). The pair correlation function g(r) represents the probability of finding two particles separated by a distance r. For the case of an ideal crystal, g(r) is a series of δ–functions (peaks) whose positions and heights depend on crystal structure type (for the gas state g(r) ≡ 1). The pair correlation function measures the translational order in the structure of interacting particles. The bound–orientational correlation function for two–dimensional systems is defined in terms of the nearest–neighbor bond angles with respect to an arbitrary axis. For a perfect hexagonal structure g6(r) ≡ 1, while for other phases g6(r) decays with distance. The bond–orientational correlation function measures ori-
450 |
DUSTY PLASMAS |
entational order in the structure. Finally, the static structure factor measures order in the structure, similar to g(r). It is defined as
S(k) = N |
6 i,j |
exp ik · (ri − rj ) |
7, |
1 |
|
+ |
, |
where ri and rj are the positions of particles i and j, and . . . denotes ensemble averaging. Note that the structure factor is connected to the pair correlation function via the Fourier transform (see, e.g., Ichimaru 1982):
+,
S(k) = 1 + nd dr g(r) − 1 exp(−ik · r).
These characteristics are applied for the analysis of static properties of the highly ordered dust particle structure by Quinn et al. (1996). In the same work, a comparison between the obtained quantitative results and predictions of the 2D melting theory developed by Kosterlitz, Thouless, Halperin, Nelson, and Young (KTHNY theory) is drawn.
As already noted in the Introduction, dusty plasmas possess a number of unique properties which make these systems extremely attractive for investigation of di erent collective processes, including phase transitions. In particular, relatively short temporal scales for relaxation and response to external perturbations, as well as simplicity in observation, allow us not only to study static structure characteristics, but also to investigate the dynamics of phase transitions in detail (Thomas and Morfill 1996a,b; Morfill et al. 1999c; Melzer et al. 1996). Usually, phase transitions from crystal–like to liquid–like or gas–like states are experimentally investigated. Melting of a crystalline lattice can be initiated either by a decrease in the neutral gas pressure or by an increase in the discharge power. This can be attributed to the fact that the plasma parameters change under these conditions in such a way that the coupling in the system decreases. The decrease in coupling is first of all connected, at least in experiments with the lowering of the neutral pressure, with a significant increase in the kinetic energy of the dust particles. For example, the initial temperature which was close to the neutral gas temperature (Td Tn 0.03 eV) in highly ordered crystal–like structures increased with the lowering of pressure and structure melting up to5 eV (Thomas and Morfill 1996a) or even 50 eV (Melzer at al. 1996) at minimal pressures examined in these works. This “anomalous heating” of the dust component in plasmas indicates some source of energy which is e ectively transferred into the kinetic energy of the dust particles. Dissipation of the kinetic energy in turn is determined by collisions with neutrals. With a decrease in pressure the dissipation goes down, which leads to the “heating” of the particles. Several possible mechanisms of anomalous heating were considered in the literature: stochastic fluctuation of the particle charge and energy gain in an external electric field (Morfill and Thomas 1996; Vaulina et al. 1999a,b, 2000; Quinn and Goree 2000); heating due to ion focusing and its attendant anisotropy in the
452 |
DUSTY PLASMAS |
The second, the “flow and floe” state, is characterized by the coexistence of islands of ordered crystalline structure (floes) and systematic directed particle motion (flows). In this state, the translational and orientational orders decrease significantly and occasional vertical particle migrations to other lattice planes are possible. Particle thermal motion still corresponds to room temperature, vTd 0.2 mm s−1, while directed flow velocities are typically half of this. The third, the “vibrational” state, is characterized by some increase in orientational order and diminishing flow regions. However, isotropic particle vibrations with increasing amplitudes appear. Kinetic energy and vertical migrations of particles increase and the translational order continues to decrease. Finally, in the fourth, the “disordered” state, there is no translational or orientational order. The particles migrate freely both in the horizontal and vertical planes. The particle kinetic energies are hundreds of times greater than the neutral temperature (Td 4.4 eV).
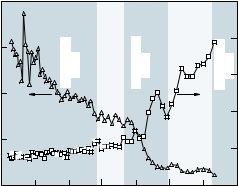
Figure 11.11 shows the quantitative results for correlation functions g(r) and g6(r) during melting. Three regions are shaded: “crystalline”, “disordered” and “vibrational”. In the last region, the correlation function g6(0) characterizing orientational order has a local maximum. The left light–colored region, which corresponds to the monotone decrease in translational order, separates the “disordered” state from the region of local increase in the orientational order in the “vibrational” state.
In concluding, we note once again that, strictly speaking, theoretical concepts of 2D and 3D melting are not applicable to describing these experiments because the systems are essentially 2 12 –dimensional. From this point of view, the experimental investigation of monolayer crystal melting, as well as experiments on phase transitions in 3D systems under microgravity conditions, might be valuable.
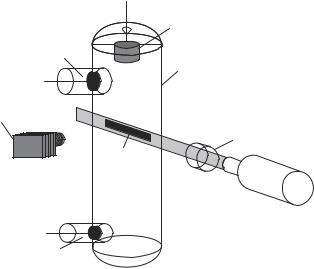
11.3.2.2 Ordered structures of dust particles in a d.c. discharge. A d.c. gas discharge can also be used for the formation of ordered structures in dusty plasmas (Fortov et al. 1996a, 1997a; Lipaev et al. 1997; Nefedov et al. 2000). The sketch of the typical experimental setup is given in Fig. 11.12. A discharge is typically created in a vertically positioned cylindrical tube. The particles introduced into the plasma can levitate in the regions where the external forces are balanced. They are illuminated by laser light and their positions are registered by a video camera. Typical conditions in the discharge are the following: a pressure in the range 0.1–5 torr, and a discharge current of 0.1−10 mA. The ordered structures are usually observed in standing striations of the positive column of the glow discharge but can also be observed in an electric double layer formed in the transition region from the narrow cathode part of the positive column to the wide anode part, or in a specially organized multielectrode system having three or more electrodes at di erent potentials, etc., that is, in the regions where the electric field can be strong enough to levitate the particles. For these regions, some sheath properties considered above in the context of an r.f. discharge (e.g.,
STRONGLY COUPLED DUSTY PLASMAS AND PHASE TRANSITIONS 453
Container with dust particles
Anode
Discharge
tube
CCD video camera
Cylindrical
lenses
Particles
Laser
Cathode
Fig. 11.12. Schematic of the experimental setup for studying the formation of ordered
structures in a d.c. gas discharge.
plasma anisotropy, ion drift) are also relevant.
Most of the experiments were performed in standing striations of glow discharges. In the positive column of a low–pressure discharge, loss of electron energy in elastic collisions is small and the electron distribution function is formed under the action of the electric field and inelastic collisions. This can lead to the appearance of striations – that is, regions of spatial periodicity of the plasma parameters with the characteristic scale of the order of a few centimeters (Golubovskii et al. 1994; Golubovskii and Nisimov 1995, 1996). The electron concentration, their energy distribution, and the electric field are highly nonuniform along the striation length. The electric field is relatively strong (around 10–15 V cm−1 at a maximum) at the head of striation – that is, a region occupying 25–30% of the total striation length, and relatively weak (around 1 V cm−1) outside this region. The maximum value of the electron concentration is shifted relative to the maximum strength of the electric field in the direction of the anode. The electron energy distribution is substantially bimodal, with the head of the striation being dominated by the second maximum whose center lies near the excitation energy of neutral gas atoms. Due to the high floating potential of the walls of the discharge tube, the striations exhibit a substantially two– dimensional character: the center–wall potential di erence at the head of the striation reaches 20–30 V. Thus, an electrostatic trap is formed at the head of each striation, which in the case of vertical orientation is capable of confining particles with high enough charge and low enough mass from falling into the cathode positioned lower, while the strong radial field prevents particle sedimen-
454 |
DUSTY PLASMAS |
|
|
|
|
|
|
|
|
|
|
|
|
|
|
|
|
|
|
|
|
|
|
|
|
|
|
|
|
|
|
|
|
|
|
|
|
|
|
|
|
|
|
|
|
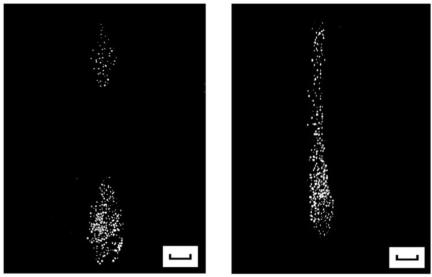
Fig. 11.13. Video images of structures comprising charged microspheres of borosilicate glass: (a) in two neighboring striations (pressure around 0.5 torr, discharge current of 0.5 mA); (b) after their coalescence (pressure around 0.4 torr, discharge current of 0.4 mA). The scale of length in the figure corresponds to 3 mm.
tation on the tube walls.
The process of structure formation proceeds routinely as follows: after being injected into the plasma of the positive column, the charged particles fall past their equilibrium position and then, over the course of several seconds, emerge and form a regular structure which is preserved su ciently long (until the end of the observation) provided that the discharge parameters are unchanged. The simultaneous existence of ordered structures in several neighboring striations can be observed. Figure 11.13a demonstrates an image of two dust structures formed by hollow thin-walled microspheres made of borosilicate glass with a diameter of 50–63 m in two neighboring striations. Figure 11.13b shows their coalescence into one rather extended formation, occurring due to varying the discharge parameters (Lipaev et al. 1997). This figure indicates the possibility of forming structures much more extended in the vertical direction than in r.f. discharges. In fact, the three–dimensional quasicrystalline dusty structures were obtained in the work of Lipaev et al. (1997) for the first time.
In d.c. discharges, the transition of quasicrystalline structures to fluid and gaseous states is also observed, similar to dusty plasma in r.f. discharges. This occurs either by lowering the pressure or increasing the discharge current. For example, for the structure comprising Al2O3 particles of diameter 3–5 m at a pressure of 0.3 torr and a current of 0.4 mA (estimated electron number density
STRONGLY COUPLED DUSTY PLASMAS AND PHASE TRANSITIONS 455
ne = 108 cm−3, and temperature Te 4 eV), the correlation function reveals long–range order with four well-pronounced peaks (Lipaev et al. 1997). When the discharge current is increased by almost one order of magnitude to 3.9 mA (ne = 8 · 108 cm−3), the structure “melts” and the correlation function reveals only short–range order. We note that during this “phase transition” the interparticle distance, equal to 250 m, remains approximately constant.
Similar to dusty crystals in r.f. discharge plasmas, the e ect of “anomalous heating” of particles was observed in d.c. plasmas. Under certain conditions, the particles acquired very high kinetic energies of up to 50 eV (Fortov et al. 1997a). This heating causes dust crystal melting, observed when the plasma parameters are changed.
Under certain discharge conditions, an increase in the number of small-sized particles gives rise to the formation of complex structures where di erent regions coexist (see Fig. 11.1b): the high ordering region (“plasma crystals”), and regions of convective and oscillatory motion of particles (“dusty plasma liquids”). Usually, in the lower part of the structure, the particles oscillate in the vertical direction (dust density waves) at a frequency of 25–30 Hz and a wavelength of about 1 mm, the mean interparticle distance being 200 m. Such self–excited oscillations can correspond to the instability of the dust acoustic wave, the possible mechanisms of which are considered in Section 11.4. Most of the central region of the structure is occupied by a crystal–like structure with a pronounced chain–like configuration. At the periphery of the upper part of the structure, the particles undergo convective motion whose intensity decreases towards the center of the structure. This complex picture is apparently associated with a peculiar distribution of plasma parameters and forces acting on the dust particles within a striation.
11.3.2.3 Ordered structures in a thermal plasma. Thermal plasma constitutes a low–temperature plasma characterized by equal temperatures of the electron, ion, and neutral components. The existence of liquid or solid small–sized particles in such a plasma can significantly a ect its electrophysical properties. E ects associated with the presence of particles were already observed in early experiments focused on studying plasma of hydrocarbon flames (see, e.g., Yakubov and Khrapak 1989).
Experimental investigations of the ordered dust structure formation in a thermal plasma were performed in a quasi–laminar weakly ionized plasma flow at temperatures of 1700–2200 K and atmospheric pressure (Fortov et al. 1996b,d, 1997b,c). A plasma source formed an extended and uniform volume (about 30 cm3) of quasineutral thermal plasma, where the particles of CeO2 were introduced. The main plasma components are the charged particles, electrons, and singly charged Na+ ions. The electron density varies from 109 to 1012 cm−3. The dust particles are charged by background electron and ion fluxes and via thermionic emission. Due to the dominant role of the latter mechanism, the particle charge is positive and equal to 102 −103 elementary charges. Here, in
456 DUSTY PLASMAS
contrast to gas discharges in laboratory conditions, the plasma is isotropic and quite uniform because gravity does not play any important role.
The relatively large volume and uniformity of the plasma allow us to measure gas and particle properties by di erent probe and optical methods to find the characteristic plasma parameters. Di erent probe methods were employed to measure the densities of alkali metal ions and electrons. The gas temperature and the concentration of alkali atoms were measured by the generalized reversal technique and full absorption technique, respectively. In order to determine the mean (Sauter) diameter D32 and the particle concentration nd in the plasma flow, the aperture transparency method was used. The spatial dust structure is analyzed using the pair correlation function g(r) measured with a time–of–flight laser counter. The measurement volume of the counter is formed by focusing an argon laser (λ = 0.488 m) beam in a certain region of the plasma flow. The radiation scattered by individual particles as they traverse the measurement volume is transduced to electric signals by a photodetector. The received signals are then processed in order to calculate the pair correlation function g(r).
The results of measuring spatial dust structures were compared with experimental data obtained for an aerosol flow at room temperature. In the last case, only air with CeO2 particles was injected into the inner region of the burner. Such a system models a plasma with a random (chaotic) spatial distribution of dust particles – a “gaseous plasma”. Comparison of the pair correlation functions for CeO2 particles with diameter D32 ≈ 1.8 m in aerosol flow at temperature Tg ≈ 300 K and in a plasma at temperature Tg = 2170 K and particle concentration nd = 2.0 · 106 cm−3 showed (Nefedov et al. 1997) that they are almost identical. This means that a weakly ordered “gaseous” structure is produced. At a lower temperature Tg = 1700 K and significantly higher particle number density nd = 5.0 · 107 cm−3, the pair correlation function g(r) demonstrates short–range order which is characteristic of a liquid–like structure (Nefedov et al. 1997). In such a plasma, the measurements give for the ion number density ni 109 cm−3, which is about one order of magnitude lower than the electron number density ne 5 · 1010 cm−3. The particle charge evaluated from the quasineutrality condition Zdnd = ne is positive and equals approximately 103 elementary charges with an accuracy of a factor of 2. Then the ratio of the average interparticle separation to the electron Debye length is κ 2, and the modified coupling parameter lies in the range γ 50 −200. These values are close to the crystallization conditions for the isotropic three–dimensional Debye– H¨uckel model. The fact that the structures found in the experiment are relatively weakly ordered is explained by a significant nonstationarity of the system: the time interval between particle injection into the plasma and correlation function measurements is not enough for the ordered structures to form completely. This evidence was supported by MD simulation of the dynamics of the ordered dust– particle structure formation in the conditions of the experiment (Khodataev et al. 1998; Nefedov et al. 1999).
Samaryan et al. (2000) reported experiments on determining the parameters

STRONGLY COUPLED DUSTY PLASMAS AND PHASE TRANSITIONS 457
of a plasma with a condensed disperse phase (CDP) of combustion products of synthetic solid fuels with various compositions. In most of the experiments, the coupling parameter γ was smaller than unity and ordering of CDP particles was absent. The main reason preventing the formation of ordered structures is the existence of a substantial amount of alkali–metal impurities in fuels. This leads to an increase in the degree of plasma ionization and, hence, to a decrease in the plasma screening length (Debye radius). The ordered structures of CDP particles were only observed for samples of aluminum–coated solid fuels with a low content of alkali metals. In this case, the coupling parameter reached values of 10–30, corresponding to structures with a liquid–like order. An analysis of the experimental pair correlation functions revealed a short–range order for su ciently high particle concentrations.
11.3.2.4 Ordered structures in nuclear–induced plasmas. The nuclear–induced plasma is produced by nuclear–reaction products which create ion–electron pairs passing through a medium, as well as excited atoms and molecules in their tracks. In terms of physical characteristics, the nuclear–induced plasma of inert gases di ers significantly from thermal and gas discharge plasmas. At the relatively low intensities of a radioactive source, typical of laboratory conditions, this plasma has a distinct track structure. The tracks are randomly distributed in space.
The experiments were performed in an ionization chamber which is placed in a hermetical transparent cell (Fortov et al. 1999c). Either β–particles (decay products of 141Ce or α-particles and fission fragments (decay products of 252Cf) were used as ionizing particles (Fortov et al. 1999c; Vladimirov et al. 2001a). The energies of reaction products, their free paths in air and dust particle material, as well as the number of secondary electrons emitted in collisions of the ionizing particle with a dust particle, are given in Table 11.1.
In a plasma of atmospheric air at an external electric field strength of 20 V cm−1, the levitating particles form liquid–like structures – the pair correlation function has one maximum. At stronger electric fields, the dust particles move in closed trajectories which form a torus with the axis aligned with that of the cylindrical chamber.
In an inert gas, su ciently dense dust clouds with sharp boundaries exist, and
Table 11.1 Major characteristics of ionizing particles.
|
β–particle |
Average fusion |
α–particle |
|
|
fragment |
|
Average kinetic energy, keV |
138 |
9 · 104 |
6 · 103 |
Total range in solid matter |
|
|
|
(CeO2), m |
58 |
5.5 |
20 |
Total range in air (p = 1 atm), cm |
5.6 |
2.3 |
4.7 |
Number of secondary electrons |
≈ 5 |
≈ 250 |
≈ 10 |
per particle |
DUSTY PLASMAS
|
|
|
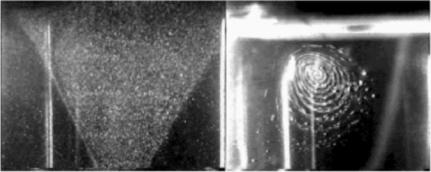
(a) Dust structures of micron–size Zn particles in a nuclear–induced plasma in neon at pressure 0.75 atm and electric field strength 30 V cm−1. (b) Rotating dust structures of micron–size Zn particles in neon; the agglomeration of particles is visible.
the dust particles form a liquid–like structure inside these clouds (Fig. 11.14(a)). In a nonuniform electric field, the particles form a rotating dust structure in which agglomeration of small particles into coarse fragments proceeds in the course of time, Fig. 11.14(b) (Vladimirov et al. 2001b).
In the experiments, particles of Zn and CeO2 were used. The particle radius was estimated experimentally from the particle steady–state falling velocity after the removal of the electric field and was found to be 1.4 m. The electric charge was inferred from the equilibrium condition for slowly moving levitating particles. The particle charge depended on the particle radius and lay in the range from 400 to 1000 elementary charges.
For the theoretical calculation of the charge on a spherical particle in the nuclear–induced plasma, nontraditional approaches are used because this plasma is spatially and temporarily inhomogeneous. The charging process is considered after the track plasma has separated into two clouds: one of electrons, and the other of ions. When the electron or the ion cloud meets a dust particle on its drift to the corresponding electrode, then this particle acquires some charge from the cloud. A statistical treatment of these charging events constitutes the essence of the mathematical model posed for calculating the particle charge. The electron current to the particle is determined by the electron collection cross–section in the collisionless limit. To obtain the ion current, the di usion approximation is used. In the simulation, the code first generates the event of creation, the direction of emission from the source, and the type of ionizing particle (alpha particle or a fission fragment) (Fortov et al. 2001a). The simulation shows that the particle charge fluctuates with time. On the one hand, the dust particle acquires a charge in the electron attachment process; on the other hand, its charge decreases substantially in the less frequent events of interaction with the ions. The contribution from alpha particles leads to a complicated dependence of the charge on time. The characteristic time scale for changing the charge