

THE PRINCIPLE OF SPECTROSCOPIC STABILITY |
313 |
|||||
|
|
|
|
|
|
|
|
|
|
|
|
|
|
|
|
|
|
|
|
|
|
|
|
|
|
|
|
cm
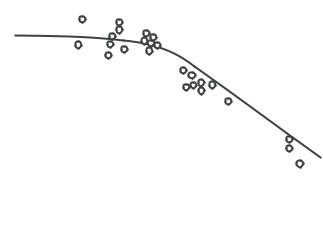
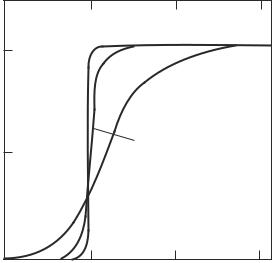
Fig. 8.9. Variation of the e ective partition function of the upper level of 5d − 4p transition in argon (λ = 560 nm): points, experiment of G¨undel (1971); curve, theory of Sevast’yanenko (1985).
n |
n |
= n |
a |
(g |
/Σ ) exp ( E /kT ) , |
|
|
|
n |
|
− n |
||
gn = ωngn, |
|
Σ = |
|
|||
|
ωngn exp (−En/kT ). |
|||||
n
A simple analytic approximation of these integrals was proposed by D’yachkov (1997, 1998). Figure 8.9 illustrates the comparison of the calculation results of Sevast’yanenko (1985) with those of experiments in argon of G¨undel (1971). From the drawing, one can see how important the microfields are. The clearly defined spectral lines lose their intensity. It will be shown below that the intensity of the continuous spectrum adjoining the spectral lines increases accordingly.
8.5The principle of spectroscopic stability
The principle of spectroscopic stability consists of the conservation of the density of oscillator strengths df /dE of discrete and continuous spectra during the superposition of external perturbations (such as interparticle interactions). Physically, this implies that the interaction perturbs the radiators, but does not annihilate them and change their total number. According to this principle, it is assumed that the e ect of interaction on the threshold spectra adds up to transformation of the higher terms of the spectral series to a continuous spectrum. This is in accordance with the unperturbed density of their oscillator strengths. Therefore, the photoionization cross–section is extrapolated to frequencies less than the ideal threshold frequency according to the behavior of df /dE. For higher frequencies, the photoionization cross–section is assumed to be unchanged. The
THE OPTICAL PROPERTIES OF DENSE PLASMA
cm
. |
. |
. |
eV |
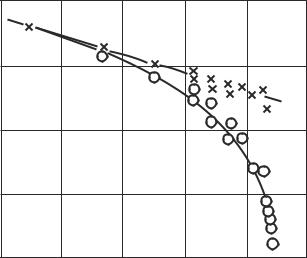
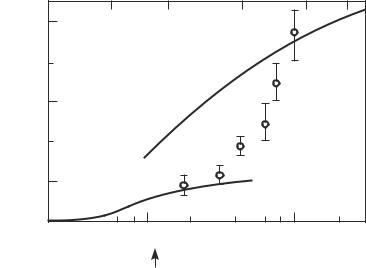
The measured population of atomic levels in a cesium plasma, ne = 9.7 · 1013 cm−3, T = 0.274 eV (Antonov and Popovich 1983): 1, without correction; 2, with correction for line broadening and slit width.
validity of this procedure is supported by a large body of available experimental data on weakly nonideal plasmas.
The e ect of “line attenuation” due to the static destruction of radiating levels by plasma microfields (Fig. 8.9) does not contradict the principle of spectroscopic stability. A continuous background emerges instead of the levels being destroyed. The amplification of the background compensates for the attenuation of lines. Figure 8.10 gives two distributions of excited atoms over levels measured in a pulsed discharge in cesium vapors. Curve 1 demonstrates the manifestation of line attenuation which is analogous to that demonstrated in Fig. 8.9. Curve 2 corresponds to spectroscopic stability. It is constructed with correction to the results of data processing. This is necessary because of the strong broadening of lines and finiteness of the spectral width of monochromator slits as compared with the half–width of the line being recorded.
Kobzev et al. (1977) proposed that, with an increase in density, the spectroscopic stability would be lost and the density of oscillator strengths would cease to persist. The latter must show up in observations. At the same time, it was proved by H¨ohe and Zimmermann (1982); D’yachkov (1986); D’yachkov, Kobzev, and Pankratov, (1987) that this principle could not be violated in a one–particle potential approximation. Deviations from this principle must be associated with the e ects of many–particle interaction. Any explicit replacement
THE PRINCIPLE OF SPECTROSCOPIC STABILITY |
315 |
of the many–particle description by some e ective interaction in a one–particle potential approximation leads to spectroscopic stability.
We will follow D’yachkov (1986) and cite the proof of spectroscopic stability within the model with central e ective potential. The e ective potential is a Coulomb potential with the tail deformed in some manner, which allows for the e ect of surrounding particles. We will now treat the averaged density of oscillator strengths of the spectral series df /dE = fndn/dE.
If the e ect of external perturbations in the region of localization of the wavefunction of the ground state is negligible, this approximation appears reasonable for the plasma density ne ≤ 1019 cm−3 as regards the Lyman and Balmer series. Therefore, in the indicated region (the region of substantial integration in a dipole matrix element), the wavefunction of higher state with the energy E will be written in the form of an ordinary regular Coulomb function, but with some additional normalizing factor B(E), which depends on the behavior of the perturbation of the potential tail. Consequently, the oscillator strengths di er from the respective Coulomb values by the square of this factor: fn = fnC B2(E).
As a result of perturbation, the density of states dn/dE will also vary. Therefore,
df /dE = (dfC/dE) B2 (dn/dE) (dnC/dE)−1 .
It may be readily demonstrated that in a quasiclassical approximation, this yields
df /dE = dfCdE. |
(8.20) |
Indeed, the normalized quasiclassical wavefunction of the bound state has the form
ψ = ap−1/2 cos (h/2π) |
r2 pdr |
− |
β |
, a = (2mΩ/π)1/2 |
, |
|
|
|
|
|
|
r1 |
|
|
|
||
|
|
|
|
|
where p is the quasiclassical momentum, Ω is the frequency of classical periodic motion between the turning points r1 and r2, and β is some phase. Consequently, B2 = (a/aC)2 = Ω/ΩC. The density of states is the inverse distance between levels ∆E−1. However, the Bohr–Sommerfeld quantum rule may readily yield ∆E = Ω. Therefore, dn/dE = ( Ω)−1 and, consequently, B2(dn/dE)(dnC/dE)−1 = 1. As a result, we derive relation (8.20) that is indicative of the spectroscopic stability of spectral series.
The simplest way of extending the derived result to cover a continuous spectrum is by placing an atom into a spherical box of large radius. Relation (8.20) will then automatically extend to cover the region above the photoionization threshold.
As a consequence of the unitary value of the transformation of the final and initial states (Levinson and Nikitin 1962), the principle of spectroscopic stability was proven by D’yachkov (1986) for the microfield model, that is, for an atom in a constant uniform (on the atomic scale) external field.
CONTINUOUS SPECTRA OF STRONGLY NONIDEAL PLASMA |
317 |
|||||||
σ |
(λ)/σ |
(260 nm) |
|
|
|
|
|
|
B |
B |
|
|
|
|
|
|
|
3 |
|
|
|
|
|
|
|
|
2 |
|
|
|
C |
|
|
|
|
|
|
|
|
|
|
|
|
|
1 |
|
|
|
B |
|
|
|
|
1 |
|
|
|
A |
|
|
|
|
|
|
|
|
|
|
|
|
|
1 |
|
|
|
|
|
|
|
|
|
|
280 |
300 |
320 |
340 |
360 |
380 λ, nm |
|
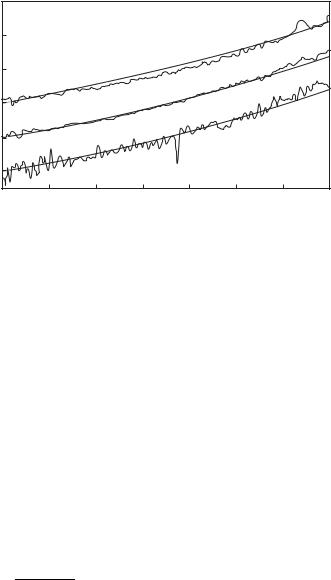
The density of oscillator strengths of the Balmer continuum, σB (λ), normalized to the wavelength 260 nm (Radtke and G¨unter 1986). The experimental curves reflect the presence of noise in the plasma, and the theoretical curves are smooth. The plasma parameters have the following meanings: A, T = 1.5 · 104 K, p = 26 kPa, ne = 5 · 1016 cm−3; B, T = 2.15 · 104 K, p = 340 kPa, ne = 5.4 · 1017 cm−3; C, T = 1.9 · 104 K, p = 426 kPa, ne = 7 · 1017 cm−3.
characteristics of the plasma. Note that the initial interpretation of these measurements was revised by the authors (Kulish et al 1995). Higher concentrations of charges were amounted by Mintsev and Zaporogets (1989) in experiments on the reflection of radiation by the shock wave front.
The coe cient of reflection of electromagnetic radiation R of an ideal heavily ionized plasma may be calculated by Frenel’s formula:
R = |
|
|
ε(ω) − 1 |
2 |
, |
(8.21) |
|
|
|
|
|
|
|
|
|
|
|
|
|
|
|
|
|
ε(ω) + 1
where ε = 1 − i4πσ/ω is the plasma perittivity, and Drude’s formula for the electrical conductivity:
σ = |
ωp |
|
1 |
, |
(8.22) |
|
4πν 1 + iω/ν |
||||||
|
|
|
||||
where ωp = frequency.
In the limit ν/ω → 0, the full reflection of the electromagnetic radiation at frequencies less the plasma frequency, ω ≤ ωp, takes place. There comes a point where at a given frequency the electron concentration becomes higher than the “critical” value, nc = mω2/4πe2. Typical dependencies of the coe cient of reflection of the plasma on the electron concentration are shown in Fig. 8.14. The
318 |
THE OPTICAL PROPERTIES OF DENSE PLASMA |
cm
. cm
.
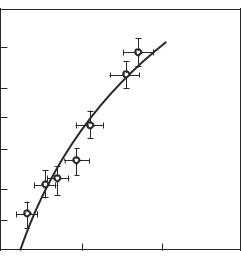
Fig. 8.13. The absorption index of xenon in the continuous spectrum counting, per single atom: points, experimental results at λ = 444 nm (Sechenov 1981); curve, results of calculation.
steepness of the dependence of reflectivity near the critical concentration is determined by the ratio ν/ω. At low collision frequencies, when a clear step in the dependence of R on ne is observed, it is possible to determine the electron concentration by means of changing a frequency of the probing radiation. In the strongly coupled plasma the dependence of reflectivity on electron concentration has more complicated character and contains new information about the properties of matter.
The coe cient of reflection of laser radiation with a wavelength of 1.06 m from a nonideal shock–compressed xenon plasma with electron concentration ne (2–9)·1021 cm−3, density ρ (0.5–4) g cm−3, and temperature T ≥ 3 · 104 K was measured by Fortov, Mintsev, and Zaporogets (1984). These states of matter were obtained by means of compression and irreversible heating of xenon in the explosive generator of rectangular shock waves (Fig. 8.15).
Because of the significant intrinsic heat radiation of the shock–compressed plasma, the probing beam was created by a pulsed (10−8 s) yttrium aluminum garnet laser, which gives a high spectral radiance temperature, T 6·107 K, and small angular divergence of the light flux. The laser system was provided with a Pockels’ shutter with electronic control, which permits the synchronization of the explosive generation and laser probing to 10−8 s. The coe cient of the plasma optical reflection has been determined determined by comparison of the intensities of incident and reflected radiation.
CONTINUOUS SPECTRA OF STRONGLY NONIDEAL PLASMA |
319 |
c
.
c
Fig. 8.14. The coe cient of reflection of an ideal heavily ionized plasma as a function of the electron concentration at di erent collision frequencies (Valuev, Mintsev, and Norman 2000).
The analysis of the spatial pattern of the ionizing shock wave has shown, that three distinctive regions exist, which can influence the propagation of the electromagnetic wave (Fig. 8.16). The existence of the highly heated plasma behind the shock wave front results in intensive radiant heat exchange with the resting gas ahead of the front of the shock wave. This gives rise to its heating and ionization (region I, “precursor”). Estimations have shown (Valuev et al. 2000) that in the condition of the experiments discussed, the “precursor” does not a ect the propagation of the radiation. The structure of the shock wave front (region II) is determined by relaxation processes in the plasma. Corresponding estimations have shown that the width of the shock wave front d is about 10−5 cm, order of value less the wavelength λ of the radiation. This gives grounds for considering that the reflection of the laser radiation is determined by the properties of the plasma behind the shock wave front (region III). The condition d λ allows one to use Frenel’s formula (8.21).

320 |
THE OPTICAL PROPERTIES OF DENSE PLASMA |
|||||||||
|
|
|
|
|
|
|
|
|
|
|
|
|
|
|
|
|
|
|
|
|
|
|
|
|
|
|
|
|
|
|
|
|
|
|
|
|
|
|
|
|
|
|
|
|
|
|
|
|
|
|
|
|
|
|
|
|
|
|
|
|
|
|
|
|
|
|
|
|
|
|
|
|
|
|
|
|
|
|
|
|
|
|
|
|
|
|
|
|
|
|
|
|
|
|
|
|
|
|
 or
or
Fig. 8.15. Schematic of the apparatus for measuring the coe cient of reflection of the shock-compressed plasma (Valuev, Mintsev, and Norman 2000): 1, laser; 2, photomultiplier; 3, explosive chamber; 4, ring lens; 5, cavity; 6, impulse generator; 7, delay block; 8, oscillographs; 9, plunger; 10, explosive charge.
For determination of the thermodynamic parameters of the shock–compressed matter, the velocity of the shock wave front, and the run–up velocity of the metal plunger were fixed in each experiment by electro–contact basis method. The measured values of the velocities, together with the conservation laws were used for the determination of the pressure, density, internal energy, and ionization composition of the plasma.
The results of measurements of the reflectivity of xenon by Fortov, Mintsev, and Zaporogets (1984) and Mintsev and Zaporogets (1989) are shown in Fig. 8.17. In the experimental conditions the reflectivity amounts to high values (about 50%), close to values typical for metals. One can see that the step in the dependence of R on ne, which is characteristic for a weakly nonideal plasma, is absent. The measurement results point to the plasma transition, as the nonideality increases, from a weakly reflecting state (ideal plasma) to a state with high
reflectivity (nonideal plasma). The transition is realized in the range of γ 1
=
and ω/ω 1, and cannot be described within any single theoretical model. The
p =

CONTINUOUS SPECTRA OF STRONGLY NONIDEAL PLASMA |
321 |
Plasma Precursor
Shock wave front
Fig. 8.16. Scheme showing possible regions of reflection of the laser radiation
curves in Fig. 8.17 are extrapolations to the transition region of the expressions that are valid for an ideal plasma (curve 1 is the extrapolation from the region where γ 1 and ω ωp) and for a strongly nonideal plasma (curve 2 is the extrapolation from the region where γ 1 and ω ωp). The reflection coe cient was calculated by Atrazhev and Iakubov (1989) using Eqs (8.21) and (8.22).
Simple estimations show that the best agreement with the experiment could be attained using Eqs. (8.21) and (8.22), if we accept that ν/ω ≈ 2. Such a high value of this parameter is evidence that the system under investigation is characterized by so strong an interparticle interaction that even the applicability of Drude’s formula raises doubts. One can suggest that a significant reorganization of the spectrum is realized. A similar e ect takes place in easily boiled metals during the metal–dielectric transition for closed nondimensional parameters of the matter (see Section 8.7).
Ng et al. (1986) measured the reflection of laser radiation from an expanding aluminum plasma formed after the arrival of a powerful laser–induced shock wave to a free surface. Recently the reflection coe cient in shock–compressed deuterium at a pressure 17–50 GPa was measured by Celliers et al. (2000) and analyzed by Collins et al. (2001). In all these experiments, high values of the reflection coe cient were also recorded.
The theory of bremsstrahlung and recombination radiation of a nonideal plasma (Longhvan Kim, Pratt, and Tseng 1985; Totsuju 1985; Artem’ev and Iakubov 1988; Kawakami et al. 1988) allows for the increasing e ect made on
 cm
cmTHE OPTICAL PROPERTIES OF LOW–TEMPERATURE METAL PLASMA 323
of vapors of mercury and alkali metals, such phenomena occur at fairly low temperatures (close to 2000 K).
The results of measurements of frequency dependencies of the coe cients of optical absorption, as well as reflection for mercury in the “dielectric–metal” transition region, were presented in Chapter 2 (Figure 2.16, where the measurement results demonstrate the variation of the optical radiation reflection coe cient). The dependencies characteristic of a metal have been obtained at ρ ≥ 12 g cm−3. At low frequencies, the reflection coe cient R reaches approximately 90%. It also decreases with density; this is accompanied by a variation of the frequency dependence. At a density of ρ 9 g cm−3, the supercritical mercury metallizes and a maximum value is observed on the R(ω) curve. This is characteristic of matter with an energy gap. At low and high frequencies, the reflection coe cient drops (Ikezi et al. 1978).
Now, the frequency dependence of the absorption coe cient for mercury, k(ω), at subcritical densities (Fig. 2.15) bears no resemblance to that characteristic of metal. First of all, one’s attention is arrested by the sharp edge of the wide absorption band shifting toward the red with an increase in density. At low frequencies ( ω ≤ 1 eV), with an increase in density and a decrease in temperature, the k(ω) relationship acquires a plateau. We now discuss these two main peculiarities of k(ω).
An optical transition between two atomic levels in rarefied gas causes absorption in the spectral line. The spectral line in gas is quite narrow. The line width and shift, as well as the frequency dependence of the absorption coe cient, k(ω), are defined by the interaction processes perturbing the high and low levels.
One can assume that the high–frequency component of the dense mercury spectrum is the edge of a strongly broadened band, which emerges upon the transitions of mercury atoms from the ground 6s state to exciton states. The exciton states occur as a result of evolution of the first excited states (6p and 7s) of mercury atoms upon their interaction with the environment, that is, with fluctuations in the density of atoms in the ground state (Bhatt and Rice 1979). First, these interactions serve to reduce Eopt, the minimum excitation energy, to the so–called optical gap. For an isolated atom, this gap is Eexc = 4.8 eV. Secondly, the absorption band broadens strongly with an increase in density. This is because as a result of the interaction with radiation, an electron passes to a greater orbit and finds itself in a cluster containing, with a fairly wide scatter, some or other number of atoms. Therefore, the density of bound electron states is defined by the interaction with its own ion and with the atoms of the medium. Following the reasoning in Section 6.3, one can conclude that in a first approximation,
ρ( ω) exp[−( ω − ∆Eopt)2/∆Et2], |
(8.24) |
where ∆Et is the half–width of the absorption band. It is obvious that the ∆Eopt and ∆Et values, which are divided by the average number of atoms with which the bound electron interacts, should be of the order of 0.1 eV (such is the scale of the energy of the electron’s interaction with a mercury atom). Assuming that

324 |
THE OPTICAL PROPERTIES OF DENSE PLASMA |
cm
.
|
|
|
|
. |
|
|
|
|
. |
. |
. |
. |
. |
eV |
Fig. 8.18. Optical absorption coe cient for mercury (Uchtmann et al. 1980), ρ = 4 g cm−3.
k(ω) ρ( ω), Bhatt and Rice (1979) and Popielawski et al. (1979) performed an evaluation by fitting Eq. (8.24) to the observed k(ω) relationship, Fig. 2.16. The ∆Eopt and ∆Et values per single atom are estimated at 0.37 eV and 0.18 eV, respectively.
The experimental data enabled Hefner and Hensel (1982) and Overho , Uchtmann, and Hensel (1976) to plot the density dependence of ∆Eopt (Fig. 2.13). At low densities, it can be readily extrapolated to the value of the mercury atom excitation energy Eexc. It is very important that the ∆Eopt gap decreases as
the density increases, and closes at ρ ρ , that is, at the same density as the = c
transport gap ∆E. Therefore, the high–frequency component of the spectrum has found a convincing interpretation.
We now discuss the low–frequency plateau of the absorption coe cient. For a long time, no explanation could be found for the emergence of a plateau although the behavior of the density and temperature dependencies indicated clearly that this was a new optical process taking place in a disordered, dense metallic medium. The results of additional measurements, shown in Fig. 8.18, led Uchtmann, Hensel, and Overho (1980) to conclude that the plateau had emerged as a result of radiation absorption by charged clusters. Roughly, the plateau in Fig. 8.18 is the new absorption band. It follows from Fig. 8.18 that k(ω) increases with an increase in density and a decrease in temperature on the plateau. The same is true of the cluster concentration (cf. Section 4.3). Naturally, this gave an absorption band in the neighborhood of the eigenfrequency of the electron bound in a cluster (Khrapak and Iakubov 1971).
THE OPTICAL PROPERTIES OF LOW–TEMPERATURE METAL PLASMA 325
. g cm |
g cm |
°
°
. . . |
eV |
. . . . |
eV |
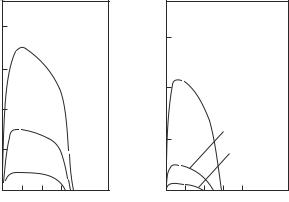
Fig. 8.19. The σ(ω)/σ(0) relationship for gaseous dense mercury at di erent temperatures
and densities (Uchtmann et al. 1980).
The conclusions by Uchtmann et al. (1980) were directly based on the results by Lagar’kov and Sarychev (1978). The latter had calculated σ(ω) using the same techniques employed by them to study the static electrical conductivity σ(0) (Chapter 6). The σ(ω)/σ(0) relationships obtained are very close to those presented in Fig. 8.19. The results by Lagar’kov and Sarychev (1978) lead one to conclude that a qualitative agreement exists between theory and experiment.
We now consider the dielectric permeability, ε(ω), of a nonideal mercury plasma in the region of the “metal–dielectric” transition. The ε(ω) relationship can be obtained by processing the experimental transmission and reflection co- e cients (Verleur 1968; Hefner, Schmutzler, and Hensel 1980; Kawakami et al 1988; Uchtmann et al 1988). Verleur (1968) demonstrated the possibilities of a relatively simple approach based on an approximation of the optical properties of matter by a set of damped classical oscillators:
ε(ω) = εr + iεi = 1 − |
νp2 |
|
flν2 |
(8.25) |
|||
0 |
− l |
|
|
l |
|||
ω(ω + iΓ0) |
≥ |
1 |
ω(ω + iΓl) − νl2 |
. |
|||
|
|
|
|
|
|
|
|
Here, fl, νl, Γl denote the oscillator strength, frequency, and bandwidth of the lth oscillator, respectively. The first two terms in the right side of Eq. (8.25) correspond to the Drude model (model of almost free electrons) and must describe the observed values of transmission coe cients in the liquid–metal region. Subsequent oscillator terms will become significant when a gap occurs in the energy spectrum, a peculiarity sometimes referred to as the pseudogap. The values of the parameters νp0 , νl, Γl, fl are the values selected for each point in the {ρ, T } diagram, such that the calculated curves R(ω) should approximate the experimental curves as closely as possible. It follows from Fig. 2.16 that this can
326 |
|
THE OPTICAL PROPERTIES OF DENSE PLASMA |
|
|
. |
s |
10 ohm cm |
|
. |
|
|
|
|
. |
|
|
|
|
|
. g cm
.
.
.
.
eV
Fig. 8.20. The frequency dependence of the electrical conductivity of mercury obtained from the experimental values of R(ω) for the same p − ρ − T as in Fig. 2.16.
be done to great advantage by using three resonance terms in Eq. (8.25), l ≤ 3. Therefore, the values of νp0 , νl, Γl, fl are found, and it is possible to calculate the εr(ω) and σ(ω) frequency dependences for the same {ρ, T } set. Note, however, that the problem of interpreting the oscillators thus derived remains open. Strictly speaking, the problem of unambiguity of fitting remains open. Still, the fitting accuracy attained appears very convincing.
Figure 8.20 shows the calculated σ(ω) curves. At ρ ≥ 12 g cm−3, they correspond rather well to almost free electrons (Drude model). However, even at 11 g cm−3, qualitative changes are observed which point to a partial loss of metallic properties. At ρ < 8 g cm−3, the quantity νp20 disappears altogether and σ(ω) is fully described by the resonance terms. This means that the “metal–nonmetal” transition is already accomplished. The values of σ(ω) are directly related to those of k(ω). Indeed, it turns out that the σ(ω) values on the isochor of 5 g cm−3 presented in Fig. 8.20 agree well with those obtained from k(ω) in Fig. 2.15. Note further that the static conductivity σ(0) = νp20 /(4πν0) agrees well with the results of static measurements (shown by arrows in Fig. 8.20). In this manner, the results of R(ω), k(ω), σ(ω) measurements are coordinated with each other.
Perhaps that the most interesting results were obtained at low densities in a
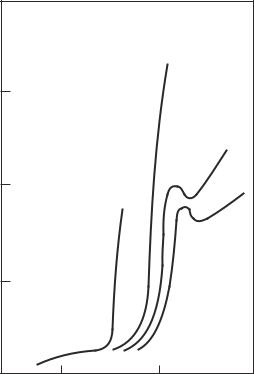
THE OPTICAL PROPERTIES OF LOW–TEMPERATURE METAL PLASMA 327
.
.
.
. MPa
Fig. 8.21. Isotherms of the reflection coe cient for mercury at the wavelength of 650 nm
(Yao, Uchtmann, and Hensel 1984).
dense plasma of mercury vapors by Hefner and Hensel (1982), Yao, Uchtmann, and Hensel (1984), and Uchtmann et al (1988) (see Fig. 8.21). The reflection coe cient increases anomalously at density values above 3 g cm−3. The value of εr in this (still far from the critical) region increases accordingly, and the εr(p) relationship passes through a maximum. This relationship does not conform to the Clausius–Mosotti formula that points to a smooth and minor rise of εr to 1.6. Instead, in a narrow density range, εr passes through a maximum to increase approximately fourfold at the density values at which the k(ω) plateau occurs. The latter leads one to conclude that the dielectric anomaly is likewise related to the transition of charged particles to clusterized states. Moreover, there are good reasons to believe that the clusters are metallized near the saturation line, an assumption made earlier from general considerations. If this is so, the matter is a disordered, two–phase medium where the liquid–metal phase is represented