

DYNAMIC COMPRESSION OF THE CESIUM PLASMA |
73 |
calculation is possible (cesium plasma, Section 3.2) or the temperature is known from experiment (Fortov 1972a).
The E(p, v) or (p, v) relationships required in the calculation of the right– hand sides of Eqs. (3.4) and (3.5) were determined from the experimental data in the form of power polynomials and rational functions. The accuracy of the obtained solution, as a function of the experimental errors and inaccuracy of initial data, was determined using the Monte Carlo method by computer modelling of the probability structure of the measuring process (Fortov and Krasnikov 1970).
This method is free of restricting assumptions on the properties, nature, and phase composition of the medium under investigation. This is because it makes use of the first principles of mechanics and the fundamental thermodynamic identity (3.3). This thermodynamic universality enables one to construct, using a unified procedure, the equation of state for a wide spectrum of condensed media and to use it to describe phase transformations (Fortov 1972b). The method proved to be especially e ective in the study of the thermodynamics of nonideal cesium plasma on the basis of experiments in shock (Lomakin and Fortov 1973; Bushman et al. 1975) and adiabatic (Kunavin et al. 1974) compression of saturated vapors.
3.2Dynamic compression of the cesium plasma
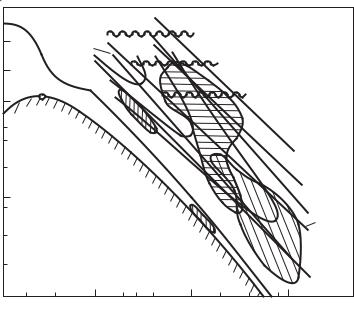
Cesium has the lowest ionization potential, ca. 3.89 eV, of the practically accessible elements, which helps attain a high charge concentration ne at moderate temperatures, thereby ensuring a substantial value of the nonideality parameter at relatively low energy contributions. Therefore, this element is the most popular choice for use in nonideal plasma experiments. Its phase diagram indicating regions of parameters accessible for various techniques is shown in Fig. 3.2. The dynamic generation of cesium plasma was accomplished by way of adiabatic (state 4) and shock compression of saturated vapors in the incident (6) and reflected (7) shock fronts.
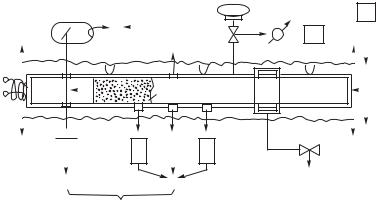
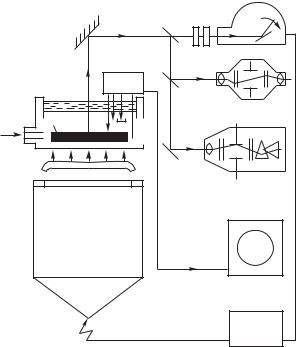
Experiments in dynamic compression of cesium vapors were performed in a pneumatic, diaphragm shock tube (Lomakin and Fortov 1973; Bushman et al. 1975), as illustrated schematically in Fig. 3.3. In order to attain initial high pressures of saturated vapors, the experimental apparatus having a length of 4 m and an inside diameter of 4.5 cm was heated to 700 ◦C. Along with the marked aggressive properties and chemical activity of cesium, these high temperatures presented the main reason for the di culties involved in such an experiment. An ionizing shock wave emerged upon expansion to saturated cesium vapor of helium, argon or their mixtures precompressed to about 0.1 GPa. An additional increase of shock–compressed plasma parameters was attained with the aid of shock waves reflected from the tube end.
In accordance with the dynamic approach, two mechanical parameters characterizing shock compression were independently registered in each experiment. The optical and X–ray (Lomakin and Fortov 1973) baseline techniques were employed for determining the shock front velocity (to an accuracy of about 1%) and
74 DYNAMIC METHODS IN THE PHYSICS OF NONIDEAL PLASMA
Pa |
|
. |
|
Two-phase |
. |
region |
|
|
cm3.g−1 |
Fig. 3.2. Phase diagram for cesium: saturation curve, 1 (Chapter 2); static experiments, 2 and 3; region of isentropic compression, 4 (Pfeifer et al. 1973; Kunavin et al. 1974), from the initial states, 5; compression by incident, 6, and reflected, 7, shock waves; electric explosion, 8; α, degree of ionization; C, critical point; Γ, nonideality parameter.
for monitoring the steadiness of flow of shock–compressed plasma. The plasma density was recorded using the flash radiography technique based on measuring the plasma attenuation of “soft” X–ray radiation. The wavelength of the latter radiation was selected for reasons of maximum sensitivity and minimum statistical error of the measuring scheme. It amounted to (0.2–0.5)·10−8 cm. The X–ray photographs obtained point to the absence of marked condensation of shock– compressed cesium and permit the determination of the plasma density with an error of 5–10%. This is supported by the results of radiography of reliably calculated shock waves in xenon (Bushman et al. 1975).
Experiments in shock compression of cesium were conducted in the optimum (as regards nonideality e ects) region of parameters at initial pressures of (0.04– 0.54)·105 Pa and shock velocities of (0.8–3)·105 cm s−1. These correspond to a sizable region of the phase diagram (Fig. 3.2), namely, p (1.4–200)·105 Pa, T 2600 −20 000 K and ne 5·1015–5·1019 cm−3, with the maximum Coulomb nonideality (Γ = 0.2–2.2). It is significant that in the phase diagram (Fig. 3.2), the regions of parameters behind the incident and reflected waves partially overlap and, in their lower part, correspond to a quasi–ideal plasma. This enables
DYNAMIC COMPRESSION OF THE CESIUM PLASMA |
75 |
||||||||||||||||||||||||
|
|
|
|
|
|
|
|
|
|
|
|
|
|
|
|
|
|
|
|
|
|
|
|
|
|
|
|
|
|
|
|
|
|
|
|
|
|
|
|
|
|
|
|
|
|
|
|
|
|
|
|
|
|
|
|
|
|
|
|
|
|
|
|
|
|
|
|
|
|
|
|
|
|
|
|
|
|
|
|
|
|
|
|
|
|
|
|
|
|
|
|
|
|
|
|
|
|
|
|
|
|
|
|
|
|
|
|
|
|
|
|
|
|
|
|
|
|
|
|
|
|
|
|
|
|
|
|
|
|
|
|
|
|
|
|
|
|
|
|
|
|
|
|
|
|
|
|
|
|
|
|
|
|
|
|
|
|
|
|
|
|
|
|
|
|
|
|
|
|
|
|
|
|
|
|
|
|
|
|
|
|
|
|
|
|
|
|
|
|
|
|
|
|
|
|
|
|
|
|
|
|
|
|
|
|
|
|
|
|
|
|
|
|
|
|
|
|
|
|
|
|
|
|
|
|
|
|
|
|
|
|
|
|
|
|
|
|
|
|
|
|
|
|
|
|
|
|
|
|
|
|
|
|
|
|
|
|
|
|
|
|
|
|
|
|
|
|
|
|
|
|
|
|
|
|
|
|
|
|
|
|
|
|
|
|
|
|
|
|
|
|
|
|
|
|
|
|
|
|
|
|
|
|
|
|
|
|
|
|
|
|
|
|
|
|
|
|
|
|
|
|
|
|
|
|
|
|
|
|
|
|
|
|
|
|
|
|
|
|
|
|
|
|
|
|
|
|
|
|
|
|
|
|
|
|
|
|
|
|
|
|
|
|
|
|
|
|
|
|
|
|
|
|
|
|
|
|
|
|
|
|
|
|
|
|
|
|
|
|
|
|
|
|
|
|
|
|
|
|
|
|
|
|
|
|
|
|
|
|
|
|
|
|
|
|
|
|
|
|
|
|
|
|
|
|
|
|
|
|
|
|
|
|
|
|
|
|
|
|
|
|
Fig. 3.3. Schematic of a heated cesium shock tube (Lomakin and Fortov 1973; Bushman et al. 1975): 1, air–operated valves; 2, system for measuring the initial cesium pressure; 3, liquid cesium vessel; 4, thermocouples; 5, propelling gas; 6, diaphragm unit; 7, photomultipliers; 8, shock–compressed plasma; 9, electrical conductivity measuring coil; 10, beryllium windows; 11, X–ray tube; 12, electric heater.
one to make full use of the temperature calculation technique according to Eq. (3.3). This is because the characteristics (3.4) and (3.5) of this equation (isentropes in Fig. 3.1) lie fully in the region overlapped by experiment, including the region of weakly ionized plasma, V = 1600 cm3g−1, where the initial data for Eqs. (3.3)–(3.5) are assigned. A reliable calculation of derivatives entering into Eqs.(3.3)–(3.5) is possible in case the array of experimental points is su - ciently wide in the p and V variables. This caused one to exceed the limits of the optimum conditions during the experiments (Fig. 3.2).
The static electrical conductivity of shock–compressed cesium plasma was measured using the induction technique (to an accuracy of 20–40%) in a parallel oscillatory circuit (Sechenov et al. 1977) at frequencies of 0.2–4 MHz. An inductance coil placed as a flat coil in a shock tube end (Fig. 3.3) changed its inductance under the e ect of plasma formed behind a reflected shock front. The experiments were performed at 1 p 15 MPa and 4000 T 25 000 K, with Coulomb interaction prevailing (0.3 < Γ < 2). Under these conditions, the e ects of unpairing and correlation of atoms, as well as cluster e ects, are small whereby the Coulomb component of electrical resistance can be isolated and compared with plasma theories (Fig. 7.5).
In the case when a weakly ionized plasma with strong charge–neutral interaction is of most interest, the adiabatic compression technique proves e ective. This technique is free from irreversibility e ects. Therefore, it is possible to attain lower (as compared to the shock wave technique) temperatures and appreciable densities of material (Ryabinin 1959; Kunavin et al. 1974; Pfeifer et al. 1973; Lo-
76 DYNAMIC METHODS IN THE PHYSICS OF NONIDEAL PLASMA
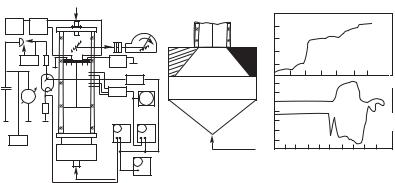
Fig. 3.4. Schematic of a heated cesium shock tube (Pfeifer et al. 1973): 1, seal adjustment; 2, foil; 3, conductivity sensor; 4, beryllium windows; 5, barrel; 6, copper attachment; 7, piston; 8, electric heater; 9, Teflon; 10, displacement sensor; 11, contacts for triggering the instruments; 12, diaphragm; 13, propelling gas; 14, evacuation; 15, liquid gas.
makin and Lopatin 1983). In doing so, compression must be rather “smooth” so as to preclude shock wave generation and, at the same time, su ciently “rapid” to eliminate heat transfer e ects. Suitable apparatus was developed in the 1940s (Ryabinin 1959) and permitted unique measurements of the characteristics of overdense gases at temperatures of up to 9 · 103 K and pressures of up to 0.1 GPa. The use of such techniques in the physics of nonideal plasma called for substantial changes in the basic arrangement of adiabatic compression facilities.
In a two–stage adiabatic tube, compression of cesium is e ected (Kunavin et al. 1974) by means of an unloaded lightweight piston (7) moving in a chamber (5) preheated to 1000 ◦C. The fact is that in this apparatus, the leakage of cesium through the lightweight piston renders the realization of the principal advantage of the adiabatic technique impossible, that is, the high compression ratios which in this case did not exceed the value of six, this being close to the values characteristic of shock waves. This shortcoming was eliminated in a single–stage tube (Pfeifer et al. 1973) using a heavy piston (2) with an extended seal surface (Fig. 3.4). The compressed plasma density was measured using the “soft” X–ray technique. Electrical conductivity was measured, using the induction method. The use of the crusher technique to record the pressure was also propose. During the first experiments in this facility, the electrical conductivity of plasma was measured at a compression ratio of about 25. This corresponds to rated pressures of up to 33 MPa and temperatures of 4900–6100 K.
3.3Compression of inert gases by powerful shock waves
An analysis of cesium experiments (Section 3.2) revealed a sizable contribution of bound states in the dense plasma. This emphasized the need for extension of the region of parameters under investigation and for a transition to experiments
COMPRESSION OF INERT GASES BY POWERFUL SHOCK WAVES 77
with other chemical elements. This problem called for a substantial increase in shock wave intensity and the use of new high–enthalpy working media for shock wave generation.
Tkachenko et al. (1976) and Volkov et al. (1978) used a shock tube to generate argon, xenon, and air plasma. An increase in the propelling gas enthalpy had been attained by means of a discharge of a tank of capacitors with an energy of about 60 kJ. This facility was employed to perform precision measurements of the thermodynamic (registration of the reflected shock velocity), optical (measurement of the growth of radiation intensity), and electrophysical (induction method) properties of a plasma compressed in a reflected shock wave. Since the selected method of generation produces a weakly nonideal plasma of Γ ≤ 0.2 at a moderate pressure of several megapascals, these experiments register only initial manifestations of plasma nonideality and a slight shift of the ionization potential and photoionization continuum, as well as of minor deviations of the electrical conductivity values from those derived by Spitzer.
Substantially higher parameters can be attained by using powerful condensed explosives in view of their high specific energy content and rate (ca. 10−7 s) of detonation transformation, which enabled the development of high–power facilities (1010 − 1012 W). Christian and Yarger (1955) were the first to employ directly the explosion technique for the registration of shock adiabat of gaseous argon. A similar technique was thereafter used by Deal (1957) to register shock adiabats of air at atmospheric pressure with subsequent determination, on that basis, of the nitrogen dissociation energy. In subsequent studies, explosion shock waves in inert gases and air were used as a source of intense optical radiation for high–speed photography, laser pumping, excitation of detonation, the study of the e ect of radiation on matter, spectroscopic investigations, and so forth (Tsukulin and Popov 1977). Since the initial gas pressures in the respective facilities did not exceed 105 Pa, there was not enough time for the nonideality e ects in such plasma to show up vividly. Hence the nonideality e ects did not serve the subject of investigation.
Special experiments aimed at studying the e ect of nonideality upon the physical properties of explosion plasma were staged in the early 1970s. Inert gases were chosen as the subject of investigation in view of the possibility of their e cient heating in the shock front. This is due to the elimination of dissociation losses of energy and high molecular weight, as well as the much more simple interpretation of the measurement results. The latter is attributed to the absence of complex molecular and ion–molecular clusters and to prior detailed studies of elementary processes.
In order to assess the optimum experimental conditions and the choice of plasma generator designs, machine computations were performed (Gryaznov, Iosilevskii, and Fortov 1973) on the thermophysical and gas–dynamic properties of shock waves in dense inert gases. It has been revealed that the optimum values of the nonideality parameter are attained at shock velocities D of about 9 · 105 cm s−1 in argon and 5 105 cm s−1 in xenon. A further increase of D leads to
78 DYNAMIC METHODS IN THE PHYSICS OF NONIDEAL PLASMA
overheating and an increase in the ionization multiplicity of the plasma, while a rise of initial pressure leads to plasma degeneracy. It is important that the optimum conditions can be realized by using a simple linear scheme of shock wave excitation, while to produce a highly heated, multiply ionized plasma one must employ reflected shock waves or geometric cumulation e ects.
In a linear explosion shock tube (Fig. 3.5) (Fortov et al. 1975a; Bespalov et al. 1975; Ivanov et al. 1976; Mintsev and Fortov 1979), an ionizing shock wave is generated upon expansion into the gas under investigation of the hexogen detonation products (hexogen is a condensed explosive with a specific energy content of approximately 104 J cm−3), which feature, after the completion of the detonation transformation reaction, high dynamic characteristics of p 37 GPa, T 5 · 103 K, 2.3 g cm−3. An additional (as compared with conventional shock tubes) increase of the propelling gas enthalpy is caused by the fact that the disintegration of pressure discontinuity occurs in a coordinate system moving at a rate of 2.1·105 cm s−1. The use of a specially shaped detonation lens and proper choice of the size of active explosive charge accounted for the one–dimensional nature and stationary position of the detonation front upon its exit from the explosive and into the test gas. The total energy release in each experiment amounted to approximately 3 · 106 J with a power of about 1011 W. Naturally, this leads to the destruction of the entire apparatus and the need to use premises with special protection and to take the appropriate safety measures. The results of photographic, electrophysical, and X–ray measurements revealed the one– dimensional nature and quasi–steadiness of plasma flow, which are accomplished through the inertial confinement of shock–compressed plasma by the massive walls of the shock tube channel.
The explosion shock tube (Fig. 3.5) was fully equipped for independent thermodynamic and electrophysical measurements. The shock front velocity was measured (Bespalov et al. 1975) by optical and electrocontact baseline techniques with the aid of high–speed cameras and ionization sensors to an accuracy of 1–1.5%. Within this error, the ionization front coincided with the shock wave luminescence front and the position of hydrodynamic shock.
The density of shock–compressed argon plasma was registered at an accuracy of about 8% by flash radiography (Section 3.2), which is characterized by high time (ca. 10−7 s) and space (ca. 2 mm) resolution and the absence of perturbation in the plasma flow.
In view of the transparency of the plasma before the shock front and the small dimensions of the viscous shock, thermal radiation is capable of leaving the plasma volume without any obstacles and yielding experimental data on equilibrium temperature and absorption factors of shock–compressed plasma (Model’ 1957; Tsukulin and Popov 1977). The intensity of this radiation, in the case of using the brightness method (at an accuracy of 5–10%), for temperature recording was determined (Bespalov et al. 1975, 1979a) by photometric comparison of time scans of the luminescence of shock–compressed plasma and reference light sources, such as a flash lamp with brightness temperature of 8600 ± 200 K,
COMPRESSION OF INERT GASES BY POWERFUL SHOCK WAVES 79
c
|
|
2 |
s |
kV |
|
Current |
|
|
|
||
|
|
|
|
|
|
|
Voltage |
|
2 |
Initiation |
s |
|
|
||
|
|
|
a |
Initiation |
b |
d |
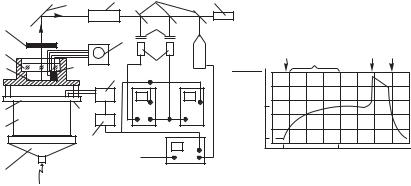
Fig. 3.5. Scheme of measurements in an explosion generator of nonideal plasma: a, diagnostics; b, explosive charge; c, roentgenogram; d, oscillogram; 1, generator channel; 2, explosive charge; 3, supply to X–ray tube; 4, X–ray control unit; 5, oscillographs; 6, di erential amplifier; 7, X–ray tube; 8, potential and current probes for registration of electrical conductivity; 9, mirror; 10, Plexiglas obstacle; 11, probes for measuring the shock front velocity; 12, filter and attenuator; 13, high–speed camera; 14, d.c. source; 15, photomultiplier with NaI scintillator; 16, supply to electric contacts; 17, oscillograph for velocity recording.
pulsed capillary light source with T = 39700 ± 700 K, and a shock wave in air with T = 11800 ± 600 K.
As demonstrated in a special series of test experiments, as well as by estimates, the self–shielding e ect is absent in view of the heating of gas by ultraviolet plasma radiation. According to the data by Tsikulin and Popov (1977), this e ect becomes conspicuous for argon (p0 = 105 Pa) beginning at D ≥ 15 km s−1 and from D > 8 km −1 for xenon, and decreases with a rise in the initial gas pressure.
The registration of the shock front velocity and the density yields, in accordance with the conservation laws of Eq. (3.1), the caloric equation of state for nonideal plasma, E = E(p, v), which, together with the temperature measured, T = T (p, V ), provides one with thermodynamically complete information on argon plasma at p (1.6–5.8)·108 Pa, T (15.5–23)·103 K, Γ 1.3–2.2 and ne (1.5–3.5)·1020 cm−3.
Electrical conductivity is an important characteristic of plasma which o ers valuable information on its structure and elementary processes. In view of the high level of electrical conductivity, its measurements (Ivanov et al. 1976; Mintsev and Fortov 1979; Mintsev, Fortov, and Gryaznov 1980; Ebeling et al. 1991) were performed using the probe technique (Fig. 3.5). This is characterized by high space resolution and relative simplicity of realization under conditions of a single dynamic experiment. A characteristic oscillogram of transport current and voltage is given in Fig. 3.5 where one can clearly see a “plug” of shock– compressed plasma.
80 DYNAMIC METHODS IN THE PHYSICS OF NONIDEAL PLASMA
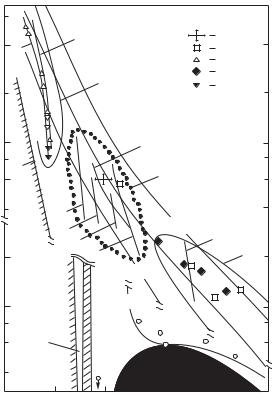
Extremely high densities of plasma were attained by two–stage compression of near–critical states of xenon in the incident and reflected shock waves (Mintsev and Fortov 1979). To this end, a Plexiglas obstacle was placed at a distance of 7 cm from the charge end face (Fig. 3.5). The interaction with the obstacle causes a reflected shock wave in the plasma cluster. This leads to additional compression and heating of the xenon plasma. While doing so, a shock wave emerged in the Plexiglas obstacle. Its velocity enabled one to determine the pressure, density, and enthalpy of xenon following its double compression (cf. point 10 in Fig. 3.6). A consistent description of these thermodynamic data was accomplished using a “chemical” model of the plasma. In this model, the Coulomb interaction is described by the modified Debye approximation and the repulsion at small distances, by virial corrections. This thermodynamic model was then used to interpret (Section 3.5) the results of measurements of the electrical conductivity of the plasma under supercritical conditions.
These experiments have yielded data on the electrical conductivity of xenon (Mintsev and Fortov 1979) under the highly supercritical conditions of 1–4 g cm−3 (ρc 1.1 g cm−3) at high pressures and temperatures (p 2–11 GPa and T (1–2)·104 K), where a wide spectrum of strong interparticle interactions involving the participation of neutral and charged particles is realized. Note that in this manner, one manages to generate plasma under unusual conditions, that is, the plasma density is 1.5 times higher than that of solid xenon and is comparable to the density of solid metals. The investigated parameters in region I in Fig. 3.6 extend from the lower–density states II, where the thermodynamic and electrophysical properties of the material are described by plasma models, to adjoin directly region III of solid–state densities described by the band theory of solids. The latter is formed as a result of dynamic compression of liquid xenon.
The urge to obtain a plasma with high nonideality parameters compels one to perform experiments at relatively low temperatures of the order of 20 000 K, at which the plasma is, as a rule, not fully ionized (Model’ 1957; Kunavin et al. 1974; Bushman et al. 1975; Bespalov et al. 1975). At the same time, the study of a multiply ionized nonideal plasma is of considerable interest and enables one to investigate purely Coulomb e ects in a highly heated medium.
The use of reflected shock waves made it possible to advance, at reduced initial gas pressures, into the region of multiple ionization and to produce plasma at temperatures above 20 000 K (Mintsev et al. 1980; Ebeling et al. 1991). The same purpose is served by cumulative explosion tubes (Mintsev et al. 1980; Ebeling et al. 1991), which depend for their action on the increase in the parameters of propelling gas under conditions of centripetal motion (Zaporozhets, Mintsev, and Fortov 1987) of the latter in a conical chamber (Fig. 3.5) with apex angles of 60-120o. In this manner, shock velocities in xenon of 8–15 km s−1 were attained, with initial pressures of up to 1 MPa. This corresponds to extremely high, (3-10)·104 K, heating of nonideal (Γ 2) plasma. While leaving the interpretation of these data until Chapter 5, we shall point out that it is the thermal electron scattering by the inner shells of ions which is important under the given
COMPRESSION OF INERT GASES BY POWERFUL SHOCK WAVES 81
Pa
Solid |
Gas |
Liquid |
 cm3g−1
Fig. 3.6. Phase diagram for xenon. I, experiments with reflected shock waves; II, experiments with incident shock waves; III, shock compression of liquid xenon. Calculated adiabats: 1, p0 = 5 · 106 Pa; 2, p0 = 6 · 106 Pa; 3, p0 = 7 · 106 Pa; 4, p0 = 8 · 106 Pa; 5, p0 = 2.8 · 105 Pa; T0 = 165 K; 6, p0 = 2 · 105 Pa; 7, shock adiabat of double compression (Mintsev and Fortov 1979); 8, calculation under the band model (Keeler et al. 1965); 9,
T = 0 K isotherm. Thermodynamic measurement data: 10, “reflection” method (Mintsev and Fortov 1979); 11, Fortov et al. (1976); 12, Keeler et al. (1965); Nellis et al. (1982). Electrical conductivity measurement data: 13, Ivanov et al. (1976); 14, Nellis et al. (1982).
C, critical point.
conditions.
In order to measure the thermodynamic and optical characteristics of plasma at higher (as compared with shock tubes) pressures, use was made of linear explosion generators of step shock waves (Fig. 3.7) of varying intensity (Fortov et al. 1976; Gryaznov et al. 1980) and duration, as well as of light–gas propulsion devices (Keeler et al. 1965; Nellis et al. 1982). In such apparatus, the ionizing shock wave emerged upon expansion of metal or polymer targets, precompressed
82 DYNAMIC METHODS IN THE PHYSICS OF NONIDEAL PLASMA
a
b
b
Gas
Fig. 3.7. Schematic illustrating the experiments in explosive compression of inert gas plasma: 1, detonation lens; 2, explosive charge; 3, metal projectile; 4, test assembly; 5, target; 6, test gas; 7, electric contacts and pulse-shaper unit; 8, oscillographs; 9, synchronization and detonation unit; a, high–speed photorecorder; b, image converter.
to about 0.1 TPa, into the gases under investigation (argon, xenon). Powerful shock waves in the targets were excited by linear explosion propulsion devices (Altshuler 1965; Fortov 1982) operated by acceleration of flat metal projectiles to 2–6 km s−1 by the detonation products. The energy release in these experiments amounted characteristically to (2–30)·106 J at a power of the order of 1011 W.
In accordance with the dynamic approach, electrocontact and optical baseline techniques were employed (Fortov et al. 1976; Gryaznov et al. 1980) in the experiments in these generators for simultaneous independent registration of two kinematic parameters: the front velocity D and the plasma mass velocity u. Open electrocontact pins recorded the front velocity D at an accuracy of the order of 1% with the aid of fast oscillographs. The mass velocity u was registered (at an accuracy of 1.5–2%) by enclosed pins of special design which are unresponsive to the shock wave in the plasma. They also operate upon the arrival of the plasma/target heavy contact interface. The system of sensor pins was arranged to allow for possible shock wave tilt and to monitor the parameters of the driving pressure pulse from the projectile accelerated by the detonation products. In the
COMPRESSION OF INERT GASES BY POWERFUL SHOCK WAVES 83
case of the optical registration technique, a Plexiglas obstacle (Fig. 3.7) was placed at a preset distance from the target; the emission of shock–compressed plasma was registered through the obstacle with the aid of high–speed cameras or image converters. The escape of the shock wave from the target into the test gas leads to the appearance of luminescence which intensifies the moment the shock wave is reflected from the obstacle (determination of D), and disappears when the heavy contact interface arrives at the target (registration of u). In addition to shock compression parameters, the temperature of shock–compressed plasma was also recorded in a number of experiments using the brightness method.
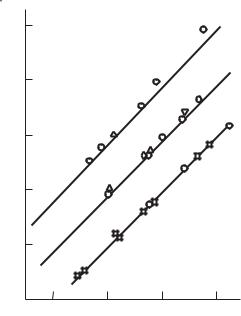
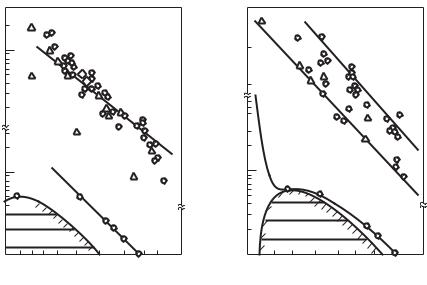
The results of recording the shock adiabats of argon and xenon in kinematic variables are illustrated in Fig. 3.8, where one can clearly see good agreement between the data obtained by the optical, electrocontact, and X–ray techniques in explosion shock tubes and step–wave generators using metals, polymers and condensed explosives as targets. The results obtained in determining the equation of state for nonideal argon plasma cover a wide range of parameters (Fig. 3.9), namely, p (0.3–40)·108 Pa, T (5.2–60)·103 K and ne 1014–3·1021 cm−3, which is characterized by developed ionization of α 3 and strong Coulomb interaction of Γ 0.01–5.2. It is interesting to note that in the experiments described above, the equation of state for a plasma with ρ 1.3 g cm−3, was studied. It exceeded the critical density of xenon. Note that under these conditions, the interaction proves so strong that it causes a perceptible shift and deformation of the energy levels in the plasma.
Investigations of the electron spectrum and equation of state for the plasma of argon and xenon of solid–state density, using a lightweight ballistic facility (Nellis et al. 1983) for shock–wave compression, were performed by Keeler, van Thiel, and Alder (1965), Ross, Nellis, and Mitchell (1979), and Nellis, van Thiel, and Mitchell (1982). In a two–stage light–gas “gun” (Fig. 3.10), powder gases
(1) resulting from the charge combustion accelerate a heavy piston (2) which moves in a chamber (3), having a length of 10 m and inside diameter of 90 mm on its inside, to compress hydrogen (4). Following the rupture of the diaphragm, expanding hydrogen acts to accelerate a light impactor (6), which measures 28 mm in diameter, in a 9 m long evacuated acceleration channel (5). In this manner, a highly symmetric “smooth” and heating–free acceleration of the impactor is e ected with a mass of about 20 g to velocities of 7–8 km s−1, which are somewhat higher than those attained in the case of plane propulsion in explosion devices such as those found in Fig. 3.7. The impact of the accelerated impactors leads to the generation in liquid argon, as well as in aluminum shields, of plane stationary shock waves whose velocities were registered by a system of electrocontact sensors with a time resolution of hundreds of picoseconds. These measurements were used by Keeler, van Thiel, and Alder (1965), Ross, Nellis, and Mitchell (1979), and Nellis, van Thiel, and Mitchell (1982), along with the regularities of disintegration of discontinuity on the “shield–plasma” interface and with the conservation laws (3.1), to obtain the equations of state for a highly compressed argon and xenon plasma at pressures of up to 0.13 TPa and maximum temperatures of up to
84 DYNAMIC METHODS IN THE PHYSICS OF NONIDEAL PLASMA
km s−1
u km s−1
Shock adiabats of argon and xenon (1, p0 = 0.78 · 105 Pa; 2, p0 = 5 · 105 Pa; 3, p0 = 106 Pa) registered using di erent techniques: 4, optical (Christian and Yarger 1955); 5, electrocontact (Fortov et al. 1976); 6, X–ray (Bespalov et al. 1975); 7, optical (Ebeling et al. 1991); 8, electrocontact and optical (Gryaznov et al. 1980); broken line, calculation by Gryaznov, Iosilevskii, and Fortov (1973). The numerals on the right indicate the values of shifts of each plot with respect to the front velocity D (km s−1); u, mass velocity.
30 000 K (ne 5.7 · 1022 cm−3). Under such conditions of high compression (maximum nuclear density of the order of 5.7·1022 cm−3), one observes a marked deformation of the electron energy spectrum of the plasma which causes a triple variation of pressure. In doing so, a considerable number of electrons are in a thermally excited state and, on the whole, a highly compressed plasma possesses “semiconductor properties” (Nellis et al. 1982).
Interesting results in the thermal physics of nonideal argon and xenon plasma were obtained in the facility for adiabatic compression. These were described by Hess (1989). At an initial pressure of about 2000 Pa, the test gas was compressed by a heavy (4.9 kg in mass) piston in a steel channel measuring 7.5 m long and 150 mm in diameter. The pressure of adiabatic compression was registered by a piezoelectric transducer and the compression ratio was defined by the position of the piston. In addition, an optical method was used to record the thermal radiation of the plasma. This provides information about the emission spectra and equilibrium temperature. Probe techniques were used to register the electrical
COMPRESSION OF INERT GASES BY POWERFUL SHOCK WAVES 85
Pa |
Pa |
a |
b |
|
. . |
cm3g−1 |
cm3g−1 |
Fig. 3.9. Phase diagram for argon (a) and xenon (b). The two–phase region boundaries and the critical point C are shown. Broken lines, isotherms of initial states. I and II, single and double ionization limits, respectively. Dots, results of dynamic experiments.
conductivity of the dense plasma. This unique facility helped to produce lower (as compared with shock wave generators) values of the plasma heating temperature T 14 000 K at a high pressure p of up to 14.5 GPa and electron number density ne of up to 1020 cm−3. This resulted in a considerable expansion of the experimentally accessible region of the phase diagram of the nonideal plasma. It also provided the possibility of checking on the validity of asymptotic theories.
Optical properties are of considerable interest from the standpoint of plasma physics. That is because they enable one to follow the e ect of nonideality on the dynamics and energy spectrum of electrons in a dense disordered medium. The plasma absorption coe cient κν was measured by registering the rise in time of the intensity of optical radiation, which emanates from a plane plasma layer enclosed between the shock front and contact surface (Model’ 1957; Bespalov et al. 1979b). In view of the small time of photon relaxation as compared with the characteristic gas–dynamic time, the spectral radiation intensity of such a layer, Jν (t), in a quasistationary approximation (Kirzhnits, Lozovik, and Shpatakovskaya 1975) takes the form
Jν (t) = Jν0(1 − exp{−κν (D − u) t}),
where Jν0 = Jν (∞) is the Planck radiation intensity, κν = κν (1 − e−hν/kT ) is the absorption coe cient corrected for induced radiation, and D and u are the rates
86 DYNAMIC METHODS IN THE PHYSICS OF NONIDEAL PLASMA
a
b
Fig. 3.10. Schematic of a two–stage ballistic facility (Nellis et al. 1983): a, prior to experiment; b, during experiment; 1, powder gases; 2, heavy piston; 3, high–pressure chamber; 4, hydrogen; 5, impactor; 6, acceleration channel; 7, sample.
of travel of the front and rear boundaries of the radiating layer, respectively. An important requirement of this technique is the provision of conditions of
one–dimensional and steady flow of plasma in the zone of recording. This enables one, when interpreting the measurement results, to use the simple relationship (3.6) instead of solving the integral–di erential equation of radiation transfer. During experiments by Bespalov et al. (1979b), these conditions were monitored by electrocontact and optical measurements, as well as by gas–dynamic calculations.
A facility utilizing explosion propulsion devices is shown schematically in Fig. 3.11. Light radiation emanating from a plasma is diverted with the aid of mirrors and optical system to polarization filters and photomultipliers. The respective signals are recorded by high–speed oscillographs. The kinetic parameters of the plasma, which are essential in determining the absorption coe cients, were determined by electrocontact and optical methods. The exit of the shock wave from the target and into argon led to a smooth rise (Fig. 3.11b) of light radiation until its saturation in accordance with Eq. (3.6). A flash–up of brightness marks the time (and, consequently, the velocity D) of the front arrival to a transparent obstacle. The subsequent radiation cuto is caused by the destruction of the obstacle by a massive target moving at a velocity u.
Note that such an organization of experiments enables one to obtain diversified physical information in a single experiment. The rise of intensity Jν (t) in the initial portion of flow determines, from Eq. (3.6), the light absorption coefficient, and the level of radiation at the stage of saturation, Jν (∞), determines the brightness temperature. The registration of shock wave reflection from the obstacle helps measure D and u which, with due regard for the conservation laws (3.1), is equivalent to direct measurements of pressure, density, and internal energy. Thus the data obtained are consistent and complement the results of
COMPRESSION OF INERT GASES BY POWERFUL SHOCK WAVES 87
 Gas
Gas
s
a |
b |
Fig. 3.11. Schematic illustrating the experiment in registering the absorption coe cient of shock–compressed plasma (Bespalov et al. 1979b): a, diagnostics; b, oscillogram; 1, detonation lens; 2, explosive charge; 3, impactor; 4, target; 5, transparent obstacle; 6, diaphragm; 7, mirror; 8, optical system; 9, semitransparent mirrors; 10, adjustment laser; 11, interference light filters; 12, photomultipliers; 13, oscillographs; 14, electrocontacts for measuring the shock velocity; 15, pulse-shaping circuit; 16, delay line; 17, electrocontacts for measuring the shock velocity; 18, oscillograph for measuring the shock velocity; 19, fast spectrometer; 20, system of digital spectrum processing; 21, shock wave entry into the gas; 22, zone of radiation rise; 23, shock wave collision with the obstacle; 4, beginning of the destruction of obstacle by the target material.
special thermodynamic measurements (Bespalov et al. 1975; Fortov et al. 1976; Gryaznov et al. 1980).
In order to reveal the compression e ects and to facilitate the interpretation of the results, the gas–dynamic characteristics of explosion generators were selected to provide for approximate constancy of the temperature of shock–compressed plasma, T 2 · 104 K. The measured coe cients of light absorption (an error of the order of 30–40%), with a frequency of (5.17 ± 0.05) · 1014 s−1, are presented in Fig. 8.13. Every experimental point is obtained by the averaging of five to ten experiments with two to three independent frequency recordings in every experiment. One can see that the measurement results cover a wide range of plasma compressions and are in reasonable agreement with the estimates of κν by Tsikulin and Popov (1977). Spectral measurements were made by Bespalov, Kulish and Fortov (1986) in argon plasma at T 1.74 · 104 K and electron densities up to 1.2·1019 cm−3. Higher ne broadening does not allow a separation of the spectral lines.
The foregoing method of registration of the absorption coe cient turns out to be restricted on the side of low plasma densities by the finite time of existence of the steady flow of plasma. Therefore, when registering low absorption coe cients, Bespalov et al. (1979a) performed a somewhat di erent version of

88 DYNAMIC METHODS IN THE PHYSICS OF NONIDEAL PLASMA
such experiments by involving the use of explosion shock tubes as the source of air plasma. A shock wave decay in such systems led to the emergence of a maximum for the relationship Jν (t) being registered. The position of the latter had helped to find the value of κν in every experiment and to evaluate the other parameters of shock compression on the basis of gas–dynamic data. The results obtained provided a basis for evaluating the photodisintegration cross–section of the negative ion of nitrogen.
The reflection of laser radiation from nonideal plasma yields interesting information on the physical properties of a shock–compressed medium, whereby one can study the high–frequency conductivity of this medium in the field of an electromagnetic wave. This method is fairly widely used in the physics of metals and semiconductors to determine the energy spectrum, concentration, and e ective mass of charge carriers. Of special interest is the region of resonance interaction, in which the incident electromagnetic wave of frequency ωλis comparable to the
plasma frequency ωp |
4π ne e2 |
. In this case, the resonance condition ω = ωp |
m |
corresponds to a strong reflection of incident radiation and defines the electron number density, and the dispersion of the reflection curve characterizes the losses of electron energy, thereby enabling one to find the electron collision frequency.
The experiments in measuring the reflection of laser radiation from nonideal plasma were performed by Zaporozhets, Mintsev and Fortov (1987) using explosion generators of square shock waves in the scheme of Fig. 3.11. The electron number density of xenon plasma was varied by varying the initial parameters of xenon, namely, p0 1–5.7 MPa, ρ0 = 0.06–0.8 g cm−3, and T0 = 270 K. In view of considerable proper thermal radiation of shock–compressed plasma with T 3 · 104 K, the probing pulse was developed by a pulsed (with τ 10−8 s) aluminum-garnet laser producing a high (T 6 · 107 K) spectral temperature and a small angular divergence of the light flux. The laser system was equipped with an electronically controlled Pockels shutter which enabled one to synchronize the explosion generation and laser probing with a di erence in time of not worse than 10−8 s. The sounding radiation was introduced into the explosion chamber by means of a special optical system and, after being reflected from shock–compressed matter, it was applied to fast photomultipliers equipped with interference filters with ∆λ 0.02 m. For the focal spot diameter of about 0.6 mm, the specific intensity of laser radiation in the shock wave front amounted to (1-7)·105 W cm−2, which is insu cient for substantial heating of matter.
The optical reflectivity of plasma R was determined by comparing the intensities of incident radiation with the radiation reflected to the aperture of the receiving ring–shaped lens. In order to perform an overall check on the procedure in the dynamic mode, experiments were carried out to register the coe cient R for shock–wave compressed carbon tetrachloride and silicon. The values obtained for R are in good agreement with the results of previous measurements in the region of the metal–dielectric transition. In each experiment, in order to determine the thermodynamic parameters of shock–compressed plasma, the electrocontact