

Mechanical_Intro_14.5_L11_Results
.pdfLecture 11
Results and Postprocessing
14.5 Release
Introduction to ANSYS Mechanical

 Chapter Overview
In this chapter controlling the display of results and the detection of potential results errors due to poor mesh quality will be covered:
A.Viewing Results
B.Legend Controls
C.Contour Controls
D.Postprocessing Utilities
E.Scoping Results
F.Linearized Stress
G.Exporting Results
H.Coordinate Systems
I.Error Estimation
J.Convergence
K.Stress Singularities
L.Convergence and Scoping
M.Workshop 11.1 – Results Processing
2 |
© 2012 ANSYS, Inc. |
December 19, 2012 |
Release 14.5 |

 A. Viewing Results
When selecting a results branch, the Context toolbar displays ways of viewing
results: |
|
Min/Max |
Probe |
|
|
|
|
Contour Settings |
|
Outline Display |
Displacement Scaling |
|
Display Method |
|
|
||
|
|
|
|
|
|
Vector Display Controls
In addition, the “Timeline” also has an animation toolbar which lets the user set animation controls
Distribute |
Export AVI |
Play |
Pause |
Markers |
Frame Rate Control |
Scale to Multisteps |
|
3 |
© 2012 ANSYS, Inc. |
December 19, 2012 |
Release 14.5 |
 … Viewing Results
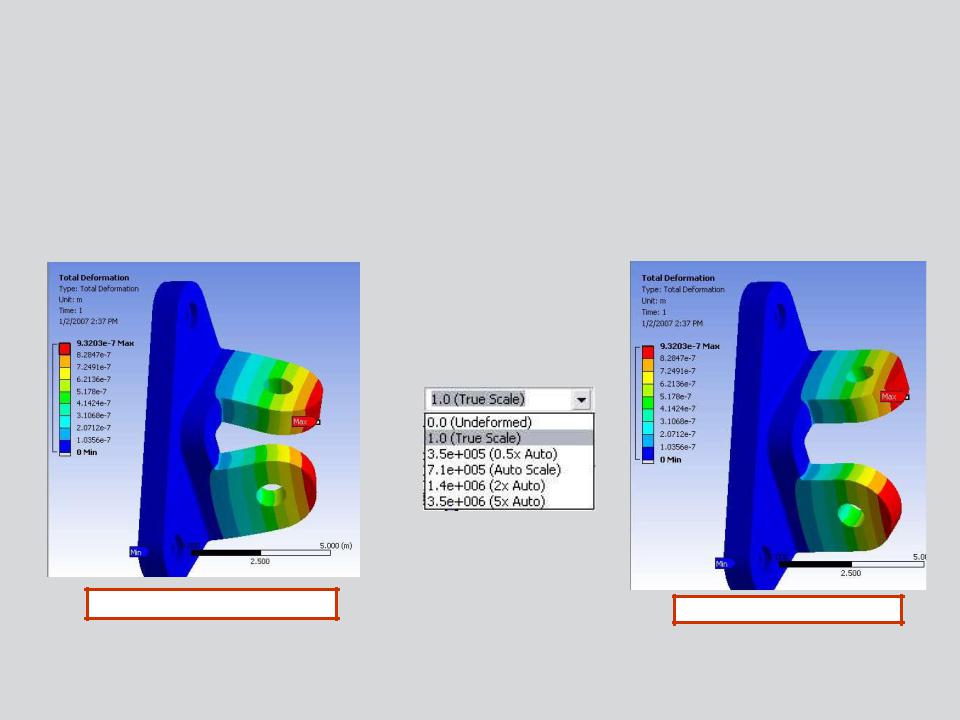
Displacement Scaling:
•In structural analysis a default scale factor “multiplies” actual displacements.
•The scale factor can be changed using several built in values or to a user specified one.
Automatic Displacement Scaling |
True Scale |
|
4 |
© 2012 ANSYS, Inc. |
December 19, 2012 |
Release 14.5 |

 B. Legend Controls
Right Clicking on the legend in the graphics area allows the user to modify the legend display.
|
|
|
|
Edit Value |
|
|
|
|
|
|
|
|
|
|
|
|
|
|
|
|
|
|
|
|
|
|
|
|
|
|
Export/Import/Switch to a saved legend setting |
||||
|
|
|
|
|
|
|
|
|
|
|
|
|
|
|
|
|
|
Increase/Decrease Contour Bands |
|
Horizontal/Vertical legend |
|
|
||||
|
|
|
|
|
|
|
|
|
|
|
|
|
|
|
|
||
|
|
|
|
Display Date/Time |
|
|
|
|
|
|
|
|
|
|
|
||
|
|
|
|
|
|
|||
|
|
|
|
Display Max/Min label on the legend |
|
|||
|
Switch to Logarithmic Scale |
|
|
|
||||
|
|
|
|
|
|
|
|
|
|
|
|
|
|
|
|
|
|
Switch to Scientific Notation
Number of Significant Digits
Continued . . .
5 |
© 2012 ANSYS, Inc. |
December 19, 2012 |
Release 14.5 |
 … Legend Controls
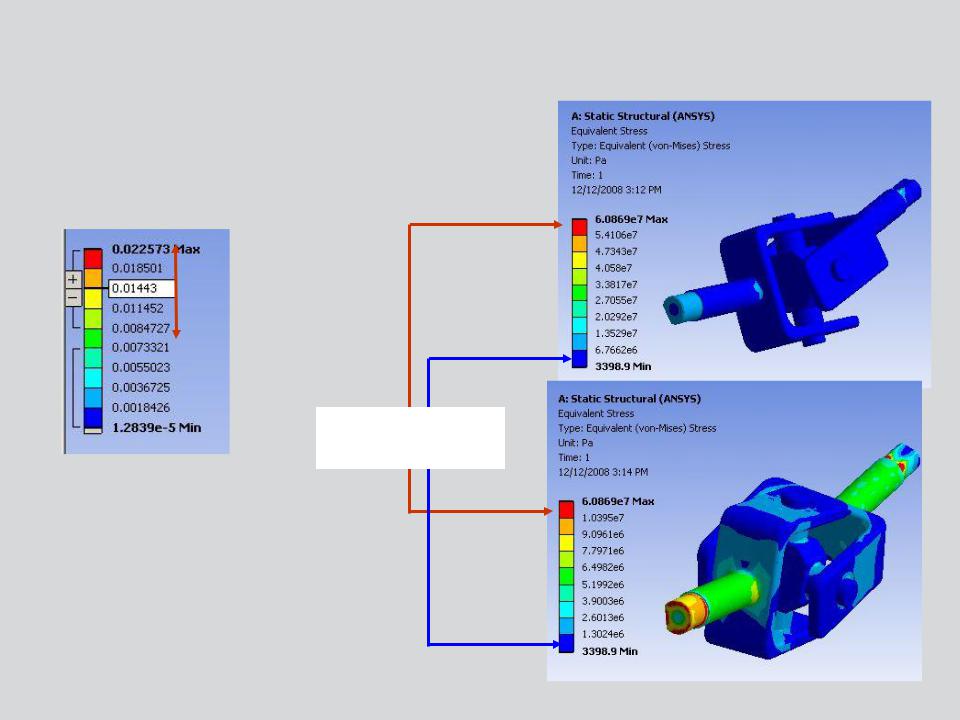
The legend bounds can be manipulated to show result distributions more clearly for contour plots.
Max/Min values are unchanged
Click and drag contour dividers (or type in values) to specify contour ranges.
6 |
© 2012 ANSYS, Inc. |
December 19, 2012 |
Release 14.5 |
 … Legend Controls
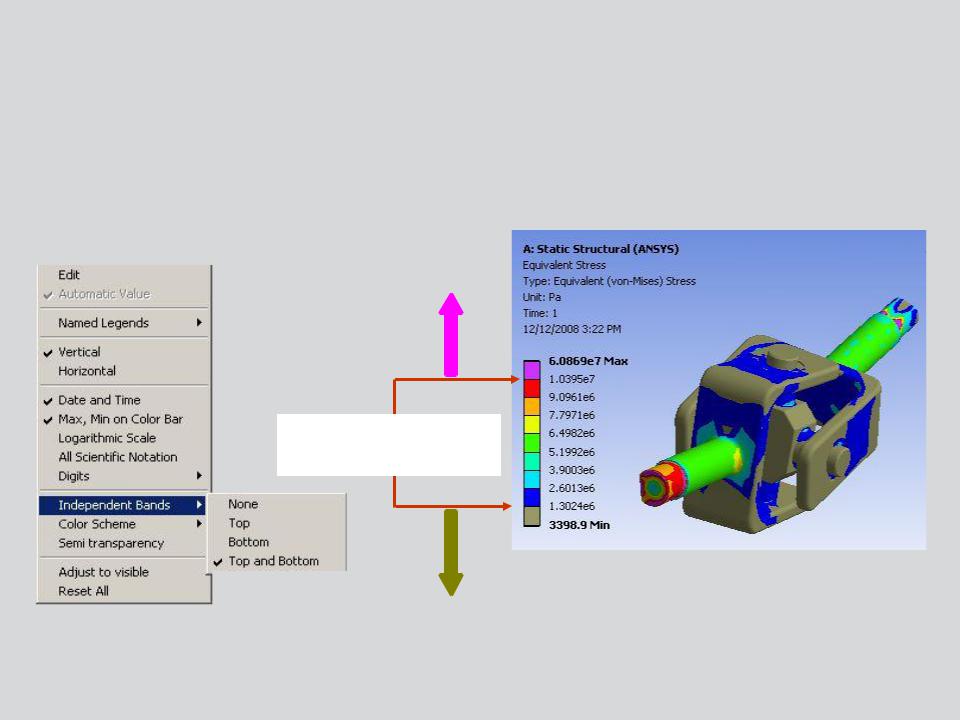
Independent Bands allow neutral colors to represent regions of the model above or below the specified legend limits.
Legend Contour
Range
7 |
© 2012 ANSYS, Inc. |
December 19, 2012 |
Release 14.5 |
 C. Contour Controls
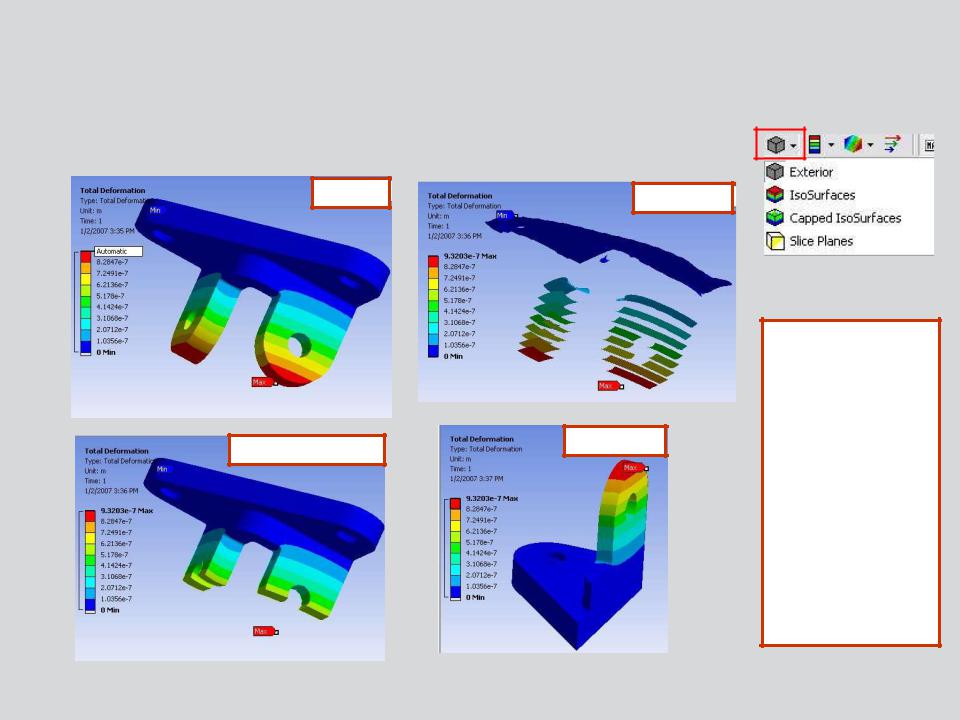
The “Geometry” icon controls the contour display method. Four choices are available:
Exterior |
IsoSurfaces |
|
Slice Planes
Capped IsoSurfaces
“Exterior” is the default display option and is most commonly used.
“IsoSurfaces” is useful to display regions with the same contour value.
“Capped IsoSurfaces” will remove regions of the model where the contour values are above (or below) a specified value.
“Slice Planes” allow a user to ‘cut’ through the model visually. A capped slice plane is also available, as shown on the left.
8 |
© 2012 ANSYS, Inc. |
December 19, 2012 |
Release 14.5 |

 … Contour Controls
Capped IsoSurfaces are manipulated by an independent controller:
•Icons allow isosurface cap to be top or bottom.
•The cap threshold can be controlled via the slider or by typing the value directly
Top Capped Isosurface |
|
Bottom Capped Isosurface |
|
|
|
9 |
© 2012 ANSYS, Inc. |
December 19, 2012 |
Release 14.5 |
 … Contour Controls
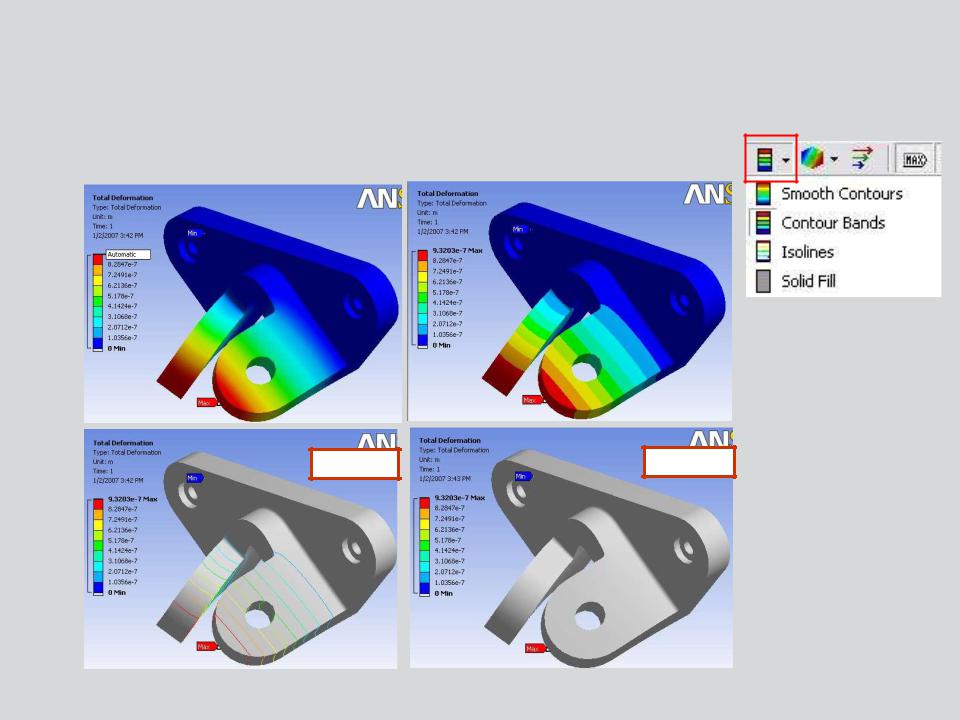
The “Contours” icon controls the style of color bands used when plotting results.
|
|
Contour Bands |
Smooth Contours |
|
|
|
|
|
Isolines |
Solid Fill |
10 |
© 2012 ANSYS, Inc. |
December 19, 2012 |
Release 14.5 |