

158 |
8 Evaluation in information retrieval |
|
1.0 |
|
|
|
|
|
|
0.8 |
|
|
|
|
|
Precision |
0.6 |
|
|
|
|
|
0.4 |
|
|
|
|
|
|
|
|
|
|
|
|
|
|
0.2 |
|
|
|
|
|
|
0.00.0 |
0.2 |
0.4 |
0.6 |
0.8 |
1.0 |
|
|
|
Recall |
|
|
|
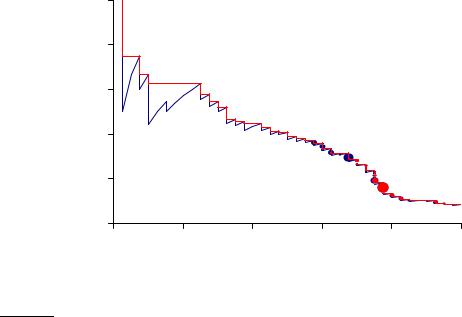
Figure 8.2 |
Precision/recall graph. |
|
|
|
|
|
Exercise 8.3 |
[ ] |
Derive the equivalence between the two formulas for F measure shown in Equation (8.5), given that α = 1/(β2 + 1).
8.4Evaluation of ranked retrieval results
PRECISION-RECALL
CURVE
INTERPOLATED PRECISION
Precision, recall, and the F measure are set-based measures. They are computed using unordered sets of documents. We need to extend these measures (or to define new measures) if we are to evaluate the ranked retrieval results that are now standard with search engines. In a ranked retrieval context, appropriate sets of retrieved documents are naturally given by the top k retrieved documents. For each such set, precision and recall values can be plotted to give a precision-recall curve, such as the one shown in Figure 8.2. Precision-recall curves have a distinctive saw-tooth shape: if the (k + 1)th document retrieved is nonrelevant then recall is the same as for the top k documents, but precision has dropped. If it is relevant, then both precision and recall increase, and the curve jags up and to the right. It is often useful to remove these jiggles and the standard way to do this is with an interpolated precision: the interpolated precision pinterp at a certain recall level r is defined
Online edition (c) 2009 Cambridge UP

8.4 Evaluation of ranked retrieval results |
159 |
Recall Interp.
Precision
0.01.00
0.10.67
0.20.63
0.30.55
0.40.45
0.50.41
0.60.36
0.70.29
0.80.13
0.90.10
1.00.08
Table 8.1 Calculation of 11-point Interpolated Average Precision. This is for the precision-recall curve shown in Figure 8.2.
(8.7)
11-POINT INTERPOLATED AVERAGE PRECISION
MEAN AVERAGE
PRECISION
as the highest precision found for any recall level r′ ≥ r:
pinterp(r) = max p(r′) r′≥r
The justification is that almost anyone would be prepared to look at a few more documents if it would increase the percentage of the viewed set that were relevant (that is, if the precision of the larger set is higher). Interpolated precision is shown by a thinner line in Figure 8.2. With this definition, the interpolated precision at a recall of 0 is well-defined (Exercise 8.4).
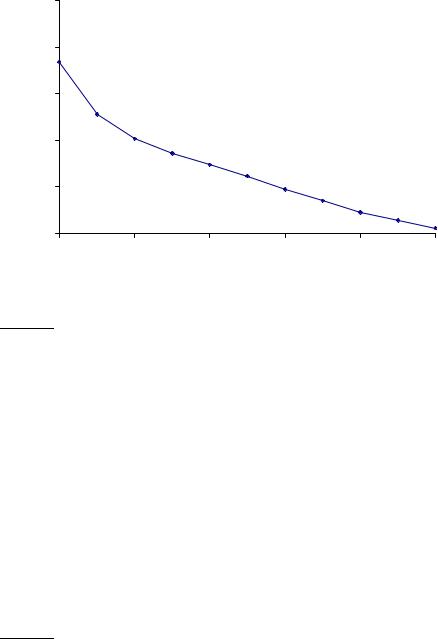
Examining the entire precision-recall curve is very informative, but there is often a desire to boil this information down to a few numbers, or perhaps even a single number. The traditional way of doing this (used for instance in the first 8 TREC Ad Hoc evaluations) is the 11-point interpolated average precision. For each information need, the interpolated precision is measured at the 11 recall levels of 0.0, 0.1, 0.2, . . . , 1.0. For the precision-recall curve in Figure 8.2, these 11 values are shown in Table 8.1. For each recall level, we then calculate the arithmetic mean of the interpolated precision at that recall level for each information need in the test collection. A composite precisionrecall curve showing 11 points can then be graphed. Figure 8.3 shows an example graph of such results from a representative good system at TREC 8.
In recent years, other measures have become more common. Most standard among the TREC community is Mean Average Precision (MAP), which provides a single-figure measure of quality across recall levels. Among evaluation measures, MAP has been shown to have especially good discrimination and stability. For a single information need, Average Precision is the
Online edition (c) 2009 Cambridge UP
160 |
8 Evaluation in information retrieval |
|
1 |
|
|
|
|
|
|
|
0.8 |
|
|
|
|
|
|
Precision |
0.6 |
|
|
|
|
|
|
0.4 |
|
|
|
|
|
|
|
|
|
|
|
|
|
|
|
|
0.2 |
|
|
|
|
|
|
|
0 |
0 |
0.2 |
0.4 |
0.6 |
0.8 |
1 |
|
|
|
|
|
Recall |
|
|
Figure 8.3 Averaged 11-point precision/recall graph across 50 queries for a representative TREC system. The Mean Average Precision for this system is 0.2553.
average of the precision value obtained for the set of top k documents existing after each relevant document is retrieved, and this value is then averaged over information needs. That is, if the set of relevant documents for an information need qj Q is {d1, . . . dmj } and Rjk is the set of ranked retrieval results from the top result until you get to document dk, then
|
|
1 |
|Q| |
1 |
mj |
(8.8) |
MAP(Q) = |
|
∑ |
|
∑ Precision(Rjk) |
|Q| |
|
||||
|
|
j=1 mj k=1 |
|||
When a relevant document is not retrieved at all,1 the precision value in the above equation is taken to be 0. For a single information need, the average precision approximates the area under the uninterpolated precision-recall curve, and so the MAP is roughly the average area under the precision-recall curve for a set of queries.
Using MAP, fixed recall levels are not chosen, and there is no interpolation. The MAP value for a test collection is the arithmetic mean of average
1. A system may not fully order all documents in the collection in response to a query or at any rate an evaluation exercise may be based on submitting only the top k results for each information need.
Online edition (c) 2009 Cambridge UP
|
8.4 Evaluation of ranked retrieval results |
161 |
|
precision values for individual information needs. (This has the effect of |
|
|
weighting each information need equally in the final reported number, even |
|
|
if many documents are relevant to some queries whereas very few are rele- |
|
|
vant to other queries.) Calculated MAP scores normally vary widely across |
|
|
information needs when measured within a single system, for instance, be- |
|
|
tween 0.1 and 0.7. Indeed, there is normally more agreement in MAP for |
|
|
an individual information need across systems than for MAP scores for dif- |
|
|
ferent information needs for the same system. This means that a set of test |
|
|
information needs must be large and diverse enough to be representative of |
|
|
system effectiveness across different queries. |
|
PRECISION AT k |
The above measures factor in precision at all recall levels. For many promi- |
|
|
nent applications, particularly web search, this may not be germane to users. |
|
|
What matters is rather how many good results there are on the first page or |
|
|
the first three pages. This leads to measuring precision at fixed low levels of |
|
|
retrieved results, such as 10 or 30 documents. This is referred to as “Precision |
|
|
at k”, for example “Precision at 10”. It has the advantage of not requiring any |
|
|
estimate of the size of the set of relevant documents but the disadvantages |
|
|
that it is the least stable of the commonly used evaluation measures and that |
|
|
it does not average well, since the total number of relevant documents for a |
|
|
query has a strong influence on precision at k. |
|
R-PRECISION |
An alternative, which alleviates this problem, is R-precision. |
It requires |
|
having a set of known relevant documents Rel, from which we calculate the |
|
|
precision of the top Rel documents returned. (The set Rel may be incomplete, |
|
|
such as when Rel is formed by creating relevance judgments for the pooled |
|
|
top k results of particular systems in a set of experiments.) R-precision ad- |
|
|
justs for the size of the set of relevant documents: A perfect system could |
|
|
score 1 on this metric for each query, whereas, even a perfect system could |
|
|
only achieve a precision at 20 of 0.4 if there were only 8 documents in the |
|
|
collection relevant to an information need. Averaging this measure across |
|
|
queries thus makes more sense. This measure is harder to explain to naive |
|
|
users than Precision at k but easier to explain than MAP. If there are |Rel| |
|
|
relevant documents for a query, we examine the top |Rel| results of a sys- |
|
|
tem, and find that r are relevant, then by definition, not only is the precision |
|
|
(and hence R-precision) r/|Rel|, but the recall of this result set is also r/|Rel|. |
|
BREAK-EVEN POINT Thus, R-precision turns out to be identical to the break-even point, another measure which is sometimes used, defined in terms of this equality relationship holding. Like Precision at k, R-precision describes only one point on the precision-recall curve, rather than attempting to summarize effectiveness across the curve, and it is somewhat unclear why you should be interested in the break-even point rather than either the best point on the curve (the point with maximal F-measure) or a retrieval level of interest to a particular application (Precision at k). Nevertheless, R-precision turns out to be highly correlated with MAP empirically, despite measuring only a single point on
Online edition (c) 2009 Cambridge UP
162 |
8 Evaluation in information retrieval |
|
1.0 |
|
|
|
|
|
|
recall) |
0.8 |
|
|
|
|
|
|
0.6 |
|
|
|
|
|
|
|
( = |
|
|
|
|
|
|
|
|
|
|
|
|
|
|
|
sensitivity |
0.4 |
|
|
|
|
|
|
0.2 |
|
|
|
|
|
|
|
|
|
|
|
|
|
|
|
|
0.0 |
0 |
0.2 |
0.4 |
0.6 |
0.8 |
1 |
|
|
|
|
1 − specificity |
|
|
|
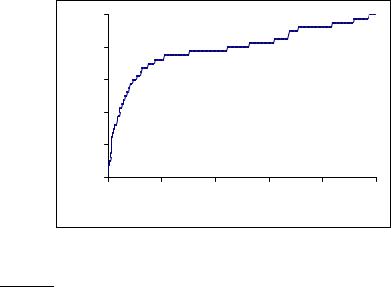
Figure 8.4 The ROC curve corresponding to the precision-recall curve in Figure 8.2.
.
the curve.
ROC CURVE Another concept sometimes used in evaluation is an ROC curve. (“ROC” stands for “Receiver Operating Characteristics”, but knowing that doesn’t help most people.) An ROC curve plots the true positive rate or sensitiv-
SENSITIVITY ity against the false positive rate or (1 − specificity). Here, sensitivity is just another term for recall. The false positive rate is given by f p/( f p + tn). Figure 8.4 shows the ROC curve corresponding to the precision-recall curve in Figure 8.2. An ROC curve always goes from the bottom left to the top right of the graph. For a good system, the graph climbs steeply on the left side. For
SPECIFICITY unranked result sets, specificity, given by tn/( f p + tn), was not seen as a very useful notion. Because the set of true negatives is always so large, its value would be almost 1 for all information needs (and, correspondingly, the value of the false positive rate would be almost 0). That is, the “interesting” part of Figure 8.2 is 0 < recall < 0.4, a part which is compressed to a small corner of Figure 8.4. But an ROC curve could make sense when looking over the full retrieval spectrum, and it provides another way of looking at the data. In many fields, a common aggregate measure is to report the area under the ROC curve, which is the ROC analog of MAP. Precision-recall curves are sometimes loosely referred to as ROC curves. This is understandable, but not accurate.
A final approach that has seen increasing adoption, especially when employed with machine learning approaches to ranking (see Section 15.4, page 341)
CUMULATIVE GAIN is measures of cumulative gain, and in particular normalized discounted cumu-
NORMALIZED
DISCOUNTED CUMULATIVE GAIN
Online edition (c) 2009 Cambridge UP

NDCG
(8.9)
?
DICE COEFFICIENT
8.4 Evaluation of ranked retrieval results |
163 |
lative gain (NDCG). NDCG is designed for situations of non-binary notions of relevance (cf. Section 8.5.1). Like precision at k, it is evaluated over some number k of top search results. For a set of queries Q, let R(j, d) be the relevance score assessors gave to document d for query j. Then,
NDCG(Q, k) = |
1 |
|Q| |
k |
2 |
R(j,m) |
− 1 |
, |
∑ Zkj ∑ |
|
||||||
|Q| |
|
|
|||||
|
j=1 |
m=1 log2(1 + m) |
|
||||
where Zkj is a normalization factor calculated to make it so that a perfect ranking’s NDCG at k for query j is 1. For queries for which k′ < k documents are retrieved, the last summation is done up to k′.
Exercise 8.4 |
[ ] |
What are the possible values for interpolated precision at a recall level of 0? |
|
Exercise 8.5 |
[ ] |
Must there always be a break-even point between precision and recall? Either show there must be or give a counter-example.
Exercise 8.6 |
[ ] |
What is the relationship between the value of F1 and the break-even point? |
|
Exercise 8.7 |
[ ] |
The Dice coefficient of two sets is a measure of their intersection scaled by their size (giving a value in the range 0 to 1):
Dice(X, Y) = 2|X ∩ Y|
|X| + |Y|
Show that the balanced F-measure (F1) is equal to the Dice coefficient of the retrieved and relevant document sets.
Exercise 8.8 |
[ ] |
Consider an information need for which there are 4 relevant documents in the collection. Contrast two systems run on this collection. Their top 10 results are judged for relevance as follows (the leftmost item is the top ranked search result):
System 1 |
R N R N |
N |
N N N |
R R |
System 2 |
N R N N |
R |
R R N |
N N |
a.What is the MAP of each system? Which has a higher MAP?
b.Does this result intuitively make sense? What does it say about what is important in getting a good MAP score?
c.What is the R-precision of each system? (Does it rank the systems the same as MAP?)
Online edition (c) 2009 Cambridge UP