

11 Dose
Contents
11.1 Introduction . . . . . . . . . . . . . . . . . . . . . . . . . . . . . . . . . . . . . . . . . . . . . . . . . . . . . . . 485
11.2 Energy Dose, Equivalent Dose, and E ective Dose . . . . . . . . . . . . . . . . . . . . . . . . . . . 486
11.3 Definition of Specific CT Dose Measures . . . . . . . . . . . . . . . . . . . . . . . . . . . . . . . . . . 487
11.4 Device-Related Measures for Dose Reduction . . . . . . . . . . . . . . . . . . . . . . . . . . . . . . . 493 11.5 User-Related Measures for Dose Reduction . . . . . . . . . . . . . . . . . . . . . . . . . . . . . . . . . 499
11.1 Introduction
The gain in diagnostically valuable information accompanying the advent of computed tomography (CT) was considered to be exceptional. This is one of the main reasons why the applied dose was not considered to be of vital importance during this developmental stage. Based on the number of devices currently installed in Germany and an average of , examinations per year, an annual total number of several hundreds of millions of slices can be estimated to be acquired each year. This approximately lies within the same range as the total number of standard projection radiographs acquired in clinical practice. Considering the di erent types of radiological examinations (X-ray examinations), one immediately becomes aware of the following discrepancy. Although CT examinations represent only about % of all radiological examinations, their share of the total dose amounts up to approximately %. In short, CT accounts for the largest portion of medically related X-ray exposure.
Considering new generations of CT scanners, such as spiral multislice CT, the applied dose indeed is not reduced. In fact, it is more likely that the amount of dose applied during one single imaging session will increase. This is mainly due to the fact that in modern scanners longer sequences and thinner slices can be easily measured (Nagel ). Initiated by reports about unnecessarily high X-ray exposure in pediatric CT examinations (Sternberg ), which were actually performed on the basis of the same scanning protocols as were used in human adults, a high sensibility concerning the applied dose has emerged among both manufacturers and users. Recent developments such as automatic exposure control, take the problem

11.3 Definition of Specific CT Dose Measures |
|
Table . . Weighting factors (wR ) for di erent radiation types (ICRP )
Radiation type and energy range |
|
|
Radiation weighting factor wR |
Photons (all energies) |
|
|
|
Electrons und muons (all energies) |
|
|
|
Neutrons |
E < keV |
keV |
|
|
keV < E |
|
|
|
keV < E MeV |
|
|
|
MeV < E |
MeV |
|
|
E MeV |
|
|
Protons (other than recoil protons) E MeV |
|
||
α-Particles, fission fragments, heavy nuclei |
|
|
|
Table . . Tissue weighting factors to be used for calculation of the e ective dose (ICRP
) |
|
|
|
Tissue or organ |
Tissue weighting factor (wT ) |
Gonads |
. |
Bone marrow (red) |
. |
Colon |
. |
Lung |
. |
Stomach |
. |
Bladder |
. |
Breast |
. |
Liver |
. |
Esophagus |
. |
Thyroid |
. |
Skin |
. |
Bone surface |
. |
Remainder |
. |
|
|
11.3
Definition of Specific CT Dose Measures
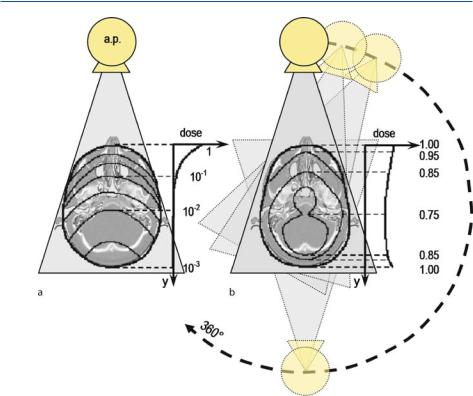
The spatial dose distribution in CT fundamentally di ers from the one observed in traditional projection radiography. Figure . a provides an illustration of the resulting relative iso-dose lines as seen in an anterior posterior projection radiograph of a skull. Since tissue attenuates the penetrating X-ray beam, the dose decreases continuously along the y-axis, i.e., from the tube-adjacent side toward its opposite side. As a result of Beer–Lamberts law the applied dose decreases exponentially. In contrast, Fig. . b provides the iso-dose lines resulting from a CT of the same skull. Here, the object is X-rayed from all sides, so that the resulting dose distri-
11 Dose
Fig. . . Illustration of the spatial dose distribution. Isodose lines are drawn onto a cranial slice for a normal projection radiography and b CT
bution is almost homogeneous inside the skull. Of course, every single projection yields exactly the same spatial dose distribution as seen in conventional projection X-ray imaging with respect to the direction of the X-ray radiation. However, due to the accumulation across all angles the spatial exposure in total is almost homogeneous.
Additionally, a di erence in the simultaneously irradiated volume can be observed. If the CT acquisition is limited by means of collimation to one single slice, the patient is primarily just irradiated in this respective layer with a thickness of only a few millimeters. Figure . a shows the dose profile for one single slice given a nominal slice thickness of d = mm. It immediately becomes apparent that the measured dose profile does not conform to an ideal rectangular function. Therefore, even outside the slice adjusted by means of collimation, the dose is applied to the patient. The main reason for this is the scattered radiation being produced in the respective layer. Typically, the nominal thickness of a layer is within the range of the full width at half maximum (FWHM) of the dose profile. Considering the total amount of dose, the additional dose applied by scattered radiation outside the X-ray fan beam must not be neglected. These circumstances are taken into account


11.3 Definition of Specific CT Dose Measures |
|
Occasionally, CTDI values found in technical datasheets of CT devices are given for a certain current–time product
The quantity |
Q = I ċ t . |
( . ) |
|
|
n CTDIx yz = |
CTDIx yz |
( . ) |
|
Q |
||
is called the normalized CTDI value. This is a device-specific constant for the dose rate, which on its own does not allow any statement about the radiation exposure.
Another interesting dose quantity is the so-called organ dose
Dorg = |
absorbed energy |
|
organ mass . |
( . ) |
Here, the absorbed energy is referred to the mass of the organ. The dose D, as well as all of the above-mentioned values derived from it, are measured in units of Gray [D] = J kg = Gy. This quantity can be defined by means of tabulated conversion factors from the dose free-in-air on the system axis
|
f (organ, z) . |
|
Dorg = p CTDIair z |
( . ) |
Therewith, the dose free-in-air on the system axis CTDIair is defined analogously to ( . ), thus
CTDIair = d ∫ Ka(z)dz . ( . )
− mm
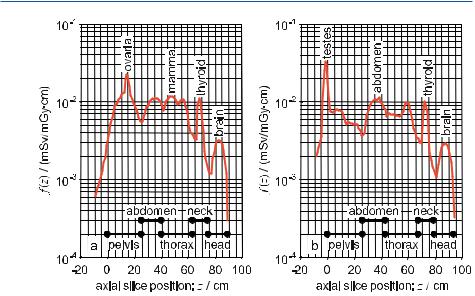
The table by Zankl et al. ( ), which is used in Germany, contains conversion factors separated according to gender. The conversion factors are graphically illustrated in Fig. . , as observed in a patient along a patient’s axial direction.
The relevance of the organ dose lies in the fact that one can estimate the probability of a radiation-induced cancer of the organ from the multiplication of the organ dose by the corresponding risk factor.
At this point a new value has to be introduced, which describes the entire amount of radiation exposure of a complete CT examination with for instance adjacent slices being acquired. The question regarding the applied dose in the case of slices in relation to the measurement of one single slice is frequently answered incorrectly, because, surprisingly, the dose remains the same. That is to say, the term dose has, according to the definition given in ( . ), the meaning of a density. The mass density does not increase proportionally along with an enlargement of the considered volume. In order to quantify the total e ect of the radiation of n slices, the so-called dose length product (DLP) is introduced.
DLPw = CTDIw,eff ċ p ċ n ċ d . |
( . ) |
Here, d is given in centimeters, so that the unit of the DLP is [DLPw] = Gy ċ cm.
11 Dose
Fig. . . Conversion factor f per cm slice thickness from CTDIair to an e ective dose for normal weight adults: a female, b male. Tube voltage: Uref = kV; -mm Al filter equivalent (courtesy of Nagel [ ])
By taking advantage of the DLP the e ective dose defined in ( . ) can be estimated in a simplified form by
E = DLPair ċ faverage . |
( . ) |
||
Therefore, the DLP free-in-air on the system axis is composed of |
|
||
DLPair = |
CTDIair |
|
|
|
DLPw . |
( . ) |
|
CTDIw,X |
|||
Table . . Average conversion factor faverage (in mSv/mGy ċcm) from DLP based on CTDIair to e ective dose for normal weight adults: Female, male. Tube voltage: Uref = kV; -mm Al filter equivalent (courtesy of Nagel [ ])
|
|
|
Body region |
Female (faverage) |
Male (faverage) |
Head |
. |
. |
Neck |
. |
. |
Thorax |
. |
. |
Upper abdomen |
. |
. |
Pelvis |
. |
. |
Complete abdomen |
. |
. |
|
|
|

11.4 Device-Related Measures for Dose Reduction |
|
The subscript X in ( . ) refers to the employed body phantom ( -cm head phantom or -cm torso phantom). The average values of the conversion factors with respect to di erent anatomical areas, a tube reference voltage of Uref = kV and a -mm Al filter equivalent (see Fig. . ) are summarized in Table . .
11.4
Device-Related Measures for Dose Reduction
In Sect. . . it has already been discussed that dose and image quality are closely related to each other. Thereby, the formula of Brooks and DiChiro ( ) is frequently quoted, according to which this relation is given by
D |
B |
|
|
σ ċ b ċ |
ξ ċ d . |
( . ) |
|
B = exp(Lμ) is the object’s mean attenuation factor, where L denotes the thickness of the object and σ describes the noise, i.e., the variance, of the image values. b is the sampling distance given at the rotation center, ξ the width of the detector element, and d the slice thickness. Sophisticated scanners take advantage of this connection in such a way that the anode current and therefore, the dose, are dynamically adapted to the respective anatomical range, such that the resulting total dose can be lowered whilst preserving the signal-to-noise ratio. Thereby, one basically takes advantage of the relation D B (at a constant SNR). The three concepts – automatic exposure control, longitudinal dose modulation, and angular dose modulation, all of which are described in the following – are based on this idea.
Figure . schematically illustrates that one initially has to di erentiate patients according to their physique and between infants and adults respectively. If we adjust the same tube current–time product for infants (small values for L in ( . )), as used in scan protocols for adults (Fig. . left), the obtained intensity of the X-ray at the detector and thus the applied dose, with respect to the achievable diagnostic quality (i.e., the SNR = μ σ), is too high. Therefore, in the case of a pediatric examination, it indeed is reasonable to decrease the anode current to a level that allows a comparable diagnostic quality to be obtained, as achieved in the examination of an adult (Fig. . , right). The automatic exposure control (AEC) can be steered by means of the scanogram.
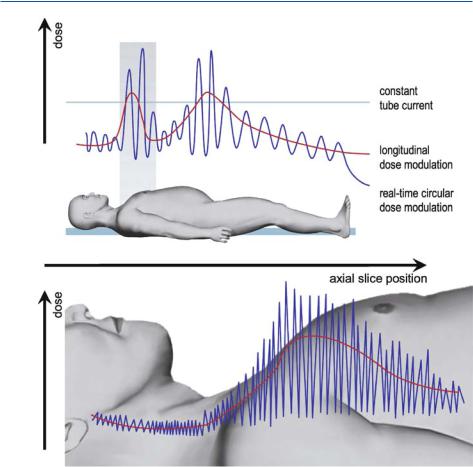
Figure . provides an illustration of the dynamic adaptation of tube current or dose respectively with respect to the anatomical situation observed along the axial z-axis (longitudinal dose modulation). In anatomical areas in which, as known a priori, a small attenuation of the X-ray intensity is to be expected (as for example within the lung area) the tube current and thus the dose can be lowered, without impairing the image quality. If all areas are operated on with the same tube current, this will either result in dose rates that are too high or noise levels that are too strong.
Figure . illustrates the dynamic adaptation of the tube current across the projection angle γ to the integral attenuation of the radiated body area (angular dose

11.4 Device-Related Measures for Dose Reduction |
|
Fig. . . The angular dose modulation is a dynamic adaptation of the tube current or dose to the shape of the axial body section. Especially in neck, thorax or abdomen imaging, the attenuation of X-ray intensity in the anterior–posterior direction is lower than the attenuation in the lateral direction. With an angular modulation of the tube current the signal level at the detector can be held constant
modulation). At all sections through the body, which are oval rather than circular, the angular dose modulation is to be applied. In particular for image acquisitions of the shoulder, a strong dose modulation is to be used.
Figure . shows the e ect of the combination of longitudinal and angular dose modulation on the attenuation of the X-ray beams and on the tube current. At conventional scan protocols with a constant tube current along the patient’s axial direction, the dose is usually selected in such a way that all anatomical areas with a good signal-to-noise-ratio are measured. This adjustment of the tube current, however, is oversized for most slice positions. In Fig. . , one easily can recognize that only in the shoulder and in the pelvic areas is it necessary to employ a higher incoming intensity due to the fact that the attenuation is higher in these areas. This is implemented by means of a longitudinal dose modulation. Furthermore, it is possible to decrease the mean dose, provided that the di erences in attenuation between frontal and lateral radiation are considered. At additional angular dose modulation, it is even possible to temporarily increase the dose during lateral radiation compared with conventional scan protocols. Overall, this allows an enhancement of the image quality whilst simultaneously reducing the overall dose applied.
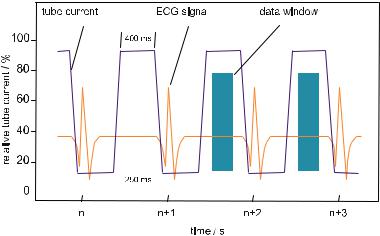
Another possibility for dose reduction arises in cardiac imaging. In Fig. . a trigger sequence of an ECG-triggered image acquisition of the heart is depicted. Since data are only acquired within the resting phase of the beating heart, the overall amount of the dose can be significantly reduced, provided that the tube current is switched o outside the data window. This e ective and e cient procedure is called temporal dose modulation.
11 Dose
Fig. . . Combination of longitudinal and angular dose modulation (courtesy of Siemens Medical Solutions)
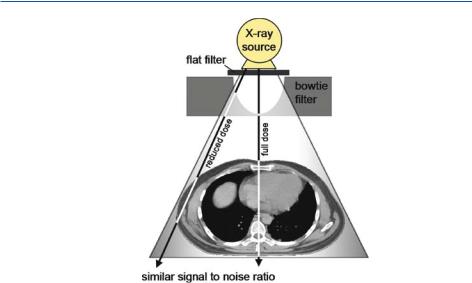
In Fig. . two other e cient methods of device-operated dose reduction are provided. First, a flat metal filter, which is installed directly behind the X-ray tube, allows the absorption of low-energy radiation present in the polychromatic X-ray spectrum. Since the soft X-ray beam passing through the patient is attenuated more strongly than the hard X-ray beam, its contribution to the overall dose is relatively high – this is distressing since its contribution to the imaging result is quite small. Due to its low energy, it is absorbed in the patient and therefore does not reach the detector. This part of the X-ray spectrum correspondingly only contributes to an increase in patient dose, without improving the image quality. Therefore, DINdemands at least a minimal value of the total filtering of . mm Al for CT. Another advantage of this filter is the reduction of beam-hardening artifacts (cf.Sect. . . ). However, as a general rule, employing stronger filters will coevally
|
|
|
|
11.4 Device-Related Measures for Dose Reduction |
|
|
|
|
|
|
|
|
|
|
|
|
|
|
|
|
|
|
|
|
|
|
|
|
|
|
|
|
|
|
|
|
|
|
|
|
|
Fig. . . The temporal dose modulation is an ECG triggered switching of either the tube current or the dose. In cardiac imaging, best results are achieved when projection data are acquired in the diastolic phase of the cardiac cycle. The dose can be reduced considerably if the tube is switched o outside the data window (Nagel )
reduce the contrast and, moreover, result in higher noise due to the fact that less radiation reaches the detector. In order to compensate for the loss of contrast-to- noise-ratio, an increase in the mAs product is necessary. This in turn counteracts the positive e ects arising from the reduced radiation exposure of the patient by means of filtering (Hidajat ). Therefore, it is necessary to cope with a trade-o between dose reduction and contrast-to-noise ratio, both of which are directly related to the e ects of filtering, as already mentioned above. Modern devices are frequently equipped with a source filter of – mm Al and, device-specific, an additional filter of . mm Cu. The overall filtering therefore amounts to approximately – mm Alequivalent (Hidajat ).
Using a specially shaped filter, called a bowtie filter, it can be considered in a second step that the total distances covered by beams of the X-ray fan passing through the patient’s body di er from each other. The white lines in Fig. . schematically illustrate that the covered distance through the patient at the border of the fan is typically shorter than in the center. This o ers the chance to reduce the dose of the rays situated at the border of the fan via a gradual attenuation in so far as the signal-to-noise-ratio is comparable across the entire fan beam. The bowtie filter also allows optimization of the requirements for the dynamic range of the detector system. In order to create absorption behavior comparable to that observed in the anatomy, specially shaped filters often consist of plastic or other materials with a lower atomic number Z. Some devices work with di erently shaped filters according to the anatomical area to be examined (Hidajat ).
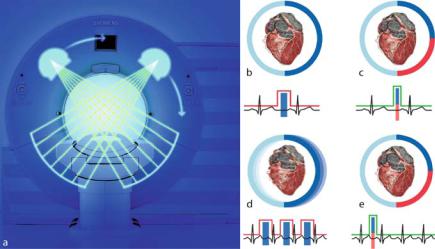
Figure . a shows a recent development in the field, the so-called dual-source CT. Two complete sampling units, both of which consist of an X-ray tube and a de-
11 Dose
Fig. . . With a flat metal filter a low-energy X-ray is attenuated. In a second step, a socalled bowtie filter leads to a spatially increasing attenuation from the center to the border of the X-ray fan
tector array, are installed perpendicular to each other. Best images of the beating heart are obtained when the acquisition interval is set to the diastolic phase. Since the patients are usually agitated, this resting phase of the heart is often so short that motion artifacts are inevitable.
In Fig. . b it is schematically shown that images have to be acquired across, in order to obtain a complete raw data set within the relatively short resting phase of the heart. Figure . c depicts that by employing a sampling unit taking advantage of the dual-source technology, only a rotation about is necessary. Thereby, the sampling time is halved, such that motion artifacts are significantly reduced. If one wants to abandon the administration of beta blockers, which are used to lower the pulse, an artifact-free image reconstruction by means of a singlesource scanner is no longer possible. Figure . d schematically depicts that singlesource scanners in this case must employ multi-segment protocols with a high dose. Here the strength of the halved acquisition time (cf. Fig. . e) becomes apparent. Using these modern dual-source subsecond scanners a temporal resolution can be achieved, which only di ers by a factor of from the acquisition speed achieved by electron-beam CT (cf. Chap. ). Considering the applied dose, the ECG-supported triggering of the acquisition window – a principle that already has been discussed in Fig. . – is of great importance. Here, compared with the standard CT scan protocol in which the tube current is not modulated, a dose reduction of up to % can be achieved.
At this point it must be noted that for the calculation of the e ective dose, device-specific correction factors have to be introduced, if one does not accept es-
11.5 User-Related Measures for Dose Reduction |
|
Fig. . . Dual-source CT consists of two independent sampling units. a A second X-ray tube and a second detector array has been added perpendicular to the first sampling unit. b–e Especially in cardiac imaging, it is of great significance for simultaneous data acquisition to double the temporal resolution (courtesy of Siemens Medical Solutions)
timation errors of up to %. The values for the conversion factors as given in Fig. . refer to devices, that are operated with a reference voltage of Uref = kV and are employed with a radiation filtering of a -mm Al-equivalent. Furthermore, it is assumed that no special shaped filters are installed and that the focus center distances are approximately – cm. Since these assumptions are by no means representative, ( . ) has to be corrected via
E = DLPair ċ faverage ċ kCT . |
( . ) |
An overview of the device-specific correction factors kCT can be found in Nagel ( ).
11.5
User-Related Measures for Dose Reduction
Apart from device-related measures for the reduction of radiation exposure, for which the manufacturers bear responsibility, there is a set of user-related measures, which also a ect the applied dose. The quantities and their connection to the dose, adjustable in the scan protocol, are given in the following. For a detailed discussion on the radiation exposure in CT, one is referred to the book by Nagel ( ).
•Current–time product (mAs product): Dose and mAs product, i.e., the product between the X-ray tube current and acquisition time, has a linear depend-

11 Dose
ency. However, the standard deviation, i.e., the image noise, increases inversely proportional to the root of the mAs product.
•Acquisition time: At constant X-ray tube current, the dose increases linearly along with the acquisition time. However, the mAs product is always to be considered as a total, so that at a constant dose the acquisition time can be reduced along with simultaneously increasing the tube current. Thereby, the image noise is una ected; however, motion artifacts are less likely to occur at short acquisition times.
•Tube voltage: With an increasing tube voltage, UB, the e ciency of the X-ray tube as well as the penetration of the radiation is increased. The intensity of the radiation increases with UB on average by the power of . . With a larger penetration of the radiation, the image contrast obviously decreases. However, this is more than compensated for by the better quantum statistics. Therefore, the image quality generally is improved – obviously at the expense of a higher dose being applied to the patient. If the voltage is for instance increased fromkV to kV, in order to reduce the dose whilst maintaining image quality, the mAs product must be reduced by %. Thus, a dose reduction of approxi-
mately % is obtained (Nagel ). If one wants to calculate the e ective dose at a voltage U that di ers from the reference voltage Uref = kV on the basis of ( . ), then two adjustments to this equation are required. The normalized CTDI free-in-air (cf. ( . )) typically changes with the nd power of the voltage, such that the corresponding correction factor reads
U |
|
|
. |
|
|
kU , = Uref |
( . ) |
In addition, the conversion factors change (cf. Fig. . and Table . ) – indirectly related to device-specific factors – on average by approximately % if the voltage is increased by kV. This can be considered by a second correction factor
U |
. |
|
. |
|
|
kU , = Uref |
( . ) |
•Thickness of the object to be imaged: For infants and frail patients one has to bear in mind that a smaller mAs product has to be adjusted. Due to lower attenuation, the statistics of the X-ray quanta are still as good as for adults or heavier patients. Correspondingly, the image quality is not a ected. For heavier patients, an increase in X-ray tube voltage is preferable to an increase in the mAs product, since the increase in radiation exposure is less intense.
•Slice thickness: The slice thickness can typically be adjusted by means of a tubesided collimator from mm up to mm. Thereby, the slice thickness does not a ect the dose if the same body section is to be measured. The advantage of a finer slice sequence is the reduction of partial volume artifacts as well as step artifacts occurring at coronal or sagittal reformatting of the image. The disad-
|
11 |
Dose |
|
|
|
|
|
|
|
|
|
|
|
Table . . Calculation steps from the mAs product to the e ective dose. The example is for |
|||||||||||
|
a thorax study of an adult male patient on a Siemens SOMATOM Plus scanner |
|||||||||||
|
|
|
|
|
|
|
|
|||||
|
Step |
Variable |
Calculation |
Result |
Example |
|
Reference |
|||||
|
|
|
|
|
|
|
|
|
|
|
|
|
|
|
|
Tube current |
I |
|
|
|
|
mA |
|
Scan protocol |
|
|
|
|
Exposition time |
ċt |
|
|
|
|
s |
|
Scan protocol |
|
|
|
|
|
= Q |
|
mAs product |
mAs |
|
( . ) |
|||
|
|
|
Normalized CTDI |
ċ |
n |
CTDI |
air |
|
. mGy mAs |
Nagel ( ) |
||
|
|
free-in-air |
|
|
|
|||||||
|
|
|
st voltage |
ċ k |
U , |
|
|
( ) |
|
( . ) |
||
|
|
|
|
|
||||||||
|
|
correction |
|
|
|
|
||||||
|
|
|
|
= |
CTDIair |
CTDI free-in- |
. mGy |
( . ) |
||||
|
|
|
|
|
|
|
air |
|
|
|
||
|
|
|
Slice thickness |
ċ |
d |
|
|
|
. cm |
|
Scan protocol |
|
|
|
|
Number of slices |
ċ |
n |
|
|
|
|
Scan protocol |
||
|
|
|
|
= |
|
air |
Dose length |
. mGyċcm |
|
|||
|
|
|
|
DLP |
|
product |
( . ) |
|||||
|
|
|
Conversion |
ċf |
average |
|
|
. |
|
Table . |
||
|
|
factor |
|
|
|
|
|
|
|
|||
|
|
|
System correction |
ċk |
CT |
|
|
|
|
Nagel ( ) |
||
|
|
factor |
|
|
|
|
|
|||||
|
|
|
nd voltage |
ċk |
U , |
|
|
( ) |
|
( . ) |
||
|
|
|
|
|
||||||||
|
|
correction |
|
|
|
|
|
|||||
|
|
|
|
= E |
|
E ective dose |
. mSv |
|
( . ) |
|||
Finally, it shall be mentioned that the progress toward smaller detector elements also influences the dose. It has been derived in Sect. . . that at a constant signal-to-noise ratio the dose increases to the power of four as soon as the detector element size is reduced. If in the formula of Brooks (cf. ( . )) it is assumed that b d ξ for the sampling distance in the rotation center and for the slice thickness respectively, then, in consideration of the definition for the signal-to-noise ratio SNR = μ σ, one immediately obtains the relation
|
( |
|
ξ |
|
) |
|
|
D |
|
SNR |
|
|
|||
( |
|
) |
. |
( . ) |
|||
|
|
|
|
|
|||
Obviously, this limits a further reduction of the size of the detector elements, since the dose may not be arbitrarily increased.