

181
Thus, for example, in compounds 3.3a and 3.3b, the difference in chemical shifts of carbon atoms of the tetrazolyl ring is clearly pronounced, if for the N(1)-isomer δ = 153.2 ppm, then for the N(2)-isomer δ = 162 .6 ppm. Differences are also observed in 1H NMR spectra: the value of the N(1)-CH2 signal corresponds to 5.49 ppm, and N(2)-CH2 — 5.72 ppm.
Next, the resulting ester 3.3b was subjected to hydrolysis in an aqueous solution of NaOH for 3–5 h with the formation of tetrazolylacetic acid 3.4 (Scheme 3.4). The final product was isolated by acidifying the solution with dilute hydrochloric acid to pH 2–3, obtaining white crystals 3.4. The tetrazolylacetic acid thus obtained was an individual compound, which was used for further syntheses without further purification. In confirmation of the completeness of hydrolysis and the selectivity of the product formation,
13C{1H} NMR spectra were obtained, where the signals corresponding to the ether groups (CH2CH3) δ = 3.49 ppm and 62.6 ppm were completely absent, while the corresponding signal of the hydroxyl group δ = 11.02 ppm.
Scheme 3.4
Acid halides are a common class of acylating agents. In this work, 5-phenyl-2H- tetrazol-1-ylacetic acid chloride was obtained by fusing the corresponding acids with phosphorus pentachloride at 90 °C (Scheme 3.5). The structure of compound 2.6 was proved by 1H, 13C{1H} NMR spectroscopy.
Scheme 3.5
Next, a new derivative of 2,4,6-substituted 1,3,5-triazine compound 1.57 was synthesised, containing the fragment 5-phenyltetrazol-2 instead of the hydroxyl group in 2,2-dimethyl-1,3-dioxan-5-yl-methyl -yl-acetate (3.6) (Scheme 3.6).

182
Scheme 3.6
Compound 3.6 was obtained by acylation of compound 1.57 with 5-phenyltetrazol- 2-ylacetic acid chloride (3.5) (Scheme 3.6). The reaction was carried out at room temperature in acetonitrile (MeCN) in the presence of triethylamine, followed by purification of the resulting product by column chromatography. The yield of the target product was 54 % [28].
Compound 3.6 was characterised by mass spectrometry and 1H, 13C{H} NMR and IR spectroscopy. In the 1H NMR spectrum of compound 3.6, there are signals at 1.36 and 1.45 ppm corresponding to the chemical shifts of the protons of the CH3-groups in the dioxane ring. The signal of the protons of the methylene groups of the aziridine rings located in the 2- and 4-positions of the substituted 1,3,5-triazine was observed at 2.31 ppm. In the region of 8.12–8.17 ppm, there were signals of the benzene ring 5-phenyltetrazol-2- yl fragment. In the 13C{H} NMR spectrum of compound 3.6, the signal at 164.8 ppm corresponded to the endocyclic carbon atom of the N(2)-substituted tetrazolyl ring. The carbon atom signal of the methylene group of the 5-phenyltetrazol-2-yl-acetyl fragment was observed at 65.1 ppm [28].
Thus, the possibility of using the reaction of acylation of the hydroxymethyl group of compound 3.6 with tetrazolylacetic acid halides was shown.
3.3. Synthesis and identification of the GO-1.57 conjugate
In this work, a noncovalent GO conjugate with compound 1.57 was synthesised. To obtain a non-covalent conjugate of GO with compound 1.57, the following procedure was used: 1 g of GO was dispersed in an alkaline medium (pH 9; 200 ml) by sonication for 15
Рекомендовано к изучению сайтом МедУнивер - https://meduniver.com/
183
min. Then, a solution of compound 1.57 (5 g) was added to the resulting mixture, and the reaction mixture was kept in an ultrasonic bath for 45 min. The resulting mixture was stirred for 4 days. The resulting GO-1.57 conjugate was separated from the reaction mixture by filtration, then washed with methylene chloride and deionised water, and dried
at 37 °C for 10 h.
Elemental analysis data for GO and GO-1.57 are presented in Table 3.1. From the obtained data, we can conclude that 1.9 10−3 mol of compound 1.57 is adsorbed on the
surface of 1 g of GO (62 wt. %).
Table. 3.1. Elemental analysis data for GO and GO-1.57.
Sample |
[C] / wt. % |
[H] / wt. % |
[N] / wt. % |
|
|
|
|
GO |
44.0 ± 0.3 |
2.3 ± 0.2 |
— |
GO-1.57 |
38.8 ± 0.3 |
3.5 ± 0.2 |
2.7 ± 0.2 |
|
|
|
|
Fig. 3.3 shows the 13C{H} NMR spectra of the conjugate GO and GO-1.57. The spectra show the following signals:
1)the peak at 60 ppm corresponded to the GO epoxy groups;
2)the peak at 67 ppm was related to hydroxyl groups;
3)a low intensity peak at 95 ppm corresponded to a carbon atom in the lactol group;
4)the peak at 98 ppm was related to the quaternary carbon atom in the dioxane fragment of compound 1.57;
5)the peak at 130 ppm was related to the C=C structural fragment of the graphene plane;
6)the peak at 155 ppm was related to the carbons of the triazine ring of compound 1.57;
7)the peak at 189 ppm corresponded to the carboxyl groups of GO;
8)peak at 28 ppm, refers to the carbons of aziridine compound 1.57;
9)the peak at 17 ppm corresponds to the methyl groups of the dioxane fragment of compound 1.57;
10)the peak at 42 ppm corresponds to the methylene atom of compound 1.57.

184
|
|
|
|
e |
|
|
a |
|
|
|
|
|
|
|
|
|
|
|
|
|
|
|
j |
g |
|
|
|
|
|
|
|
|
|
|
|
|
|
|
|
|
|
|
|
|
|
|
|
c |
|
|
|
|
60 f |
|
i |
|
k |
l |
d |
|
|
|
|
|
|
|
|
|
|
f |
|
|
|
|
|
|
|
|
|
|
b |
|
|
|
|
|
|
|
|
|
h |
|
|
|
|
72 e |
42 i |
|
|
|
|
|
|
|
|
|
|
|
|
|
|
|
|
165 l |
150 k |
130 c |
99 j |
28 h |
|
|
|
|
|
|
|
|
|
||||
|
|
|
|
|
|
|
17 g |
|
||
|
|
|
|
|
|
|
|
|
||
|
|
|
|
|
|
|
|
|
|
|
|
GO-1.57 |
|
|
|
|
|
|
|
||
|
GO and compound 1.57 |
|
|
|
|
67 e |
|
|||
|
(physical mixture) |
|
|
|
|
|
60 f |
|
||
|
|
|
|
|
|
|
|
|
|
|
|
|
|
|
189 a |
163 b |
130 c |
95 d |
|
|
|
|
GO |
|
|
|
|
|
|
|||
|
|
|
|
|
|
42 i |
|
|||
|
|
|
|
|
|
|
|
|
|
|
|
|
|
|
163 l |
150 k |
|
99 j |
|
30 h |
|
|
Compound 1.57 |
|
|
|
|
|
|
|||
250 |
|
|
200 |
150 |
|
|
100 |
50 |
0 |
|
|
|
|
|
|
|
d |
/ ppm |
|
|
|
Fig. 3.3. 13C NMR spectra of GO and GO-1.57 conjugate (down up: 13C NMR spectrum of the compound 1.57; 13C NMR spectrum of GO; 13C NMR spectrum of a mixture obtained by physical adsorption; 13C NMR spectrum of GO-1.57).
The XPS spectra of GO-1.57 (Fig. 3.4a) show peaks C 1s (285 eV), O 1s (532 eV), N 1s (400 eV). Fig. 3.4b shows the result of deconvolution of the 1s carbon peak with the formation of four peaks at the following binding energies: 284 eV (C=C groups of the aromatic domain on the graphene surface), at 285 eV (C–C groups of the graphene skeleton), at 287 eV (C–N amide bond groups), at 289 eV (C–O of epoxy and hydroxyl groups on the surface of GO-1.57). Deconvolution of the 1s oxygen peak leads to the formation of the following signals (Fig. 3.4c): 533 eV, related to the O–H groups (carboxyl and also GO hydroxyl groups); 532 eV, related to the C–O groups (as part of the epoxy, carboxyl, and hydroxyl groups on the surface of GO). Fig. 3.4d shows the result of the deconvolution of the 1s nitrogen peak with the formation of a peak at 402 eV (aziridine groups of compound 1.57) and also at 399 eV (nitrogen atoms in the composition of the triazine ring).
Рекомендовано к изучению сайтом МедУнивер - https://meduniver.com/

|
|
|
(a) |
|
|
|
7000 |
|
|
|
|
|
6000 |
|
532 eV |
|
|
|
|
|
|
|
|
|
5000 |
|
|
|
|
Intensity |
4000 |
|
|
|
|
3000 |
|
|
|
|
|
|
|
|
|
|
|
|
|
|
400 eV |
285 eV |
|
|
2000 |
|
|
|
|
|
1000 |
|
|
|
|
|
0 |
|
|
|
|
|
800 |
600 |
400 |
200 |
0 |
Binding energy / eV
|
|
|
|
(c) |
|
|
|
|
|
2000 |
|
|
|
|
|
|
|
|
1500 |
|
|
|
|
C = O, C - O |
|
|
|
|
|
|
|
|
|
||
Intensity |
1000 |
|
|
O - H |
|
|
|
|
|
|
|
|
|
|
|
||
|
|
|
|
|
|
|
|
|
|
500 |
|
|
|
|
|
|
|
|
0 |
|
|
|
|
|
|
|
|
540 |
538 |
536 |
534 |
532 |
530 |
528 |
526 |
Binding energy / eV
185
|
|
|
|
(b) |
|
|
|
|
|
1000 |
|
|
|
|
|
|
|
|
|
|
|
|
|
|
C - C, C = C |
|
|
800 |
|
|
|
|
|
|
|
Intensity |
600 |
|
|
|
|
|
|
|
|
|
|
C - N |
|
|
|
|
|
|
|
C - O |
|
|
|
|
||
400 |
|
|
|
|
|
|
|
|
|
|
O - C = O |
|
|
|
|
|
|
|
200 |
|
|
|
|
|
|
|
|
0 |
|
|
|
|
|
|
|
|
294 |
292 |
290 |
288 |
286 |
284 |
282 |
280 |
Binding energy / eV
|
|
|
|
(d) |
|
|
|
325 |
|
|
|
|
|
|
|
|
|
|
Triazine N |
|
|
300 |
|
|
|
|
|
|
275 |
|
|
|
|
|
Intensity |
250 |
-CH2-NH-CH2- |
|
|
|
|
|
|
|
|
|||
|
Aziridine N |
|
|
|
|
|
225 |
|
|
|
|
|
|
|
|
|
|
|
|
|
|
200 |
|
|
|
|
|
|
175 |
|
|
|
|
|
|
150 |
|
|
|
|
|
|
406 |
404 |
402 |
400 |
398 |
396 |
Binding energy / eV
Fig. 3.4. XPS spectra of GO-1.57.
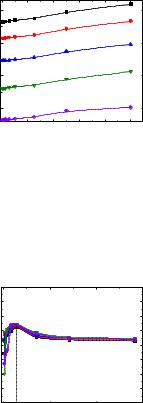
According to the obtained thermogravimetric (TG) and differential thermal (DTG) curves, it is clear that the decomposition of GO-1.57 took place in several stages (Fig. 3.5).
A significant weight loss was observed at 95 °C, which may be due to the presence of adsorbed water molecules. At 183 °C, a noticeable weight loss was observed due to the degradation of compound 1.57 adsorbed on the GO surface. The resulting weight loss is consistent with the loading percentage of compound 1.57 (62 wt %). The weight loss of
GO at 338 °C is explained by various kinds of rearrangements involving functional groups on the GO surface and, finally, by further degradation of the graphene sheet surface (603
°C).

|
|
|
|
186 |
|
|
|
|
|
|
|
110 |
|
|
|
|
|
|
|
|
|
|
100 |
|
|
|
|
|
|
|
0.0 |
|
|
|
|
|
|
|
|
|
|
|
|
|
90 |
|
|
|
|
|
|
|
|
|
|
80 |
|
|
|
|
|
|
|
|
|
|
|
|
|
|
|
|
|
|
-0.2 |
DTG |
% |
70 |
|
|
|
|
|
|
|
|
|
/ |
|
|
|
|
|
|
|
|
|
/ |
TG |
60 |
|
|
|
|
|
|
|
|
minЧ% |
50 |
|
|
|
|
|
|
|
-0.4 |
||
|
|
|
|
|
|
|
|
|
1− |
|
|
40 |
|
|
|
|
|
|
|
|
|
|
30 |
|
|
|
|
|
|
|
-0.6 |
|
|
|
|
|
|
|
|
|
|
|
|
|
20 |
|
|
|
|
|
|
|
|
|
|
100 |
200 |
300 |
400 |
500 |
600 |
700 |
800 |
900 |
|
|
|
|
|
T / °С |
|
|
|
|
|
|
Fig. 3.5. Thermogram of the conjugate GO-1.57: TG (—), DTG (—).
The IR spectra of the GO-1.57 conjugate contain a peak at 3410 cm−1, which is characteristic of the stretching vibrations of the hydroxyl, carboxyl, and lactol groups. The signal of the secondary amine N–H appears at 1650 cm−1, 1460, and 1458 cm−1 for the aziridine groups; the signals of the dimethyl fragments of compound 1.57 appear at 1360 and 1390 cm−1.
The Raman spectrum of GO-1.57 contains the D, G, and 2D bands. In particular, in the case of a single-layer GO, I2D / IG = 2; lower I2D / IG values indicate an increase in the number of GO layers. For the synthesised non-covalent conjugate GO-1.57, the ratio I2D /
IG = 0,65, which indicates the multilayer structure of the nanomaterial. The ID/IG ratio allows one to estimate the degree of functionalisation of the GO surface. Analysis Fig. 3.6 indicates the presence of D and G bands at 1360 cm−1 and 1592 cm−1, which have an intensity ratio ID / IG = 0.97. The resulting ID / IG ratio is consistent with the data for GO enriched in oxygen-containing functional groups [81]. This fact indicates that the loading of compound 1.57 occurs due to physical adsorption.
Рекомендовано к изучению сайтом МедУнивер - https://meduniver.com/

|
|
|
|
|
187 |
|
|
|
|
|
400 |
|
|
|
|
|
|
|
|
|
|
|
|
|
G band |
|
|
|
|
|
350 |
D band |
|
|
|
|
|
|
|
|
300 |
|
|
|
|
|
|
|
|
Intensity |
250 |
|
|
|
|
|
|
|
|
|
|
|
|
|
|
2D band |
|
||
200 |
|
|
|
|
|
|
|
|
|
|
|
|
|
|
|
|
|
|
|
|
150 |
|
|
|
|
|
|
|
|
|
100 |
|
|
|
|
|
|
|
|
|
50 |
|
|
|
|
|
|
|
|
|
0 |
|
|
|
|
|
|
|
|
|
0 |
500 |
1000 |
1500 |
2000 |
2500 |
3000 |
3500 |
4000 |
Raman shift / cm−1
Fig. 3.6. Raman spectrum of the conjugate GO-1.57.
Fig. 3.7 shows a SEM photograph of the GO-1.57 conjugate. It can be seen that GO flakes are separate domains with lateral sizes from several hundreds of nanometres to several micrometres and a thickness of several nanometres. The results prove the functionalisation of the GO surface by the compound 1.57.
Fig. 3.7. SEM image of particles of GO-1.57.
3.4. Study of the physicochemical properties of aqueous solutions of compound 1.57
This section of the dissertation is devoted to the study of the physicochemical
properties of aqueous solutions of compound 1.57, namely, density, viscosity, refractive

188
index, solubility, and stability of the compound depending on pH. The study of the physicochemical properties of aqueous solutions of biologically active compounds and potential drugs is the basis for understanding the mechanisms of their action, biodistribution, pharmacokinetics, pharmacodynamics, metabolic stability, etc. [82]. For example, data on density and viscosity characterise intermolecular interactions in solution, which makes it possible to predict the haemocompatibility of the test substance. The distribution coefficient makes it possible to predict the permeability of a substance through tissue and cellular barriers. Stability studies are necessary to understand the pharmacokinetics, pharmacodynamics, toxicokinetics, and metabolic stability of the test substance [83–93].
3.4.1. Density of aqueous solutions of compound 1.57
The results of studying the density of aqueous solutions of compound 1.57 (C = 0.025–10 g dm−3, T = 293.15–333.15 K) are shown in Fig. 3.8.
The average molar volumes and partial molar volumes of the solution components were calculated according to the equations:
V |
(3.1) |
V = nH2O + n1.57 |
|
|
|
|
|
|
|
|
|
|
|
|
|
|
|
|
|
|
|
|
|
|
|
|
V |
|
|
|
|
|
|
|
|
|||||||
|
|
|
|
|
|
|
|
|
|
|
|
||||||||
V |
=V - x |
|
|
|
|
|
|
|
|
V |
|
|
|
||||||
|
|
|
|
|
|
||||||||||||||
|
|
|
|
|
, |
V |
=V - x |
|
|
|
|
|
(3.2) |
||||||
x |
|
|
|||||||||||||||||
H2O |
1.57 |
|
|
|
1.57 |
|
|
H2O |
x |
|
|
|
|||||||
|
|
|
|
|
1.57 |
T ,P |
|
|
|
|
|
|
H2O T ,P |
|
|||||
is average molar volume; V is volume of an aqueous solution of a compound
1.57; nH2O , n1.57 and xH2O , x1.57 are amounts of substance and mole fractions of water and and V1.57 are partial molar volumes of water and compounds 1.57.
Рекомендовано к изучению сайтом МедУнивер - https://meduniver.com/
|
|
|
189 |
|
|
1.000 |
|
|
|
|
|
0.995 |
|
|
|
|
|
−3 |
|
|
|
|
|
gЧcm |
|
|
|
|
|
r/ |
|
|
|
|
|
0.990 |
|
|
|
|
|
0.985 |
|
|
|
|
|
0 |
2 |
4 |
6 |
8 |
10 |
|
|
|
C / gЧdm−3 |
|
|
Fig. 3.8. Concentration dependences of the density of aqueous solutions of the compound
1.57 (□) 293,15 K, (○) 303,15 K, ( ) 313,15 K, ( ) 323,15 K, ( ) 333,15 K.
Figs. 3.9 and 3.10 show the concentration dependences of the partial molar volumes of the compound 1.57 and H2O (VH2O and V1.57) in the temperature range
T = 293.15–333.15 K.
|
400 |
|
|
|
|
350 |
|
|
|
|
300 |
|
|
|
−1 |
250 |
|
|
|
3Ч mol |
|
|
|
|
|
|
|
|
|
/ cm |
200 |
|
|
|
|
|
|
|
|
1.57 |
150 |
|
|
|
V |
|
|
|
|
|
100 |
|
|
|
|
50 |
|
|
|
|
0 |
|
|
|
|
0.0000 |
0.0002 |
0.0004 |
0.0006 |
|
|
|
x1.57 |
|
Fig. 3.9. The concentration dependence of the partial molar volume of compound 1.57 at
(□) 293,15 K, (○) 303.15 K, ( ) 313.15 K, ( ) 323.15 K, ( ) and 333.15 K. Extreme point x = 5.3·10−6.

|
|
|
190 |
|
|
18.30 |
|
|
|
−1 |
18.25 |
|
|
|
|
|
|
|
|
Чмоль |
18.20 |
|
|
|
3 |
|
|
|
|
/ см |
|
|
|
|
H2O |
18.15 |
|
|
|
V |
|
|
|
|
|
18.10 |
|
|
|
|
18.05 |
|
|
|
|
0.0000 |
0.0002 |
0.0004 |
0.0006 |
|
|
|
xсоединения 1.57 |
|
Fig. 3.10. Concentration dependence of the partial molar volume of water at (□) 293.15 K, (○) 303.15 K, ( ) 313.15 K, ( ) 323.15 K, ( ) 333.15 K.
The results obtained demonstrate that at low concentrations up to 0.1 g∙dm−3, the values of V1.57 slightly decrease. This fact indicates that the addition of even a small amount of compound 1.57 leads to compression and structuring of the solution, hence, its stability over the entire measurement range.
3.4.2. Viscosity of aqueous solutions of the compound 1.57
Fig. 3.11 presents data on the dynamic (η) and (ηk) kinematic viscosity in the binary system compound 1.57 – water in the temperature range T = 293.15–333.15 K. The kinematic viscosity was calculated using formula 3.3 [86]:
k |
= |
|
(3.3) |
|
|
r |
|
/ мПаЧс
1.1
1.0
0.9
0.8
0.7
0.6
0.5
0 |
2 |
4 |
6 |
8 |
10 |
C / гЧдм−3
Fig. 3.11. Concentration dependences of dynamic viscosity (η) at a shear rate of 100 s−1 in the binary system compound 1.57 – H2O at (□) 293.15 K, (○) 303.15 K, ( ) 313.15 K, ( ) 323 .15 K, ( ) 333.15 K. C is the concentration of the compound 1.57.
Рекомендовано к изучению сайтом МедУнивер - https://meduniver.com/