

MPS_Day1_World_Class_Reliability_Performance
.pdfPhone: +61 (0) 402 731 563
Fax: +61 (8) 9457 8642
Email: info@lifetime-reliability.com
Website: www.lifetime-reliability.com
Chance of Failure for a Drinking Glass
1
per Year |
|
RateFailure |
0.167 |
|
|
|
0 |
|
0 |
1,000,000 glasses sold in packs of 12
83,333 households buy a pack of 12
Say average household breaks 2 glasses a year
That is 166,667 glasses broken each year which are then replaced Chance of breaking a glass during a year is 166, 667 ‚ 1,000,000
Chance of Glass Failure Curve |
+ |
+ |
|
|
+ |
|
+ |
+ Crushed - squashed + Crushed - jammed
+ Mistreated - smashed
+ Dropped - tray
+ Knocked - stacked
+ Knocked - hit
Dropped - hand 
What can cause this glass to break?
•It can be dropped, for example -
1.slip from your hand
2.fall off a tray
3.slip out of a bag or carry box
•It can be knocked,
1.hit by another glass
2.clanked when stacked on each other
3.hit by an object, like a plate or bottle
•It can be crushed,
1.jammed hard between two objects
2.stepped-on
3.squashed under a too heavy object
•It can be temperature shocked,
1.in the dish washer
2.during washing-up
•Mistreated,
1.It can be thrown in anger
2.It can be smashed intentionally
•Latent damage
1.scratched and weakened to later fail more easily
2.chipped and weakened to later fail more easily
24 |
48 |
Time (months) |
|
„Opportunity‟ for breakage arises regularly
We can estimate the chance of breaking a glass in a year, i.e. the failure rate, by analysing the history of the glass. Let‘s say it came from a manufacturing run of a million drinking glasses which were sold through shops around the world in a carrier packs of twelve glasses. Each pack went to a household, one of them was your place and another was my place. That means 83,333 households had a set of glasses and put them on their shelf to use.
At the beginning only a few of the many causes of glass breakage can happen. When a new drinking glass is taken out of the glass-carrier and put on a shelf it is possible to drop it. As the glass is first moved into place on the shelf it is possible for it to hit something else on the shelf. It is reasonable to expect breakages will begin on the day of purchase (some glasses will be broken when first putting them on a shelf, though not many because people will be careful with new glasses—maybe only 10 or 20 in 83,333 households) and continuing for as long as the glasses are used. So the chance of the glass being broken at the start of its ‗working‘ life is not zero because in some of the 83,333 households a glass will be broken when first stored. Over time more opportunities for failure arise. As the glass is used for different functions, family gettogethers, celebrations, special occasions, etc opportunities constantly arise for an accident or problem to occur that results in a broken glass. With enough time the causes repeat endlessly.
Hence we can draw the intrinsic rate of failure for a million identical glasses, or the hazard curve for a glass, as a straight line curving up from the day the glass is purchased and levelling out after about 18to 24 months as the annual cycle of glass usage stabilises. The number failing each day is unknown, but our life experience suggests that an average of one or two glasses broken every year in a household is a believable situation. Hence if 1,000,000 glasses were sold, then for household that break one glass a year the hazard curve for the glasses would be a straight line at 0.083 probability per year. For those that break two a year the line will be at 0.167. You can see on the slide how the annual failure rate of 0.167 was calculated for the group of 1,000,000 glasses. For your 12 glasses at my home the failure rate is 0.167 ÷ 83,333 = 0.000002, or two in a million.
- 91 -

Phone: +61 (0) 402 731 563
Fax: +61 (8) 9457 8642
Email: info@lifetime-reliability.com
Website: www.lifetime-reliability.com
If you wanted to reduce the number of drinking glasses broken in a year what can you do?
Stop Breakage = Remove Failure Causes
Failure Rate per Year
Design Change
1 |
|
|
|
|
|
|
|
|
|
|
|
|
|
|
|
|
|
|
|
|
|
|
|
|
|
|
|
|
|
|
|
|
|
What can cause this glass to break? |
|
|
|
|
|
|
|
|
|
|
|
|
|
|
|
|
|
|
|
|
|
|
|
|
|
|
|
|
|
|
|
|
|
|
|
|
|
|
|
|
|
|
|
|
|
|
|
|
|
|
|
|
|
|
|
|
|
|
|
|
|
|
|
|
|
|
|
|
|
|
|
• It can be dropped, for example - |
|
|
|
|
|
|
|
|
|
|
|
|
|
|
|
|
|
|
|
|
|
|
|
|
|
|
|
|
|
|
|
|
|
|
|
1. |
slip from your hand |
|
|
|
|
|
|
|
|
|
|
|
|
|
|
|
|
|
|
|
|
|
|
|
|
|
|
|
|
|
|
|
|
|
|
2. fall off a tray |
|
|
|
|
|
|
|
|
|
|
|
|
|
|
|
|
|
|
|
|
|
|
|
|
|
|
|
|
|
|
|
|
|
|
|
3. |
slip out of a bag or carry box |
|
|
|
|
|
|
|
|
|
|
|
|
|
|
|
|
|
|
|
|
|
|
|
Procedure Change |
• It can be knocked, |
|||||||||||
|
|
|
|
|
|
|
|
|
|
|
|
|
|
|
|
|
|
|
|
|
|
|
1. hit by another glass |
||||||||||||
|
|
|
|
|
|
|
|
|
|
|
|
|
|
|
|
|
|
|
|
|
|
|
|
|
|
|
|
|
|
|
|
|
|
||
|
|
|
|
|
|
|
|
|
|
|
|
|
|
|
|
|
|
|
|
|
|
|
|
|
|
|
|
|
|
|
|
|
|
2. clanked when stacked on each other |
|
|
|
|
|
|
|
|
|
|
|
|
|
|
|
|
|
|
|
|
|
|
|
|
Instructions |
3. |
hit by an object, like a plate or bottle |
||||||||||
|
|
|
|
|
|
|
|
|
|
|
|
|
|
|
|
|
|
|
|
|
|
|
• It can be crushed, |
||||||||||||
|
|
|
|
|
|
|
|
|
|
|
|
|
|
|
|
|
|
|
|
|
|
|
& Training |
1. jammed hard between two objects |
|||||||||||
0.167 |
|
|
|
|
|
|
|
|
|
|
|
|
|
|
|
|
|
|
|
|
|
|
2. |
stepped-on |
|||||||||||
|
|
|
|
|
|
|
|
|
|
|
|
|
|
|
|
|
|
|
|
|
|
|
|
|
|
|
|
|
|
|
|
|
3. |
squashed under a too heavy object |
|
|
|
|
|
|
|
|
|
|
|
|
|
|
|
|
|
|
|
|
|
|
|
|
|
|
|
|
|
|
|
|
|
|
|
• It can be temperature shocked, |
|
|
|
|
|
|
|
|
|
|
|
|
|
|
|
|
|
|
|
|
|
|
|
|
|
|
|
|
|
|
|
|
|
|
|
1. |
in the dish washer |
|
|
|
|
|
$ |
|
|
|
$ |
|
$ |
$ |
|
|
2. during washing-up |
||||||||||||||||||||
|
|
|
|
|
|
|
|
|
|
|
• Mistreated, |
||||||||||||||||||||||||
0.045 |
|
|
|
|
|
|
|
|
|
|
1. |
It can be thrown in anger |
|||||||||||||||||||||||
|
|
|
|
|
|
|
|
|
|
|
|
|
|
|
|
|
|
|
|
|
|
|
|
|
|
+ Mistreated - smashed |
2. |
It can be smashed intentionally |
|||||||
|
|
|
|
|
|
|
|
|
|
|
|
|
|
|
|
|
|
|
|
|
|
|
|
|
|
|
• Latent damage |
||||||||
|
|
|
|
|
|
|
|
|
|
|
|
|
|
|
|
|
|
|
|
|
|
|
|
|
|
|
+ Knocked - hit |
1. |
scratched and weakened to later fail |
||||||
|
|
|
|
|
|
|
|
|
|
|
|
|
|
|
|
|
|
|
|
|
|
|
|
|
|
|
|
more easily |
|||||||
|
|
|
|
|
|
|
|
|
|
|
|
|
|
|
|
|
|
|
|
|
|
|
|
|
|
|
|
|
|
|
|
|
|
|
|
0 |
|
|
|
|
|
|
|
|
|
|
|
|
|
|
|
|
|
|
|
|
|
|
|
|
|
|
|
Dropped - hand |
2. |
chipped and weakened to later fail |
|||||
|
|
|
|
|
|
|
|
|
|
|
|
|
|
|
|
|
|
|
|
|
|
|
|
|
|
|
|
|
|
|
|
|
|
more easily |
|
|
|
|
|
|
|
|
|
|
|
|
|
|
|
|
|
|
|
|
|
|
|
|
|
|
|
|
|
|
|
|
|
|
|
||
0 |
|
|
|
|
|
|
|
|
|
|
|
|
|
|
|
|
|
|
|
|
|
|
|
|
|
|
|
|
|
|
|
|
|
|
|
|
|
|
12 |
|
|
|
|
|
|
|
24 |
|
|
|
|
|
|
Time (months) |
|||||||||||||||||
|
|
|
|
|
|
|
|
|
|
|
|
|
|
|
|
|
|
|
|
|
|
||||||||||||||
„Opportunity‟ for breakage arises regularly
Once the causes of failure are known they can be targeted with solutions to prevent them.
Glass breakages can be stopped by a design change, such as replacing glass with plastic , by changing the glass design to one that is stronger, or using a glass of a design that prevents a failure cause arising. Procedural changes can be made such as carrying glasses in locating trays. Improved instructions with training can be used to up-skill people and give them specialised knowledge and techniques.
Once failure causes are removed there will be fewer failures and the failure rate curve falls. With fewer failures less money is lost to DAFT Costs. The maintenance costs fall, the operating profit improves and people win back time to spend on improving the operation further.
- 92 -

Phone: +61 (0) 402 731 563
Fax: +61 (8) 9457 8642
Email: info@lifetime-reliability.com
Website: www.lifetime-reliability.com
Reliability = Remove Likelihood of Failure
Dropped
Hit/Impact
Total Group
10 Yrs
Wear
Puncture
Total Group
60,000 km
Misaligned
Insufficient Lube
Wrong Lube
Particulate/Dirt
Moisture
Poor Fit
Overload
Total Group
5 Yrs 81
For each failure mode of a part the failure curves for it can be developed. Data is collected for each type of part from many applications. For each failure mode the life of the parts is measured and the numbers of parts failing from that mode in each time period is charted. The sum of the likelihoods for each mode becomes the total chance of the part failing.
The curve for the total each part‘s failure modes shows the chance of the part failing in a particular time period due to that failure mode.
To reduce the chance of failure it is necessary to remove the causes of failure. As each cause is removed there are fewer opportunities for the part to fail. Because the causes of failure are not about there is less chance to fail and on average the item lasts longer between stoppages.
The story is always the same and applies to every part and every assembly in a machine—to improve equipment reliability remove the failure causes so that there are no reasons for the parts to fail and the equipment to stop.
- 93 -
Phone: +61 (0) 402 731 563
Fax: +61 (8) 9457 8642
Email: info@lifetime-reliability.com
Website: www.lifetime-reliability.com
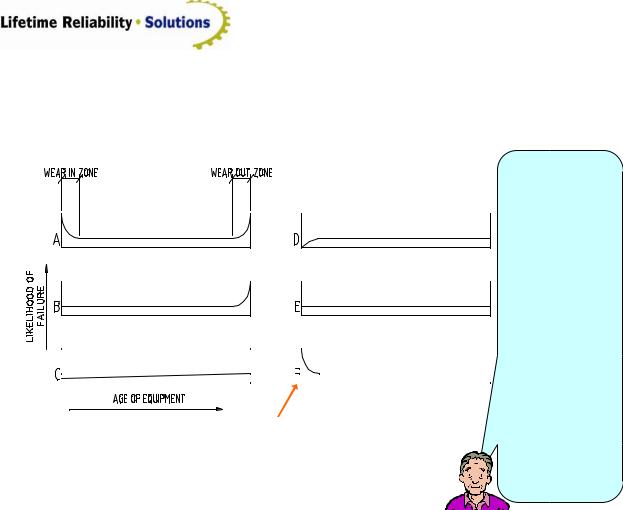
Individual Parts Reliability Curves
The Six Failure Curves and the Percentage Of Component (i.e. parts) Types They Apply Too.
Total 10% 25% |
Total 90% 75% |
Age-Based Failures |
Random Failures |
|
Airline 3 - 4% - Naval 2 |
- 3% |
Airline 7 - 11% - Naval 6 - 9% |
Airline 1 - 2% - Naval 10 |
- 17% |
Airline 14-15% - Naval 42-56% |
Airline 4 - 5% - Naval 3 - 17% |
|
|
|
Airline 66-68% - Naval 6-29% |
|
|
|
||
|
|
|
|
|
|
|
|
|
|
•The 1978 study by Nolan and Heap identified 68% of aircraft parts were pattern F, with high Infant Mortality and then random failures over time. We learnt that every time we do a repair we introduce a new chance of Infant Mortality
• Research by the USA merchant and military navy confirmed the presence of the failure patterns found in the aviation industry.
Because failure is probabilistic for 75% - 90% of parts, i.e. their failure is a chance event, this makes replacement of those parts on a certain date totally pointless. If the part did not show evidence of failure then it could have remained in operation for a very long time. You spent money unnecessarily replacing a part that had nothing wrong with it.
In the 1960‘s the aircraft industry needed ways to lower maintenance costs. Typically 2,000,000 man hours were required every 20,000 hours of flying time to overhaul jet engines. Maintenance was based on the ‗bath tub‘ curve model of component life (Pattern A), which was the industrywide view of maintenance at the time. The practice was to replace parts after sometime because the ‗model‘ assumed all parts aged and would fail after a certain time.
A 1978 study by Nolan and Heap identified that component failure was probabilistic and six failure patterns existed for aircraft components (parts). The traditional ‗bathtub‘ curve accounted for only 4% of the failures. The fascinating discovery was that 11% of failures were age related; the remaining 89% were random. This meant that age based maintenance was pointless in most cases. From their work Nolan and Heap coined the phrase – reliability centred maintenance (RCM) – which focused on determining the probability of component failure and matched maintenance inspections to the component‘s likelihood of failure.
RCM recognised that it was not possible to eliminate failure through the maintenance effort. Rather failure had to be designed-out or deterioration monitored. RCM achieved significant improvement in reliability and reduced maintenance costs by better design decisions. The following results that have been documented:
Reductions in the amount of Scheduled Maintenance Labour Hours of 87% Reductions in Total Maintenance Labour Hours of up to 29%
Reductions in Maintenance Materials costs of up to 64% Improvements in Equipment Availability of up to 15% Improvements in Equipment Reliability of up to 100%
Clearly RCM is a valuable design tool to give substantial improvements in reliability.
- 94 -

Phone: +61 (0) 402 731 563
Fax: +61 (8) 9457 8642
Email: info@lifetime-reliability.com
Website: www.lifetime-reliability.com
Research by the US navy after the Nolan and Heap study confirmed their findings. There was some variation in percentages due to the different type of equipment and components, the marine operating environment and stringent US naval commissioning and maintenance practices.
The Pattern ‗F‘ curve represented 68% of aircraft component failures. It means there is a high ‗infant mortality‘ rate. The implication being that a great proportion of equipment suffers early failure from poor quality work or induced problems. The problems of quality workmanship are reduced by thorough planning in which detailed information and procedures are made available to the maintainers. To decrease the chance of ‗infant mortality‘ further it is necessary to train the technicians in precision maintenance practices.
Reliability Properties for Systems
• Series Systems |
1 |
|
1 |
|
1 |
|
|
|
|
|
n |
|
|
|
|
|
|
|
Rsystem= R1 x R2 x R3 … Rn
R = 0.95 x 0.95 = 0.9025 
|
Reliability=Chance of Success |
|||||
|
|
|
|
|
|
|
• Parallel Systems |
|
|
1 |
|
|
|
|
|
|
|
|||
|
|
|
|
|
|
|
|
|
|
|
|
|
|
|
|
1 |
|
|
||
Rsystem= 1-[(1- R1)x(1- R2)x … (1-Rn)] |
|
|
|
|
||
|
|
|
|
|
|
|
|
|
|
|
|
|
|
(only fully active) |
|
|
1 |
|
|
|
|
|
|
|
|||
R = 1 – [(1 - 0.6) x (1 - 0.6)] = 0.84 |
|
|
|
|
|
|
|
|
|
|
|
|
|
|
|
|
|
|
|
|
|
|
|
|
|
|
|
|
|
|
|
|
|
|
|
|
|
|
|
|
|
|
|
|
|
|
|
|
|
|
|
|
|
|
|
|
|
|
|
|
|
|
The mathematics can be difficult. But you need to know that such mathematics exists and be able to use the principles to optimise maintenance.
When parts are used to make a machine, or machines are used to make processes, they can be grouped either in a series or in a parallel arrangement.
The system reliability performance can be calculated from the component reliability performance using the mathematics of probability and statistics. The component reliability is determined from the components failure history.
The reliability of a series system is the multiplication of the reliability (chance of success) of its components using the equation Rsystem= R1 x R2 x R3 … Rn.
Calculation of the reliability of a parallel arrangement depends on how the arrangement is configured to work. The equation in the slide applies only to a ‗fully active‘ state, which means any of the items can do the complete duty by itself. This is what is done for the flying systems in commercial aircraft. They have multiple independent ways to fly the plane in case one system fails. There are other equations that apply where 2 out of 3, or 3 out of 4 items in a parallel system must operate for the system to deliver the required duty.
- 95 -

Phone: +61 (0) 402 731 563
Fax: +61 (8) 9457 8642
Email: info@lifetime-reliability.com
Website: www.lifetime-reliability.com
The final reliability of a series system is always less than its least reliable component. While the reliability of a parallel arrangement is always higher than that of its most reliable item.
Reliability Properties for Series Systems
Rsystem= R1 x R2 x …Rn
1 
 1
1 
 1
1 


 n
n
Properties of Series Systems
1.The reliability of a series system can be no higher than the least reliable component.
2.If ‘k’ more items are added into a series system of items (say 1 added to a system of 2, each with R = 0.9) the probability of failure of all items must fall an equal proportion (33%), to maintain the original system reliability.
(0.9 x 0.9 = 0.93 x 0.93 x 0.93 = 0.81)
3.A small rise in reliability of all items (say R of the three items rises 0.93 to 0.95, 2.2% improvement) causes a larger rise in system reliability (from 0.81 to 0.86, 5%).
• Implications for Equipment made of Series Systems
1System-wide improvements lift reliability higher than local improvements. This is why SOP‟s, training and up-skilling pay-off.
2Improve the least reliable parts of the least reliable equipment first.
3Carry spares for series systems and keep the reliability of the spares high.
4Standardise components so fewer spares are needed.
5Removing failure modes lifts system reliability. This is why Root Cause Failure Analysis (RCFA) and Failure Mode and Effects Analysis (FMEA) pay off.
6Provide pseudo-parallel equipment by providing tie-in locations for emergency equipment .
7Simplify, simplify, simplify – fewer
components means higher reliability.
www.lifetime-reliability.com
84
A series arrangement has the three very important series reliability properties described below.
1.The reliability of a series system is no more reliable than its least reliable component.
The reliability of a series of parts (this is a machine – a series of parts working together) cannot be higher than the reliability of its least reliable part. Say the reliability of each part in a two component system was 0.9 and 0.8. The series reliability would be 0.9 x 0.8 = 0.72, which is less than the reliability of the least reliable item. Even if work was done to lift the
0.8reliability up to 0.9, the best the system reliability can then be is 0.9 x 0.9 = 0.81.
2.Add ‘k’ items into a series system of items, and the probability of failure of all items in the series must fall an equal proportion to maintain the original system reliability.
Say one item is added to a system of two. Each part is of reliability 0.9. The reliability with two components was originally 0.9 x 0.9 = 0.81, and with three it is 0.9 x 0.9 x 0.9 = 0.729. To return the new series to 0.81 reliability requires that all three items have a higher reliability, i.e. 0.932 x 0.932 x 0.932 = 0.81. Each item‘s reliability must now rise 3.6 % in order for the system to be as reliable as it was with only two components.
3.An equal rise in reliability of all items in a series causes a larger rise in system reliability.
Say a system-wide change was made to a three item system such that reliability of each item rose from 0.932 to 0.95. This is a 1.9% individual improvement. The system reliability raises from 0.932 x 0.932 x 0.932 = 0.81, to 0.95 x 0.95 x 0.95 = 0.86, a 5.8% improvement.
-96 -

Phone: +61 (0) 402 731 563
Fax: +61 (8) 9457 8642
Email: info@lifetime-reliability.com
Website: www.lifetime-reliability.com
For a 1.9% effort there was a gain of 5.8% from the system. This is a 300% return on investment. Series Reliability Property 3 seemingly gives substantial system reliability growth for free.
These three reliability properties are the key to maintenance management success.
Series Reliability Property 1 means that anyone who wants high series process reliability must ensure every step in the series is highly reliable.
Series Reliability Property 2 means that if you want highly reliable series processes you must remove as many steps from the process as possible – simplify, simplify, simplify!
Series Reliability Property 3 means that system-wide reliability improvements deliver far more pay-off than making individual reliability improvements.
Understanding the concepts of series system reliability provides you with an appreciation of why so many things can go wrong in your business. Everything interconnects with everything else. Should chance go against you, any defect or error made in any process can one day cause a failure that maybe a catastrophe. If you don‘t want to run your business by luck it is critical to control the reliability of each step in every process.
Simplify, Simplify, Simplify
11 |
13 |
14 |
|
|
|
5 |
12 |
|
|
|
|
|
|
10 |
9 |
|
|
|
|
|
Shaft |
|
|
|
|
|
|
|
|
|
|
|
|
|
1 |
3 |
4 |
|
|
1 |
2 |
|
5 |
6 |
|
|||
2 |
7 |
|
||||
|
|
|
|
|||
|
|
|
|
|
||
|
|
|
|
|
|
8 |
3 |
||
4 |
|||
|
|||
|
|
|
|
|
|
|
|
85
There are two examples of using simplified solutions that require fewer components. A Plummer block with a roller bearing needs 14 parts to do what a bearing in a fixed housing does with 5 parts. The Plummer block is a complicated and difficult way to carry a bearing and suffers many bearing failures when in service. It is easy to understand why when there are so many ways for it to go wrong.
- 97 -

Phone: +61 (0) 402 731 563
Fax: +61 (8) 9457 8642
Email: info@lifetime-reliability.com
Website: www.lifetime-reliability.com
There are design engineers across the world that specify Plummer blocks throughout all their 30-40 year long careers. They unknowingly cause the users of their designs lots of problems and many breakdowns because there are so many parts present. With 14 components available to make mistakes on during installation it is almost impossible to get long service life from bearings mounted in Plummer blocks.
Fan drives, such as those for the cooling towers shown in the bottom drawings, can be simplified by the use of variable speed drive electric motors. That choice removes four items from the old style series arrangement and makes the drive far more reliable.
Reliability Properties for Parallel Systems
Rsystem= 1-[(1- R1)x(1- R2)x …(1-Rn)]
1 
 1
1 
 1
1 

 n
n
Properties of Parallel Systems
1.The more number of components in parallel the higher the system reliability.
2.The reliability of the parallel arrangement is higher than the reliability of the most reliable component.
• Implications of Parallel Systems for Equipment
1 Use parallel arrangements when the risk of failure has high DAFT Cost consequences.
2 Consider providing various paths for product to take in production plants with in-series equipment.
3 Build redundancy into your systems so there is more than one way to do a thing.
m |
|
|
|
m |
|
|
|
m |
|
m |
|
|
|
|
|
|
|
|
|
||||
|
|
|
|
|
|
|
|
|
|
|
|
|
|
|
|
|
|
|
|
|
|
|
|
m |
|
|
|
m |
|
|
|
m |
|
m |
|
|
|
|
|
|
|
|
|
||||
|
|
|
|
|
|
|
|
Which arrangement is more reliable if m = 0.9? What percentage improvement is the more reliable?
www.lifetime-reliability.com
86
A parallel system has certain properties from which implications of parallel system behaviour and constraints can be drawn. The left-hand arrangement is the more reliable, having a reliability of 0.98 vs 0.964.
- 98 -

Phone: +61 (0) 402 731 563
Fax: +61 (8) 9457 8642
Email: info@lifetime-reliability.com
Website: www.lifetime-reliability.com
The Reliability of Systems of Parts and
Components (i.e. a Machine)
The shape and position of the „system‟ curve is adjustable by varying the policies controlling quality and maintenance!
The reliability of a machine is always less than its parts. When one part fails the whole machine fails. With many parts in a machine, there are many chances of failure.
|
Quality |
|
Replace |
System |
Control, |
|
Equipment, |
Training, |
|
Add more |
|
Rate of |
|
||
Precision |
|
components |
|
Failing |
|
||
|
Assembly |
PM, PdM (Condition Monitoring), Precision Operation |
to PM |
|
|
|
|
|
A Single System |
Mean of Many |
|
|
Systems |
||
|
(machine) |
|
|
Component |
|
(machines) |
|
|
|
||
Rate of |
|
|
|
Failing |
|
|
|
Time – Age of System
The Maintenance Zones of Equipment Life
To improve the reliability of a series of parts (that‟s a machine) we must improve
the reliability of each part. We must ensure each part gets its maximum life.
www.lifetime-reliability.com
87
When components are combined together into a machine or assembly they form systems of parts. The system fails every time a component fails. Hence system reliability is lower than individual component reliability.
The wavy curve is the reliability of a single machine. As its parts fail the machine reliability curve moves. It goes upward, indicating high rates of failure, when many parts break often, and downwards (indicating reduced rates of failure) when parts do not fail. The message to take away is that if you want highly reliable machines you must first have highly reliable parts.
When we have many identical machines run under identical conditions then we get the olive coloured an average curve for the entire group of machines.
To improve system reliability it is necessary to either improve individual component reliability, or to include redundancy. In all cases it is worthwhile to adopt system-wide best practices, as they benefit every part of the system.
Within the slide is shown various strategies to adopt to reduce the chance of failure, depending on the stage of the equipment life cycle.
- 99 -

Phone: +61 (0) 402 731 563
Fax: +61 (8) 9457 8642
Email: info@lifetime-reliability.com
Website: www.lifetime-reliability.com
Equipment Reliability Strategies
Rate of
Failing
How to Drive the Chance Curve Down? |
Quality Control, |
|
|
||
How to Push the Time of the Curve Back? |
Skills Training, |
|
Precision Assembly |
||
|
How to Pull the Position of the Curve Lower?
Time – Age of Equipment
|
Strategies for the Infant Mortality Maintenance Zone |
|
|
|
|
|
|
|
|
PM, |
|
Rate of |
PdM, |
|
Failing |
Precision |
|
|
||
|
Operation |
|
|
|
|
|
How to Drive the Position of the Curve Lower? |
|
|
Time – Age of Equipment |
|
|
Strategies for the Random Failure Maintenance Zone |
|
|
|
|
|
|
How to Lower the Curve Steepness? |
|
Rate of |
Replace Equipment, |
How to Push the Start of the |
|
Failing |
Add more components |
Rising Curve Back? |
|
|
to renewal PM |
|
|
|
Time – Age of Equipment |
|
|
|
Strategies for the Wear-Out Failure Maintenance Zone |
88 |
|
|
|
|
|
Since reliability can only be improved if failure is prevented, the diagram asks what can be done at the various stages of equipment life to deduce the chance of failure occurring. By selecting the right strategies and practices we can mould the chance of failure curve to what we want.
“Equipment reliability is malleable by choice of policy and quality of practice.”
|
|
|
|
|
ERROR INDUCED ZONE |
|
STRESS INDUCED ZONE |
AGE INDUCED ZONE |
|
|
||
|
|
|
|
|
• Better quality control |
• |
Condition Monitoring |
• More parts on PM |
|
|
||
|
|
|
|
|
• Higher skills training |
• |
Better operator training |
• Better materials |
|
|
||
|
|
|
|
|
• Precision assembly |
• |
Total Productive Maintenance |
• Considerate operation |
|
|
||
|
|
|
|
|
• Precision installation |
• |
Precision Maintenance |
• Degradation Management |
|
|
|
|
|
|
|
|
|
|
|
|
|
||||
|
|
|
|
|
• No substandard material |
• |
Better design/application choice |
• Timely maintenance |
|
|
|
|
|
|
|
|
|
|
|
|
|
||||
|
|
|
|
|
• No manufacturing errors |
• |
Material choices |
|
|
|
|
|
|
|
|
|
|
• |
Machine protection devices |
|
|
|
|
|
|
|
|
|
|
|
• Robust packaging |
|
|
|
|
|
||
|
|
|
|
|
• |
Operator ITCL |
|
|
|
|
|
|
|
|
|
|
|
|
|
|
|
|
|
||
|
|
|
|
|
|
• Deformation Management |
|
Old Machine |
|
|||
|
|
|
|
|
|
• Defect Elimination |
|
|
||||
|
|
|
|
|
|
|
|
|
|
|
||
|
|
|
|
System |
• „Acts of God‟ |
|
Better Machine |
|
||||
|
|
|
|
Rate of |
|
|
||||||
|
|
|
|
|
|
|
|
|
|
|
||
|
|
|
|
Failing |
|
|
|
|
|
|
|
|
|
|
|
|
|
|
|
|
|
|
|
|
|
|
|
|
Component |
|
|
|
Time or Usage Age of System |
|
||||
|
|
|
|
|
|
|
|
|
|
|||
|
|
|
Rates of |
|
|
|
|
|
|
|
||
|
|
|
|
Failing |
|
|
|
|
|
|
|
|
|
|
|
|
|
|
|
|
|
|
|||
When |
we |
remove |
|
Remove Causes |
|
Time or Usage Age of Parts |
|
|
||||
parts‟ |
|
failure |
|
by |
|
of Parts‟ Failure |
|
|
|
|
|
|
changing |
our |
policies |
|
|
|
|
|
|
|
|||
and |
using |
|
better |
|
|
|
|
|
|
|
||
practices, |
equipment |
|
|
|
|
|
|
|
||||
becomes more reliable |
|
ITCL: inspect, tighten, clean, lubricate |
89 |
|||||||||
|
|
|
|
|
|
|
||||||
- 100 -