

Economics_-_New_Ways_of_Thinking
.pdfInvesting in Yourself
When most people think of investing, they think of
investing in such things as stocks, bonds, and real estate. Rarely do we think of investing in ourselves. Investing in yourself, however, is one of the most important things you can do.
Everyone wants a high return from their investments. What could you invest in today—as a high school student—that could provide you with a high return tomorrow? Before we tell you what it is, let’s look at how the average 15to 17-year-old spends his or her time each week.
How You Spend Your Time
According to a University of Michigan study, the average 15to 17-year-old (in 2002–2003) each week spent 32 hours in school, 4 hours and 47 minutes socializing or
visiting with friends, 3 hours playing sports, 1 hour and 17 minutes reading, 2 hours and 45 minutes on the computer, 7 hours eating, 5 hours and 43 minutes doing household work, and 14 hours and 36 minutes watching television.
Let’s focus on the 14 hours and 36 minutes a week watching television. Could we reallocate some of the TV time toward something that might provide us with a higher return
(than watching television provides us)? For example, as a high school student, you might be thinking of attend-
ing college. Getting into a good college could be the stepping stone to a good-paying job in the future. According to recent data, college graduates earn substantially more over their lifetimes than those with only a high school diploma (see Exhibit 5-7).
It’s clear that if you invest more time, effort, and money in your education, your level of income will grow substantially.
E X H I B I T 5-7 Average Annual Earnings by Level of Education
|
|
Not a high school graduate |
|
$18,826 |
|
||||||
|
|
|
|
|
|
|
|
|
|
|
|
High school graduate only |
|||||||||||
|
|
|
$27,280 |
||||||||
|
|
|
|
|
|
|
|
|
|||
Some college, no degree |
|||||||||||
|
|
|
$29,725 |
|
|||||||
|
|
|
|
|
|
|
|||||
Associate |
s degree |
||||||||||
|
|
|
|
$34,177 |
|
||||||
|
|
|
|
|
|
|
|
|
|
|
|
Bachelor s degree |
$51,194 |
Master |
|
s degree |
|
$60,445 |
|
|||
|
|
|
|
|
|
|||
Ph.D. degree |
||||||||
|
|
$89,724 |
||||||
Source: Statistical Abstract of the United States, 2004 2005.
You Are Preparing for
College, Aren’t You?
So, how do you get into a good college? First, you need to have good high school grades. Second, you need to have a reasonably high score on one of the two standardized tests that college-bound high school juniors and seniors take: the SAT and ACT.
Many high school students take these standardized tests without studying for them. They simply get a good night’s sleep the night before the test, and then take it.
Think of an alternative way to proceed. Suppose, beginning either at the end of your sophomore year or at the beginning of your junior year of high school, you were to watch 2 hours less of television a week and studied for the SAT or ACT instead.
Now ask yourself how many hours most juniors in high school spend studying for the SAT or ACT. Many say “no more than 5 hours.” Yet, the SAT and ACT are important factors considered by college admission offices. (If you have already taken the SAT and ACT, apply the following suggestions to college courses and tests you’ll take in
the future. If you are a senior and haven’t taken them, it’s not too late to plan and prepare to take them.)
Are 100 Hours of Studying
Too Many?
What if instead of spending only 5 hours studying for the SAT or ACT, a student spent 100 hours studying.
124 Chapter 5 Supply

These 100 hours are easily found if the average 15to 17-year-old would simply cut back his or her TV viewing. If you are the average 15to 17-year-old, and watch 14 hours and 36 minutes of television a week, consider cutting that down to 12 hours and 36 minutes. With the “freed up” 2 hours, you can now study for the SAT or ACT. In 50 weeks, you would have studied 100 hours. Studying diligently for
2 hours a week for 50 weeks for the SAT or ACT is likely to boost your overall score.
Will you “earn a high return” at the end of the 100 hours? We cannot guarantee how high the return will be (how much you will boost your score over not studying), but certainly it could be substantial. A substantial improvement in your score could pave the way to a good college in your future and everything else that may follow.
The Best Use of Your Time
So how should you proceed if you are now convinced that 2 hours of investing in yourself might bring a higher return than watching an additional 2 hours of television? With respect to either the SAT or ACT, you can go to the appropriate Web sites to see what the tests look like. Go to www.emcp.net/SAT for the SAT. For the ACT, go to www.emcp.net/ACT.
We also strongly urge you to purchase one or two of the test preparation books (on the SAT and ACT) that you can find at almost any bookstore. Most of these test prep books not only provide you with sample tests, but with plenty of study material.
The thing to do once you have purchased these books is to study slowly and carefully. Don’t just take the sample tests and put the books away.
You will also find sections in these books on grammar, vocabulary words, critical reading, writing an essay, and more. Read each section carefully, and then read it again. Do all the exercises. Then do them
again. Take the sample tests. Then make sure you know what you got wrong on each sample test. Then take more sample tests.
If you simply cut out 2 hours of television a week, and devote that time to studying for the SAT or ACT, you will be surprised how much you learn and how much you can boost your test score.
|
|
|
|
|
|
|
|
|
|
|
|
Economics |
Action |
|
Plan |
|
|
|||||||||||||||||||||||||||||||||
My Personal |
|
|
|
|
|
|
|
|
|
|
|
|||||||||||||||||||||||||||||||||||||||
|
|
|
|
|
|
|
|
|
|
|
and some |
|
|
|||||||||||||||||||||||||||||||||||||
|
|
you may want |
to consider |
|
|
|||||||||||||||||||||||||||||||||||||||||||||
|
|
|
|
|
|
|
|
|
|
|
|
|
|
|
|
|||||||||||||||||||||||||||||||||||
|
|
are some |
|
points |
|
|
|
|
|
|
|
|
|
|
|
|
||||||||||||||||||||||||||||||||||
Here |
|
|
|
|
|
|
|
|
|
|
|
|
|
|
|
|
|
|
|
|
|
|
|
|
|
|||||||||||||||||||||||||
|
|
|
to put into |
practice: |
|
|
|
|
|
|
|
|
|
|
|
|
|
|
|
|
||||||||||||||||||||||||||||||
|
|
|
|
want |
|
|
|
|
|
|
|
|
|
|
|
|
|
|
|
|
||||||||||||||||||||||||||||||
|
|
you might |
|
|
|
|
|
|
|
|
|
|
|
|
|
36 |
|
|||||||||||||||||||||||||||||||||
guidelines |
|
|
|
|
|
|
|
|
|
|
14 hours and |
|
||||||||||||||||||||||||||||||||||||||
|
|
|
|
|
|
|
|
|
|
|
|
|
|
|
|
|
|
|
|
|||||||||||||||||||||||||||||||
|
|
|
|
|
|
|
|
|
|
|
-old |
spends |
|
|||||||||||||||||||||||||||||||||||||
|
|
|
|
|
|
|
|
|
|
|
|
|
|
|
|
|
|
|
|
|
|
|||||||||||||||||||||||||||||
|
|
|
|
|
|
|
|
|
|
|
|
|
|
|
|
|
|
|
|
|
|
|
|
|
|
|
|
|
|
|
|
|
|
|
|
|
|
|
||||||||||||
|
|
|
|
|
|
|
|
|
|
|
|
|
|
|
|
|
|
|
-year |
|
|
|
|
|
|
|
|
|
|
|
|
|
|
|
|
|
|
|
|
|
|
|
|
|
|
|
||||
|
|
|
|
|
|
|
|
|
|
|
|
- |
to 17 |
|
|
|
|
|
|
|
|
|
|
|
|
|
|
|
|
|
|
|
|
|
|
|
|
do |
too, |
|
|
|||||||||
1. |
The average |
15 |
|
|
|
|
|
|
|
|
|
|
|
|
|
|
|
|
|
|
|
|
|
|
. If you |
|
|
|
|
|
||||||||||||||||||||
|
|
|
|
|
|
|
|
|
|
|
|
|
|
|
|
|
|
|
|
|
|
|
|
television |
|
|
|
|
|
|
|
|
|
|
|
|
|
|
|
|||||||||||
|
|
minutes |
each week |
watching |
|
|
down your TV |
|
||||||||||||||||||||||||||||||||||||||||||
|
|
|
|
|
|
|
cutting |
|
|
|||||||||||||||||||||||||||||||||||||||||
|
|
|
|
to consider |
|
|
||||||||||||||||||||||||||||||||||||||||||||
|
|
|
|
|
|
|
|
want |
|
|
|
|
|
|
|
|
|
|
|
|
|
|
||||||||||||||||||||||||||||
|
|
|
then |
you might |
|
|
|
|
|
|
|
|
|
|
|
|
|
|
|
|
|
|
|
|
||||||||||||||||||||||||||
|
|
|
|
|
|
|
. |
|
|
|
|
|
|
|
|
|
|
|
|
|
|
|
|
|
|
|
|
|
|
|
|
|
|
|||||||||||||||||
|
|
|
|
|
|
|
|
|
|
|
|
|
|
|
|
|
|
|
|
|
|
|
|
|
|
|
|
|
|
|
|
|
|
|
|
|
|
|||||||||||||
|
|
|
viewing by |
|
2 hours |
a week |
|
|
|
|
|
|
|
|
|
|
|
|
|
|
|
|
|
|
|
|
|
|
|
|
___ |
|
||||||||||||||||||
|
|
|
|
|
|
|
|
my television |
watching |
time by ___ |
hours/ |
|
|
|||||||||||||||||||||||||||||||||||||
|
I will reduce |
|
|
|
|
|
|
|
|
|
||||||||||||||||||||||||||||||||||||||||
|
|
|
|
|
|
|
|
|
|
|
|
|
|
|
|
|
|
|
|
|
|
|||||||||||||||||||||||||||||
|
|
|
|
|
|
|
|
|
|
|
|
|
|
|
|
|
|
|
|
|
|
|
|
|
|
|
|
|
|
|
|
|||||||||||||||||||
|
|
|
|
|
. |
|
|
|
|
|
|
|
|
|
|
|
|
|
|
|
|
|
|
|
|
|
|
|
|
|
|
|
|
|
|
|
|
|
|
|
|
|
|
|||||||
|
|
|
|
|
|
|
|
|
|
|
|
|
|
|
|
|
|
|
|
|
|
|
|
|
|
|
|
|
|
|
|
|
|
|
|
|
|
|
|
|
|
|
|
|
|
|
|
|
|
|
|
minutes |
per day |
|
|
|
|
|
|
|
|
|
|
|
|
|
|
|
|
for the SAT |
or ACT can |
|
|||||||||||||||||||||||||||||
|
|
|
|
|
|
|
|
|
hours studying |
|
|
|||||||||||||||||||||||||||||||||||||||
|
|
|
|
|
|
|
|
|
|
100 |
|
|
|
|
|
|
|
|
|
high |
||||||||||||||||||||||||||||||
|
|
Spending |
|
|
|
|
|
|
|
|
. |
A reasonably |
||||||||||||||||||||||||||||||||||||||
|
|
|
|
|
|
|
|
|
|
|
|
|
|
|
test |
|
|
|
|
|
|
|||||||||||||||||||||||||||||
|
2. |
|
|
substantially |
|
increase |
|
your |
|
|
|
|
|
score |
|
|
that you |
will be |
|
|||||||||||||||||||||||||||||||
|
|
|
|
|
|
|
|
|
|
|
|
|
|
|
|
|
|
|
||||||||||||||||||||||||||||||||
|
|
|
|
|
|
|
|
the probability |
a |
|||||||||||||||||||||||||||||||||||||||||
|
|
|
|
|
|
|
|
|
|
|
|
|
|
|
|
|
||||||||||||||||||||||||||||||||||
|
|
|
|
|
|
|
|
|
ACT will increase |
|
|
|
|
|
|
|
|
2 hours |
||||||||||||||||||||||||||||||||
|
|
|
|
|
SAT or |
. If |
you were to spend |
|
||||||||||||||||||||||||||||||||||||||||||
|
|
|
|
|
|
|
|
|
|
|
|
|
|
|
|
|
|
|
|
|
|
|
|
|||||||||||||||||||||||||||
|
|
|
|
|
|
|
|
|
|
|
|
to a good |
college |
|
|
|
|
|
|
|
|
|
|
|
|
|
|
|
or ACT, it would |
|||||||||||||||||||||
|
|
|
|
|
admitted |
|
studying for the SAT |
|||||||||||||||||||||||||||||||||||||||||||
|
|
|
|
|
|
50 weeks |
|
|
|
|
|
|
|
|
|
|
. |
|||||||||||||||||||||||||||||||||
|
|
|
|
|
week for |
|
|
|
be studying |
100 hours |
for the test |
|||||||||||||||||||||||||||||||||||||||
|
|
|
|
|
mean |
|
that you would |
you put |
in to an average |
|||||||||||||||||||||||||||||||||||||||||
|
|
|
|
|
|
|
of the time |
|||||||||||||||||||||||||||||||||||||||||||
|
|
|
|
|
|
|
|
|
|
|
|
|
|
-third |
|
|
|
|
|
|
|
|
- |
|||||||||||||||||||||||||||
|
|
|
|
|
|
|
|
|
|
|
|
|
|
|
|
|
|
|
|
|
|
|
|
|
|
|
|
|
|
|
|
|
|
|
|
|
|
|
|
plus home |
||||||||||
|
|
|
|
|
This is |
only one |
|
|
(if we count |
in-class time |
||||||||||||||||||||||||||||||||||||||||
|
|
|
|
|
|
|
|
course |
|
|
|
|
|
|
||||||||||||||||||||||||||||||||||||
|
|
|
|
|
high school |
|
|
|
|
|
|
|
|
|
|
|
|
|
|
|
|
|
|
|||||||||||||||||||||||||||
|
|
|
|
|
|
|
|
|
|
|
|
|
|
|
|
|
|
|
|
|
|
|
|
|
|
|
|
|
|
|
|
|
|
|
|
|||||||||||||||
|
|
|
|
|
|
|
|
|
|
|
|
|
|
|
|
|
|
|
|
|
|
|
|
|
|
|
|
|
|
|
|
|
|
|
|
|
|
|
|
|
|
|
||||||||
|
|
|
|
|
|
|
|
|
|
|
|
.) |
|
|
|
|
|
|
|
|
|
|
|
|
|
|
|
|
|
|
|
|
|
|
|
|
|
|
|
|
|
|
|
|
|
|
|
|
|
|
|
|
|
|
|
work |
time |
|
|
|
|
|
|
|
|
|
|
|
|
|
|
|
|
|
|
|
|
|
|
|
|
|
|
|
|
|
|
|
|
. |
|
|
|
|
|||||||
|
|
|
|
|
|
|
|
|
|
|
|
___ hours |
per week |
|
studying |
for ___ |
|
|
|
|
|
|||||||||||||||||||||||||||||
|
|
I will devote |
|
|
|
|
|
|
|
|
|
|
|
|
|
|
|
|||||||||||||||||||||||||||||||||
|
|
|
|
|
|
|
|
|
|
|
|
|
|
|
gold, real estate), |
|||||||||||||||||||||||||||||||||||
|
|
|
|
|
|
|
|
|
|
|
|
|
|
|
|
|
|
|
|
|
|
|
|
|||||||||||||||||||||||||||
|
|
|
|
|
|
|
|
|
|
|
|
|
|
|
|
(stocks, |
bonds, |
|||||||||||||||||||||||||||||||||
|
|
|
|
|
|
|
|
|
|
|
|
|
|
|
|
|
|
|
|
|
|
|
|
|
||||||||||||||||||||||||||
|
|
|
|
|
|
|
|
|
|
|
|
|
|
|
|
|
in |
things |
|
|
|
|
|
|
|
|
- |
|||||||||||||||||||||||
|
|
|
|
|
|
|
|
|
|
|
|
|
|
|
|
|
|
|
|
|
|
|
|
|
|
|
|
|
|
|
|
|||||||||||||||||||
|
|
|
|
|
We can invest |
|
|
|
|
|
|
|
|
|
|
|
|
|
|
|
|
|
|
|
|
|
|
|
|
in your |
aca |
|
||||||||||||||||||
|
|
3. |
|
|
|
|
|
|
|
|
|
|
|
|
|
|
|
|
|
. Investing |
|
- |
||||||||||||||||||||||||||||
|
|
|
|
|
|
|
|
|
|
|
|
|
|
|
invest in |
ourselves |
|
|
|
|
|
|
|
|
|
|
|
|
|
|
|
|
||||||||||||||||||
|
|
|
|
|
|
|
and we can |
|
|
high school |
years can end |
up pay |
||||||||||||||||||||||||||||||||||||||
|
|
|
|
|
|
|
|
|
|
|
|
your |
|
|
||||||||||||||||||||||||||||||||||||
|
|
|
|
|
|
|
|
|
|
|
|
self during |
|
|
|
|
|
|
|
|
|
|
|
|
|
|
|
|||||||||||||||||||||||
|
|
|
|
|
|
|
demic |
|
|
|
|
|
|
|
|
|
. Buy YOU! |
|
|
|
|
|
|
|
|
|||||||||||||||||||||||||
|
|
|
|
|
|
|
|
|
|
|
|
|
|
|
|
|
|
|
|
|
|
|
|
|
|
|
|
|
||||||||||||||||||||||
|
|
|
|
|
|
|
ing |
|
a high return |
in the future |
|
|
|
|
|
|
|
|
|
|
|
|
|
|
|
|
. |
|||||||||||||||||||||||
|
|
|
|
|
|
|
|
|
|
|
|
|
|
|
|
|
|
|
|
|
|
|
|
|
|
|
|
|
|
|
|
|
|
|
|
|
|
|||||||||||||
|
|
|
|
|
|
|
|
|
|
|
|
|
|
|
|
|
, I will ______ |
as an investment |
in myself |
|||||||||||||||||||||||||||||||
|
|
|
|
|
|
|
|
|
|
|
|
|
|
|
|
|
|
|
|
|||||||||||||||||||||||||||||||
|
|
|
|
|
|
|
|
|
|
|
|
|
|
|
|
|
|
|
|
|
|
|
|
|
|
|
|
|
|
|
|
|
|
|
|
|||||||||||||||
|
|
|
Beginning |
______ |
|
|
|
|
|
|
|
|
|
|
|
|
|
|
|
|
|
|
|
|
|
|
|
|
|
|
|
|
|
|
|
|
|
|||||||||||||
|
|
|
|
|
|
|
|
|
|
|
|
|
|
|
|
|
|
|
|
|
|
|
|
|
|
|
|
|
|
|
|
|
|
|
|
|
|
|
|
|
|
|
||||||||
Chapter 5 Supply 125

Chapter Summary
Be sure you know and remember the following key points from the chapter sections.
Section 1
The supply of a good or service requires both a supplier’s willingness and ability to produce and sell.
The law of supply says that price and quantity supplied move in the same direction—as price increases, so does quantity supplied, and vice versa—called a direct relationship.
Quantity supplied refers to the number of units of a good produced and offered for sale at a specific price.
The supply curve is an upward-sloping line (from left to right) that shows the amount of a good sellers are willing and able to sell at various prices.
A market supply curve represents the sum of all individual firms’ supply curves for a particular good.
Section 2
Resource prices, advances in technology, subsidies, quotas, the number of sellers, future price expectations, and weather are all factors that can cause a shift in the supply curve.
The factor that causes a change in the quantity supplied is price.
The elasticity of supply measures the relationship between the percentage change in price and the percentage change in quantity supplied.
Supply is elastic when quantity supplied changes by a greater percentage than price.
Supply is inelastic when quantity supplied changes by a smaller percentage than price.
Unit-elastic supply exists when quantity supplied changes by the same percentage as price.
Economics Vocabulary
To reinforce your knowledge of the key terms in this chapter, fill in the following blanks on a separate piece of paper with the appropriate word or phrase.
1. A(n) ______ is the numerical representation of the law of supply.
2. A(n) ______ is the graphic representation of the law of supply.
3.According to the law of supply, as price increases, ______ rises.
4. Supply is ______ if the percentage change in quantity supplied is greater than the percentage change in price.
5.Supply is ______ if the percentage change in quantity supplied is less than the percentage
change in price.
6. ______ refers to the number of units of a good produced and offered for sale at a specific price.
Understanding the Main Ideas
Write answers to the following questions to review the main ideas in this chapter.
1.Explain the term supply as it applies to economics. What is the difference between supply and quantity supplied?
2.Express the law of supply in (a) words,
(b) symbols, and (c) graphic form.
3.Luisa is willing but not able to produce and offer to sell plastic cups. Is Luisa a supplier of plastic cups? Explain your answer.
4.Are all supply curves upward sloping? Why or why not?
5.Write out a supply schedule for four different combinations of price and quantity supplied.
6.Identify whether the supply curve for each of the following would be vertical or upward sloping.
a. desks in your classroom at this moment b. seats at a football stadium at this moment c. television sets over time
d. Hewlett-Packard computers over time e. Picasso paintings (Hint: Picasso is dead.)
7.What does it mean when a supply curve shifts to the right? To the left?
126 Chapter 5 Supply
8.Between the price of $10 and $14, supply is inelastic. What does this statement mean?
9.Explain what happens to the supply curve of television sets as a consequence of each of the following.
a.Resource prices fall.
b.A technological advancement occurs in the television industry.
c.A tax is placed on the production of television sets.
10.Identify the factors that can change supply. Identify the factor that can change quantity supplied.
11.In each of the following cases, identify whether the supply of the good is elastic, inelastic, or unit-elastic.
a.The price of books increases 10 percent, and the quantity supplied of books increases 14 percent.
b.The price of bread increases 2 percent, and the quantity supplied of bread increases 2 percent.
c.The price of telephones decreases 6 percent, and the quantity supplied of telephones decreases 8 percent.
12.What factor causes movement along a supply curve?
Doing the Math
Do the calculations necessary to solve the following problems.
1.A house-building company spends $40 million to produce 400 houses. What is the average cost, or per-unit cost, of a house?
2.Firm A sold 400 stereos for a total of $200,000, and firm B sold 550 stereos for a total of $275,000. Which firm is charging more per unit? Graph the supply curve.
3.If the percentage change in price is 5 percent and the percentage change in quantity supplied is 10 percent, calculate the elasticity of supply.
4.Currently the price of a good is $10, and the quantity supplied is 300 units. For every $1 increase in price, quantity supplied rises by 5 units. What is the quantity supplied at a price of $22?
Working with Graphs and Charts
Use Exhibit 5-8 to answer the following questions. P = price, and Qs = quantity supplied.
1.What does Exhibit 5-8(a) represent?
2.Which part of Exhibit 5-8 represents a change in supply due to technological advancement?
|
|
|
|
|
|
|
|
|
|
|
|
|
|
|
|
|
|
|
|
|
|
|
|
|
|
|
|
|
|
|
E X H I B I T 5-8 |
|
|
|
|
|
|
|
|
|
|
|
|
|
|
|
|
|
|
|
|
|
|||||
|
|
|
|
|
|
|
|
|
|
|
|
|
|
|
|
|
|
|
|
|
|
|
|
|
|
|
||
|
|
|
|
S |
|
|
|
|
|
|
|
|
S |
1 |
|
|
|
|
|
|
|
|
|
|
S |
|
||
|
|
|
|
2 |
|
|
|
|
|
|
|
|
|
|
|
|
|
|
|
|
||||||||
|
|
|
|
|
|
S |
|
|
|
|
|
|
S |
|
|
|
|
|
|
|
|
|
||||||
|
|
|
|
|
|
|
|
|
|
|
|
|
||||||||||||||||
|
|
|
|
|
|
|
|
1 |
|
|
|
|
|
|
|
|
2 |
|
||||||||||
|
|
|
|
|
|
|
|
|
|
|
|
|
|
|
|
|
|
|
|
|
|
|
|
|
|
|
||
|
|
|
|
|
|
|
|
|
|
|
|
|
|
|
|
|
|
|
|
|
|
|
|
B |
||||
|
P |
|
|
|
|
|
|
|
|
|
|
|
|
|
|
|
|
|
|
|
|
|
|
|
|
|
|
|
|
|
|
|
|
|
|
|
|
|
|
|
|
|
|
|
|
|
|
|
|
|
|
||||||
|
|
|
|
|
|
|
|
|
|
|
|
|
|
|
|
|
|
|
|
|
A |
|||||||
|
|
|
|
|
|
|
|
|
|
|
|
s |
|
|
|
|
|
|
|
|
|
|
|
|
|
|
||
|
0 |
|
|
|
|
|
|
|
|
|
Q |
|
|
|
|
|
|
|
|
|
|
|
|
|||||
|
|
|
|
|
|
|
|
|
|
|
|
|
|
|
||||||||||||||
|
|
|
|
|
|
|
|
|
|
|
|
|
|
|
|
|
|
|
|
|
|
|
||||||
|
|
|
|
|
|
|
|
|
|
|
|
|
|
|
|
|
|
|
|
|
|
|
|
|
|
|
|
|
|
|
|
|
|
|
|
|
|
|
(b) |
||||||||||||||||||
|
|
(a) |
|
|
(c) |
|||||||||||||||||||||||
|
|
|
|
|
|
|
|
|
|
|
|
|
|
|
|
|
|
|
|
|
|
|
|
|
|
|
|
|
3.What does Exhibit 5-8(c) represent?
4.Which part of Exhibit 5-8 represents a change in supply due to an increase in resource prices?
Solving Economic Problems
Use your thinking skills and the information you learned in this chapter to find solutions to the following problems.
1.Application. The law of supply pertains to many goods. For example, if the price of shoes rises, in time the quantity supplied of shoes will rise, too. Devise an experiment to test whether studying for an economics test is subject to the law of supply.
2.Cause and Effect. Explain the process by which a tax, applied to the production of a good, changes the supply of the good.
Go to www.emcp.net/economics and choose Economics: New Ways of Thinking, Chapter 5, if you need more help in preparing for the chapter test.
Chapter 5 Supply 127
Why It Matters
Markets and prices are a little like the air you breathe—they are everywhere. Anytime you buy or sell something, you
will buy or sell that something at a price, in a market. Supply and demand go together to determine
price. What determines the price of the car you buy? Answer: supply and demand. What determines the price that you sell your labor services for? Answer: supply and demand. What determines the price of the house you buy? Answer:
supply and demand.
We will learn about supply and demand together in this chapter by looking at several examples from everyday life. We will also learn about price, which is the outcome of demand and supply working at the same time.
128

The following events occurred one day in June.
8:45 A.M. Gordon is online checking the price of a stock he is thinking of buying. Ten minutes ago the price was $43.23. Right now, it is $42.18. Gordon wonders whether he should buy
the stock now or wait another 10 minutes, or 20 minutes, or several hours.
• What causes the price of a share of stock to drop $1.05 in 10 minutes?
8:47 A.M. Jennifer is driving to work. With so many cars on the road, Jennifer is only moving 15 mph. She is listening to a song on the radio and wondering why traffic is
so bad during the morning commute.
• What does traffic congestion have to do with supply and demand?
2:17 P.M. Malcolm is at home watching a baseball game on television. The announcer is talking about the player who is currently at bat. The player earns $7
million a year playing baseball. Malcolm wonders why some people earn so much just to play a game.
• Why do some baseball players earn millions of dollars to play baseball?
8:13 P.M. Alice and Parker are at home watching their favorite television show. Alice says, “You know, I read that the show has really high ratings.” “Good,” says Parker, “that means it won’t be canceled any time soon.
• How are TV ratings like the economic concept of price?
9:05 P.M. After she hears a knock at her door, Evelyn walks to the door and opens it. It’s the pizza delivery guy. He takes a large pizza out of the hot case and says that she owes him $15.75. She gives him a $20 bill. After she receives her change, she gives the pizza delivery guy a $3 tip.
• Why was the price of the pizza $15.75? Why wasn’t it $12 or $18?
129
Supply and
Demand Together
Focus Questions
How do supply and demand together determine price?
What happens to price when the market has a surplus?
What happens to price when the market has a shortage?
Key Terms
surplus shortage equilibrium
equilibrium quantity equilibrium price inventory
price ceiling price floor
surplus
The condition in which the quantity supplied of a good is greater than the quantity demanded. Surpluses occur only at prices above equilibrium price.
Moving to Equilibrium
Imagine a pair of scissors. Which blade does the cutting, the top blade or the bottom? It’s impossible to say, isn’t it? In much the same way, it is impossible to say whether demand or supply is responsible for the prices we pay for goods and services. The fact is, supply and demand work together to determine price.
To understand exactly how supply and demand work together, imagine that you are at an auction where 40,000 bushels of corn are being sold. All of the potential buyers of corn are sitting in front of computers. At any given price, the buyers simply key in the number of bushels they want to buy. The auction begins with the auctioneer calling out a price of $6. (Follow along in Exhibit 6-1 on the next page as you read about what is happening at the auction.)
•At $6 a bushel, the potential buyers think for a second, and then they all enter into their computers the number of bushels they want to buy at that price. The total that the buyers enter is 20,000 bushels,
which is the quantity demanded of corn at $6 per bushel (see Exhibit 6-1). The quantity supplied, though, is 40,000. In economics, when quantity supplied is greater than quantity demanded, a surplus exists. At a price of $6 per bushel, the surplus equals 20,000 bushels (the difference between the quantity supplied and the quantity demanded). So, what do you think will happen next? The auctioneer, realizing that 20,000 bushels of corn will go unsold at $6, decides to lower the price per bushel to $5.
•At $5 a bushel, the buyers again key in the number of bushels they will buy, and the total increases to 30,000 bushels. This amount still leaves a surplus of corn—specifically, 10,000 bushels. So, what will the auctioneer do? Again, he lowers the price, this time to $2.
•At only $2 a bushel, the buyers want to buy a lot more corn, and the total quantity demanded jumps to 60,000 bushels. At first it sounds like a good thing, but do you see why it is a problem? (Look again at Exhibit 6-1.) Quantity
130 Chapter 6 Price: Supply and Demand Together
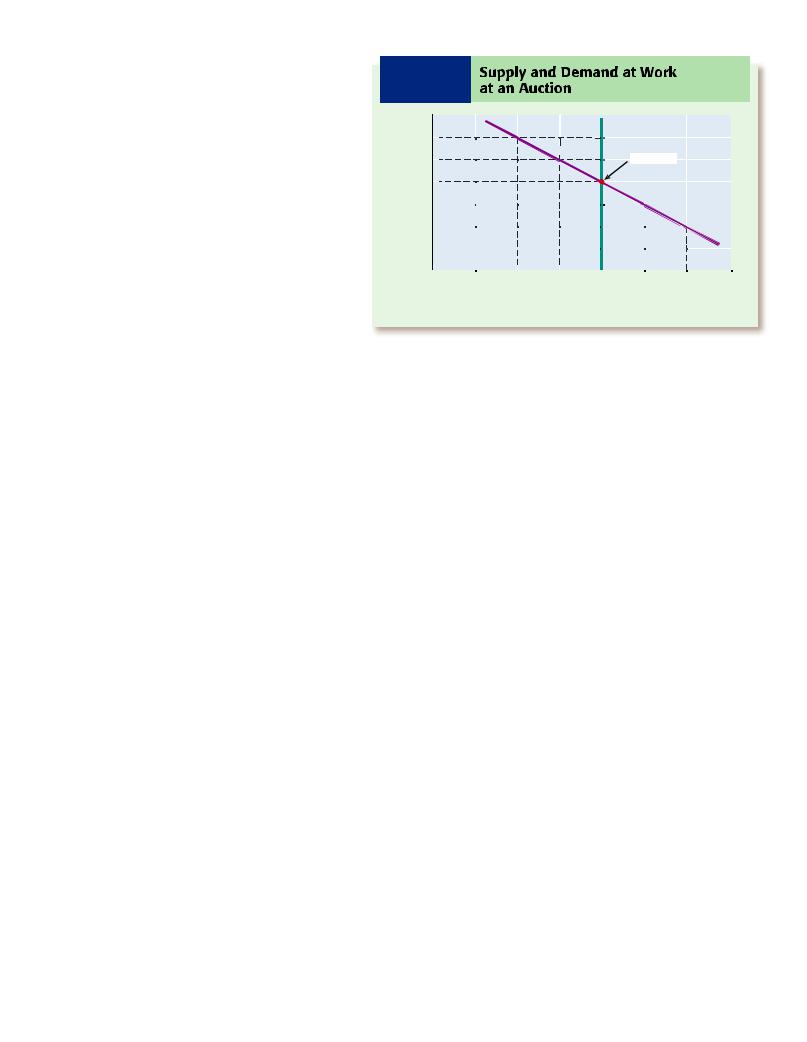
demanded is now greater than quantity supplied, a condition that economists call a shortage. The auctioneer, realizing that he can’t sell 60,000 bushels of corn when he only has 40,000, decides to raise the price to $3.
•As we would expect, when the price goes up, from $2 to $3 a bushel, the buyers want less corn. The quantity demanded falls to 50,000 bushels, but still there is a shortage. So the auctioneer again raises the price, this time to $4.
•At $4 a bushel, the buyers key in a total of 40,000 bushels, exactly the same amount as the auctioneer has to sell. Quantity demanded equals quantity supplied. The auction stops. At this point, but not until this point, economists would say that the corn market is in equilibrium. A market is said to be in equilibrium when the quantity
demanded of a good equals the quantity supplied. In this example, 40,000 bushels is referred to as the equilibrium quantity (the quantity of a good bought and sold in a market that is in equilibrium). The price of $4 is referred to as the equilibrium price (the price at which a good is bought and sold in a market that is in equilibrium).
Relationship of quantity supplied |
Market |
(Qs) to quantity demanded (Qd) |
condition |
Qs > Qd |
Surplus |
Qd > Qs |
Shortage |
Qd = Qs |
Equilibrium |
When the price was $6 a bushel and there was a surplus of corn, the auctioneer lowered the price. When the price was $2, resulting in a shortage, he raised the price. The behavior of the auctioneer can be summarized this way: If a surplus exists, lower the price; if a shortage exists, raise the price. In this way, the auctioneer moved the corn market into equilibrium.
Not all markets have auctioneers. (When was the last time you saw an auctioneer in the grocery store?) Still, many markets act as if an auctioneer is calling out higher and lower prices until equilibrium price is
E X H I B I T 6-1 Supply and Demand at Work at an Auction
|
|
|
|
S |
|
|
$6 |
|
|
|
|
|
|
$5 |
|
|
|
|
Equilibrium |
|
$4 |
|
|
|
|
|
|
Price |
|
|
|
|
|
|
$3 |
|
|
|
|
|
|
$2 |
|
|
|
|
|
|
$1 |
|
|
|
|
|
D |
|
|
|
|
|
|
|
0 |
10 |
20 |
30 |
40 |
50 |
60 |
Quantity (thousands of bushels of corn)
Only at a price of $4 is the quantity demanded equal to the quantity supplied, with neither a surplus nor a shortage.
reached. In many real-world markets, prices fall when a surplus occurs and rise when a shortage happens.
Why Does Price Fall When
a Surplus Occurs?
With a surplus, suppliers will not be able to sell all they had hoped to sell, so their inventories (stock of goods on hand) grow beyond the normal level. Storing extra goods can be costly and inefficient; thus sellers want to reduce their inventories. Some will lower prices to do so; some will cut back on producing output; others will do a little of both. As shown in Exhibit 6-2, price and output tend to fall until equilibrium is achieved.
Why Does Price Rise When
There Is a Shortage?
With a shortage, buyers will not be able to buy all they had hoped to buy. Some buyers will offer to pay a higher price to get sellers to sell to them rather than other buyers. The higher prices will motivate suppliers to start producing more output. Thus, in a shortage, the tendency is for price and output to rise until equilibrium is achieved (see Exhibit 6-2 on the next page).
shortage
The condition in which the quantity demanded of a good is greater than the quantity supplied. Shortages occur only at prices below equilibrium price.
equilibrium
In a market the point at which the quantity of a good that buyers are willing and able to buy is equal to the quantity that sellers are willing and able to produce and offer for sale (quantity demanded equals quantity supplied).
equilibrium quantity
The quantity of a good that is bought and sold in a market that is in equilibrium.
equilibrium price
The price at which a good is bought and sold in a market that is in equilibrium.
inventory
The stock of goods that a business or store has on hand.
Section 1 Supply and Demand Together 131
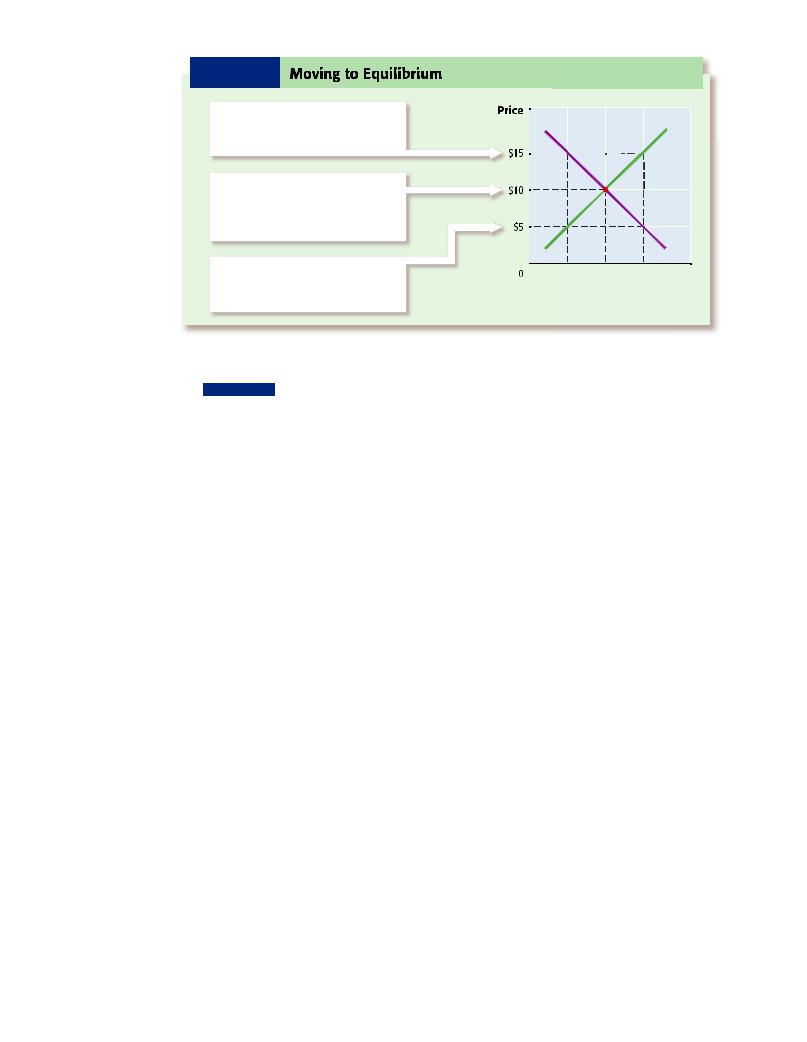
If a surplus occurs, price and quantity of output fall. If a shortage happens, price and quantity of output rise. A price of $10 means neither a surplus nor a shortage, so neither price nor quantity of output changes.
E X H I B I T 6-2
At $15, a surplus occurs. Quantity
supplied (150) is greater than quantity
demanded (50). Price falls.
A price of $10 results in neither a
surplus nor a shortage. Quantity
supplied (100) is equal to quantity demanded (100). Equilibrium occurs.
At $5, a shortage happens. Quantity demanded (150) is greater than quantity supplied (50). Price rises.
S
D
50 100 150
Quantity
We know what a shortage and a surplus look like on a graph, but what do they look like in the real world? Suppose it’s Friday night and your school’s football team is playing at home. Your school stadium seats 2,000 people but only 500 people are in the stands (350 from your school and 150 from your opponents’ school), resulting in a surplus of seats. In other words, the people who wanted to be at the game was a smaller number than seats available in the stands. On the other hand, suppose at another game 2,500 people want to be at the game but the stadium still has only 2,000 seats. Here we see a shortage of seats. Maybe some people will have to stand, or some people will not be admitted to the game.
 Back when the Soviet Union existed (pre-1989), you could walk around Moscow and find very few people in some shops, but long lines of people inside and outside of other shops. At the time, Soviet officials set the prices of the goods and services sold in the country. Often, the prices they set were not equilibrium prices— prices at which quantity demanded equaled quantity supplied. Where the Soviet officials set the price of a good higher than equilibrium price (say, 100 rubles is the equilibrium price and officials set the price at 250 rubles), there was a surplus of that good. This surplus was evidenced by less of the good being purchased than was available for sale, and there-
fore, stores with few customers. Where the Soviet officials set the price of a good lower than equilibrium price (say, 100 rubles is the equilibrium price and officials set the price at 30 rubles), there was a shortage of that good. You could “see” a shortage in the form of a long line of people waiting to buy a good that was likely to be “sold out” before they reached the front of the line.
What Causes Equilibrium Prices to Change?
You now know that equilibrium price is determined by both supply and demand. Can you guess what could cause an equilibrium price to change? You probably guessed right—for the equilibrium price to change, either supply or demand would have to change.
Before looking at changes to equilibrium prices, let’s review your ability to read graphs showing supply and demand curves. Practice reading these graphs will help you use graphs to determine shortages, surpluses, and ultimately, equilibrium prices.
Look at Exhibit 6-2. Start at a price of $15. To find the quantity demanded, follow the dotted horizontal line over to the demand curve (D). Then follow the dotted vertical line downward to the horizontal (or quantity) axis (50). In this way, you find that the quantity demanded at $15 is 50.
132 Chapter 6 Price: Supply and Demand Together

How Much?
Would You
Pay for an
Ocean View?
Once upon a time, a man bought a house. The house
was built on a high cliff overlooking the Atlantic Ocean. The man would get up every morning and drink his coffee as he gazed out over the ocean.
One day a friend visited the man. The friend asked the man how much he thinks he paid for the ocean view he enjoyed daily. The man said, “I didn’t pay anything for the view. I bought the house. The view was just there.”
The friend asked the man if any houses in the neighborhood were similar to his house but without an ocean view. The man said a house right down the street was exactly like his house but without an ocean view. “Was the price of the house down the street the same as the price of your house?” the friend asked. “No,” said the man, “it was $200,000 cheaper.”
“Then that is what you paid for the ocean view,” the friend said. “If the only difference between your
house and the house down the street is the ocean view, then the price difference between the houses is the price of the view.” Of course, another way of putting this relationship is to say that the demand for the man’s house was greater than the demand for the house down the street because the man’s house came with an ocean view and the house down the street didn’t. Higher demand for the house with the view means higher price paid for the house with the view.
The man knew that his friend was right. All this time he thought that he simply paid more for his house. Instead, he paid the same dollar price for his house as the person down the street paid for the identical house, and then he “purchased” the ocean view for $200,000.
Now ask yourself if there is anything for you that is similar to what the house was for the man. Do you buy and pay for things that you are unaware of? If you ever paid more for designer jeans than for the identical (and it must truly be “identical”) nondesigner jeans, then the price difference is what you paid for the name on the back of the jeans. If you ever paid more for Bayer aspirin than for generic aspirin, then the price difference is what
you paid for the name “Bayer.” We are not urging you to stop buying designer jeans or Bayer aspirin. Similarly, we are not saying that it is somehow wrong to buy a house with an ocean view. We are simply pointing out what it is you are paying for.
People who reside in good climate locales
often talk about the good climate being “free.” Someone might say, “Aren’t we lucky to live here? And to think, we don’t have to pay a penny for all this good weather.” Is it true that they don’t pay for the “good weather”?
To find the quantity supplied at $15, again start at the price of $15 on the vertical axis, and follow the dotted horizontal line over to the supply curve (S). Then follow the dotted vertical line downward to the horizontal axis. The number here is 150, so the quantity supplied at $15 is 150.
So, at $15, does a surplus or a shortage occur? Because the quantity supplied (150) is greater than the quantity demanded (50), the result is a surplus.
Now let’s look at some graphs to see what happens when either supply or demand changes.
Section 1 Supply and Demand Together 133