

Economics_-_New_Ways_of_Thinking
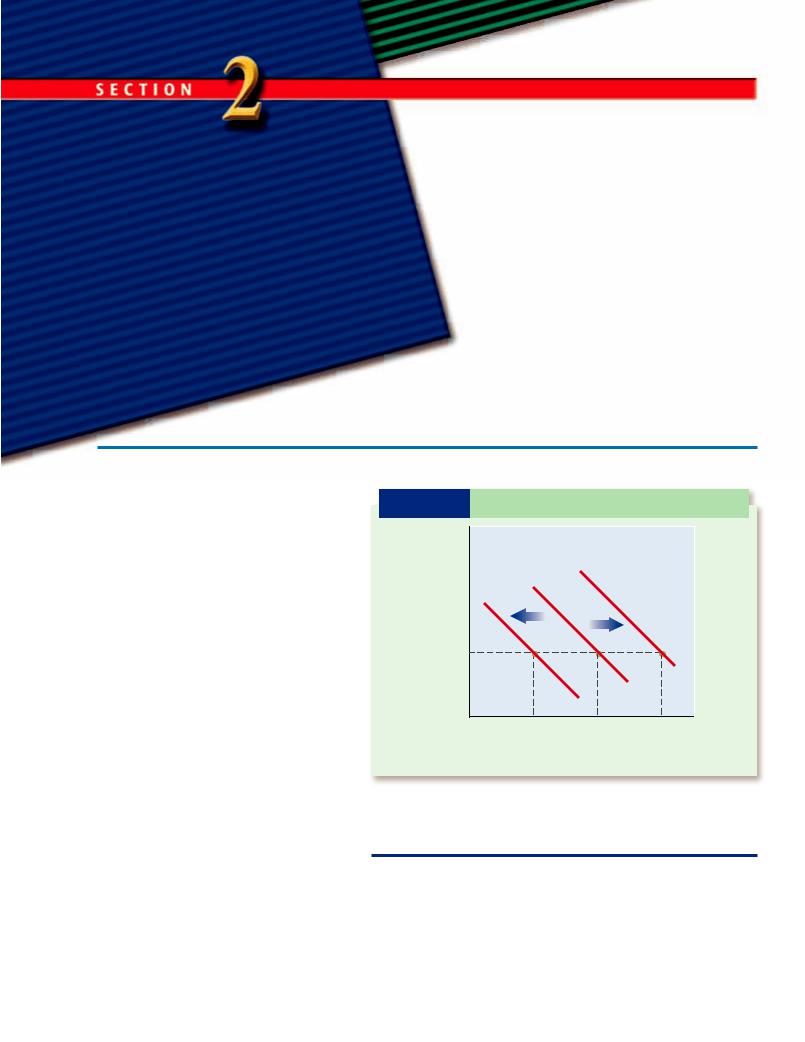
.pdfE X H I B I T 4-2 From Individual Demand Curves to Market Demand Curve
$10 |
|
Harry’s |
$10 |
|
Sally’s |
$10 |
Elizabeth’s |
$10 |
|
|
demand |
||||||
|
demand |
|
demand |
|||||
s |
|
|
|
|
curve |
|
||
DVD |
|
curve |
+ |
|
curve |
+ |
= |
|
|
|
|
||||||
|
|
|
|
|||||
of |
|
|
|
|
|
|||
|
|
|
|
|
|
|
|
|
Price |
|
DHarry |
|
|
DSally |
|
DElizabeth |
|
|
|
|
|
|
|
|||
0 |
2 |
|
0 |
1 |
|
0 |
3 |
0 |
|
|
|
|
|
Quantity demanded of DVDs |
|
||
|
|
(a) |
|
|
(b) |
|
(c) |
|
Market 
 demand
curve
DAll buyers
6
(d)
In parts (a) through (c) you see the individual demand curve for Harry, Sally, and Elizabeth. The market demand curve, shown in part (d), is simply the sum of the individual demand curves.
Stated differently, we know that at a price of $10 per DVD, the quantity demanded of DVDs is 2 for Harry, 1 for Sally, and 3 for Elizabeth. It follows that all three buyers together would like to buy 6 DVDs at a price of $10 per DVD. This point is identified on the market demand curve in part (d).
Suppose that the whole world has only three buyers of DVDs: Harry, Sally, and Elizabeth. At a price of $10 per DVD, quantity demanded is 2 for Harry, 1 for Sally, and 3 for Elizabeth. As a result, the market demand curve would include a point representing a price of $10 per DVD and a market quantity demanded of 6 DVDs (2 1 3).
To see this graphically, look at Exhibit 4-2.
vidual demand curves for Harry, Sally, and Elizabeth, respectively. (To keep things simple, we identify only one point on the demand curve for each person.) Now look at panel (d). Here you can see the market demand curve (for all buyers—Harry, Sally and Elizabeth—of DVDs). Notice that the point we identify on the market demand curve simply represents the quantity demanded of all three buyers together if the
Defining Terms
1.Define:
a.demand
b.quantity demanded
c.market
d.demand schedule
e.demand curve
f.law of demand
2.Use the terms demand and quantity demanded correctly in a sentence about concert tickets.
Reviewing Facts and Concepts
3. State the law of demand.
4. Give an example of a demand schedule.
Critical Thinking
5.Yesterday the price of a good was $10, and the quantity demanded was 100 units. Today the price of the good is $12, and the quantity demanded is 87 units. Did quantity demanded fall because the price increased, or did the price rise because quantity demanded fell?
6.What does the law of diminishing marginal utility have to do with the law of demand?
Applying Economic
Concepts
7.Assume that the law of demand applies to criminal activity. What might community leaders do to reduce the number of crimes committed in the community?
94 Chapter 4 Demand
The Demand
Curve Shifts
Focus Questions
What does it mean when a demand curve shifts to the right?
What does it mean when a demand curve shifts to the left?
What is a normal good? An inferior good? A neutral good?
What factors can change demand?
What factor can change quantity demanded?
Key Terms
normal good inferior good neutral good substitute complement
When Demand Changes,
the Curve Shifts
Demand can go up, and it can go down. For example, the demand for orange juice can rise or fall. The demand for CDs can rise or fall. Every time the demand changes for a good, any good, the demand curve for that good shifts. By shift we mean that it moves; it moves either to the right or to the left.
For example, if the demand for orange juice increases, the demand curve for orange juice shifts to the right. If the demand for orange juice decreases, the demand curve for orange juice shifts to the left.
Demand increases →Demand curve shifts rightward Demand decreases →Demand curve shifts leftward
We can understand shifts in demand curves better with the aid of Exhibit 4-3. Look at the curve labeled D1 in Exhibit 4-3. Suppose this demand curve represents the original and current demand for orange juice. Notice that the quantity demanded at a price of $1 is 400 quarts of orange juice. Now suppose that the demand for orange juice increases. For whatever reason,
E X H I B I T 4-3 Shifts in a Demand Curve
|
|
|
Original |
|
|
|
|
(dollars per quart) |
|
demand curve |
|
|
|
||
$1 |
|
C |
|
A |
|
B |
|
Price |
|
|
|
|
|
|
|
|
|
|
|
|
|
D2 |
|
|
|
|
|
|
D1 |
|
|
|
|
|
|
|
|
|
|
|
|
|
|
|
D3 |
|
|
|
0 |
100 |
200 |
300 |
400 |
500 |
600 |
Quantity demanded of orange juice (quarts)
Moving from D1 (original demand curve) to D2 represents a rightward shift in the demand curve. Demand has increased. Moving from D1 to D3 represents a leftward shift in the demand curve. Demand has decreased.
people want to buy more orange juice. This increase in demand is shown by the demand curve D1 shifting to the right and becoming D2.
Section 2 The Demand Curve Shifts 95
normal good
A good for which the demand rises as income rises and falls as income falls.
inferior good
A good for which the demand falls as income rises and rises as income falls.
neutral good
A good for which the demand remains unchanged as income rises or falls.
What does it mean for a demand curve to shift to the right? The answer is easy if you again look at Exhibit 4-3, focusing on the horizontal axis and the numbers on it, along the bottom of the graph. What is the quantity demanded on curve D2 at the price of $1? The answer is 600 quarts of orange juice. In other words, an increase in demand (or a shift righward in the demand curve) is the same thing as saying, “Buyers want to buy more of a good at each and every price.” In our example, buyers want to buy more quarts of orange juice at $1.
How would we graphically represent a decrease in demand? In Exhibit 4-3, again let’s suppose that D1 is our original and current demand curve. A decrease in demand would then be represented as a shift leftward in the demand curve from D1 to D3. A decrease in demand means that buyers want to buy less of the good at each and every price. Specifically, if we look at the price $1, we see that buyers once wanted to buy 400 quarts of orange juice at $1 a quart, but now they want to buy only 200 quarts at $1 a quart.
QUESTION: Is saying that demand has increased for a good the same as saying that buyers are buying more of the good?
ANSWER: Yes, but with one important qualification. Buyers are buying more of the good at the same price at which they earlier bought less. For example, suppose that on Monday buyers bought 100 units of a good at $3 per unit. Then on Tuesday they bought 150 units of the same good at $3 per unit. An economist would say that demand for the good increased between Monday and Tuesday because the buyers bought more at the same price. If the good’s price changed, the economist would describe the situation differently. The economist would say that the quantity demanded changed, rather than any change in demand.
What Factors Cause Demand Curves to Shift?
Demand curves do not shift to the right or left without cause. They shift because of changes in demand, which can result from changes in several factors. These factors include income, buyer preferences, prices of related goods, number of buyers, and future price.
Income
As their income changes, people may buy more or less of a particular good. You might think that if income goes up, demand will go up, and if income goes down, demand will go down. This relationship is not necessarily the case, however. Much of what happens depends on what goods are involved.
If a person’s income and demand change in the same direction (both go up, or both go down), then the good is called a normal good. For example, if Robert’s income rises and he buys more CDs, then CDs are a normal good for Robert. If, however, income and demand go in different directions (one goes up, while the other goes down), the good is called an inferior good. If a person buys the same amount of the good when income changes, the good is called a neutral good.
 On the average, each month Simon bought and consumed five hot dogs, one steak, and one tube of toothpaste when he was a college student earning $100 a week. Now that he has graduated from college, and is earning $700 a week, he buys two hot dogs, three steaks, and one tube of toothpaste a month. During this time, prices have been stable, meaning no changes in prices. So, for Simon, hot dogs are an inferior good (he buys less as his income rises), steak is a normal good (he buys more as his income rises), and toothpaste is a neutral good (he buys the same amount as his income rises).
If you’re wondering if a good can be a normal good for one person and an inferior good for another person, the answer is yes. People, not economists, decide whether a good is normal or inferior for them. If Bob’s income goes up and he buys fewer potato chips, then potato chips are an inferior good
96 Chapter 4 Demand
for Bob. If Georgia’s income goes up and she buyers more potato chips, then potato chips are a normal good for Georgia.
Preferences
People’s preferences affect how much of a good they buy. A change in preferences in favor of a good shifts the demand curve to the right. A change in preferences away from a good shifts the demand curve to the left.
 People begin to favor (prefer) small, gas-efficient cars more than they did in the past. As a result, the demand curve for small, gas-efficient cars shifts rightward. At the same time, people may begin to favor several new brands of computers and stop buying Dell computers, which had been the most popular computer for several years. As a result, the demand curve for Dell computers shifts leftward.
Prices of Related Goods
Demand for goods is affected by the prices of related goods. The two types of related goods are substitutes and complements.
When two goods are substitutes, the demand for one good moves in the same direction as the price of the other good. In other words, if the price for a good, say peanuts, goes up, the demand for that good’s substitutes, say pretzels, will also go up. For many people coffee is a substitute for tea. Thus, if the price of coffee increases, the demand for tea increases as people substitute tea for the higher-priced coffee.
 Jessica is in the supermarket looking at the soft drinks. She usually buys a six-pack of Coke a week. She notices that the price of Coke has risen from what it was last week. So, instead of buying a sixpack of Coke, she buys a six-pack of Pepsi. For Jessica, Coke and Pepsi are substitutes, which means that as the price of Coke goes up, so does Jessica’s demand for Pepsi.
Two goods are complements if they are consumed together. For example, tennis rackets and tennis balls are used together to play tennis. With complementary goods, the demand for one moves in the opposite direction as the price of the other. As the price of
tennis rackets rises, for example, the demand for tennis balls falls. Other examples of complements (or complementary goods) include cars and tires, lightbulbs and lamps, and golf clubs and golf balls.
Number of Buyers
The demand for a good in a particular market area is related to the number of buyers in the area. The more buyers, the higher the demand; the fewer buyers, the lower the demand. The number of buyers may increase because of a higher birthrate, increased immigration, or the migration of people from one region of the country to another. Factors such as a higher death rate or the migration of people can also cause the number of buyers to decrease.
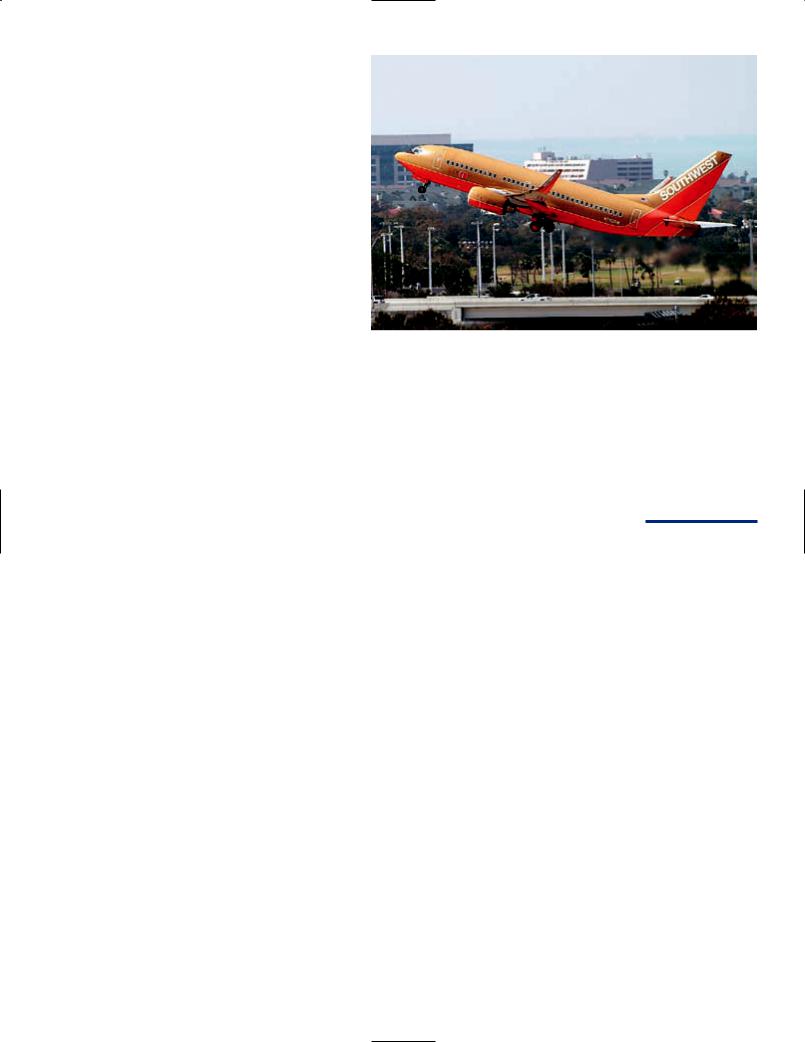
If Southwest Airlines expects the price of fuel to rise, and decides to buy fuel now instead of later, what will happen to the current demand for fuel?
Future Price
Buyers who expect the price of a good to be higher in the future may buy the good now, thus increasing the current demand for the good. Buyers who expect the price of a good to be lower in the future may wait until the future to buy the good, thus decreasing the current demand for the good.
Suppose Brandon is willing and able to buy a house (demand exists), but he thinks the price of houses on average will be lower next month. As a result, Brandon is likely to hold off on making a purchase, which has the effect of decreasing current demand.
substitute
A similar good. With substitutes, the price of one and the demand for the other move in the same direction.
complement
A good that is consumed jointly with another good. With complements, the price of one and the demand for the other move in opposite directions.
Section 2 The Demand Curve Shifts 97
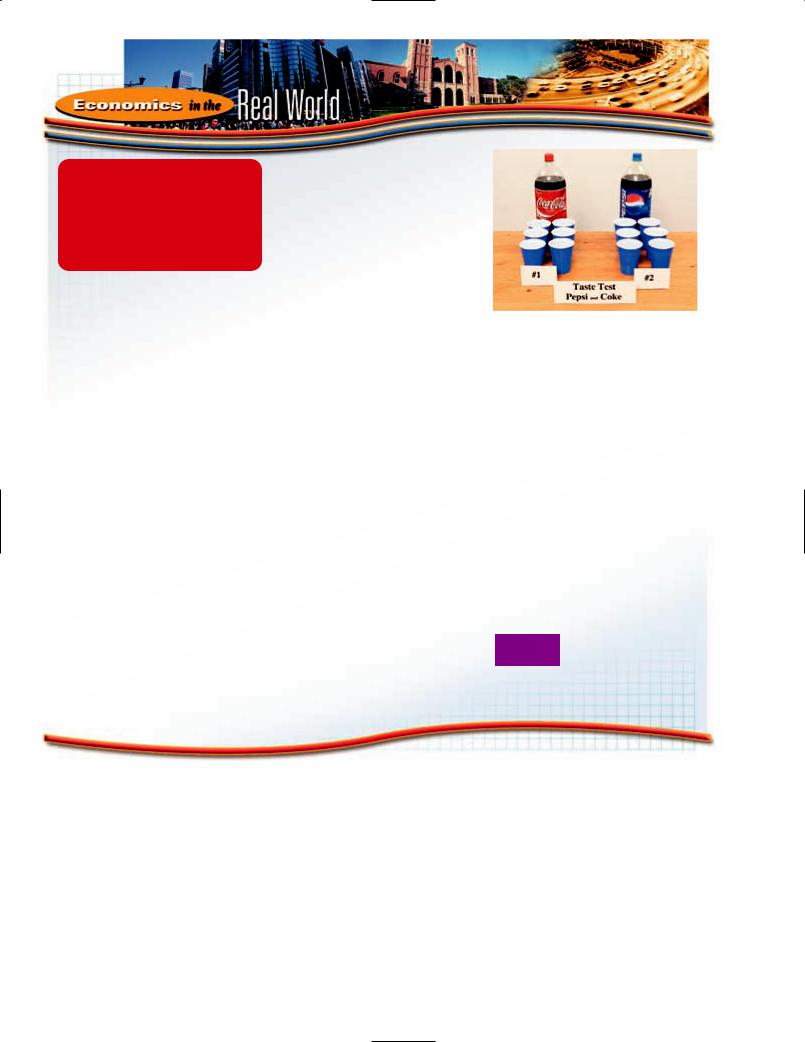
New Coke,
Classic Coke, or Pepsi?
??????????????????
In the early 1980s, the Pepsi company started asking people to take
the “taste test.” The taste test consisted of two small paper cups with a few teaspoons of Coke in one cup and a few teaspoons of Pepsi in the other. Members of the public didn’t know which cup contained Pepsi and which cup contained Coke. It is important to note here that Pepsi is a slightly sweeter cola than Coke.
Members of the public were asked to drink the contents of both cups and then state which cola they preferred. Pepsi won the “taste test” more often than Coke. This news scared Coca-Cola, which, at the time, was holding on to a small lead in sales over Pepsi. Coca-Cola decided to undertake its own taste test. During its taste test, it experimented with the taste of Coke. One option consisted of sweetening the taste of Coke to lure more teenagers to its brand.
In its own taste tests, Coca-Cola learned that its new, sweeter Coke
was beating Pepsi. In other words, Coca-Cola thought it had found the way to gain market share in the soft drink market. So, it undertook to replace its old, original Coke with what was called “New Coke.”
On April 23, 1985, Coca-Cola launched New Coke. It was a disaster. Coke consumers across the country turned their backs on New Coke. One person said replacing the old Coke with New Coke was like “spitting on the flag.” Another said, “At first I was numb. Then I was shocked. Then I started to yell and scream and run up and down.”
Coca-Cola experienced a backlash from consumers. What had gone wrong? The company hadn’t realized a fundamental problem with these taste tests. As it turns out, asking people to decide between a few teaspoons of different sodas is quite different from asking them to decide between entire bottles of soda. Often, when only a small amount of a cola is consumed, people choose the sweeter of the two colas. But when people have to drink larger amounts, they often find that the sweetness they liked in a teaspoon becomes “too sweet” before they finish the
hundreds of teaspoons contained in an entire bottle.
Coca-Cola obviously thought that its taste tests indicated a strong
demand for New Coke. That interpretation was wrong. What the taste tests actually showed was a strong demand for a few teaspoons of New Coke, not a demand for a six-pack of New Coke, especially when it meant taking old Coke off the market. CocaCola made a mistake in thinking that buyers had a demand for New Coke when they didn’t. On July 11, 1985, Coca-Cola brought old Coke back as Classic Coke. And over time it did away with New Coke.
What might Coca-Cola have done during its
taste test to reduce the chances of making such a costly mistake?
What Factor Causes a
Change in Quantity
Demanded?
We identified the factors (income, preferences, etc.) that can cause demand to change, but what factor can cause a change in quantity demanded ? Only one: price. For example, the only thing that can cause customers to change their quantity demanded of
orange juice is a change in the price of orange juice; the only thing that can cause a change in the quantity demanded of pencils is a change in the price of pencils.
As we stated earlier, a change in demand is represented as a shift in the demand curve. The curve moves either right or left. See Exhibit 4-4(a). So how do we represent a change in quantity demanded? When quantity demanded changes, the curve doesn’t
98 Chapter 4 Demand
E X HI B I T 4-4 A Change in Demand Versus a
Change in Quantity Demanded
|
|
B |
Price |
Price |
A |
|
|
|
|
D2 |
|
D1 |
|
D1 |
0 |
|
0 |
Quantity demanded |
|
Quantity demanded |
(a) |
|
(b) |
(a) A change in demand refers to a shift in the demand curve. A change in demand can be brought about by a change in a number of factors (income, preferences, prices of related goods, number of buyers, future price). (b) A change in quantity demanded refers to a movement along a given demand curve, which is brought about only by a change in the price of the good.
move right or left. Instead, the only movement is to a different point along a given demand curve, which stays in the same place on the graph. See Exhibit 4-4(b).
 Ian notices that the price of bananas has fallen; as a result, he goes from buying three bananas a week to buying five
that Ian’s quantity demanded of bananas has increased (from three to five) as a result of the price of bananas falling.
 The price of a book was $10 in July and Jeff bought three. The price was $10 in August and Jeff bought four. Economists would say that Jeff’s demand for
Defining Terms
1.Define:
a.normal good
b.inferior good
c.substitute
d.neutral good
e.complement
Reviewing Facts and Concepts
2. Explain what it means if demand increases.
3.Jerry, a comedian, started out doing stand-up comedy and went on to perform on a popular hit
television series. As he went from stand-up comedian to TV star, his income increased substantially. During this time, he bought more cars (specifically, Porsches) to add to his collection. For Jerry, what kind of good are Porsches?
Critical Thinking
4.Identify a good that is a substitute for one good and a complement for
another. (Hint: A CocaCola may be a substitute for a Pepsi and a complement for a hamburger.)
Applying Economic
Concepts
5.In recent years the price of a computer has fallen. What effect is this price change likely to have on the demand for software? Explain your answer.
6.Graph the following:
a.an increase in demand
b.a decrease in demand
Section 2 The Demand Curve Shifts 99

Too Good to Be True?
You just learned that buyers’ expectations about future
prices can affect current demand. If computer buyers think computer prices will be higher next year, they might buy their computers now (at the lower price) instead of next year (at the higher price) Buyers who think computer prices will be lower next year, might hold off buying this year, thinking they will get a lower price next year.
The Tulip Example
Similar thinking has been affecting prices and demand for hundreds of years. In the 1600s in Holland, for example, a tulip craze became so frenzied that some people sold their
businesses and family jewels just to buy a few tulip bulbs. Why would people behave in this way? The answer has to do with what these people thought the future price of tulips would be. They believed that if they bought tulips today at a relatively lower price, they could sell the tulips at a higher price in the future.
Don’t Forget Beanie Babies
Now think back to 1998. In that year, many people in the United States were buying Beanie Babies (a small stuffed animal). They believed that Beanie Babies would become
collectors’ items, and that the future price of Beanie Babies would be higher than the current price. They thought that if they bought Beanie Babies in 1998, they could turn around and sell those Beanie Babies at a higher price in 1999, or 2000, or in some later year.
Then Came the
Internet Bubble
One more example: Internet stocks in the late 1990s. Everyone seemed to be saying that the prices were going to be higher next week or next month and so you ought to buy the stocks as soon as possible. Even though many experts said the stocks were overpriced, people kept buying, thinking that the prices would continue to climb. Many people borrowed money to buy the stocks.
And What About Real
Estate Prices?
Well, Beanie Babies, tulips, and many Internet stocks all crashed in price. Beanie Babies that once sold for $100 were selling for $5; tulips that sold for hundreds of thousands of dollars ended up selling for (the equivalent of) a few pennies; and Internet stock prices in some cases went from $400 a share to a few cents a share.
Do you think real estate prices might be similar to these examples? During the period from 2001 to 2005 in many places around the country, all you heard was how home prices were destined—yes, destined—to just keep on rising. It was as if some law—let’s call it the law of antigravity—kept pulling prices up, much like the real law of gravity pulls things down. In southern California, especially coastal southern California, it was not uncommon to hear people say, “There is no way
Stock traders such as these participated in the buying surge of Internet stocks in the late 1990s.
100 Chapter 4 Demand
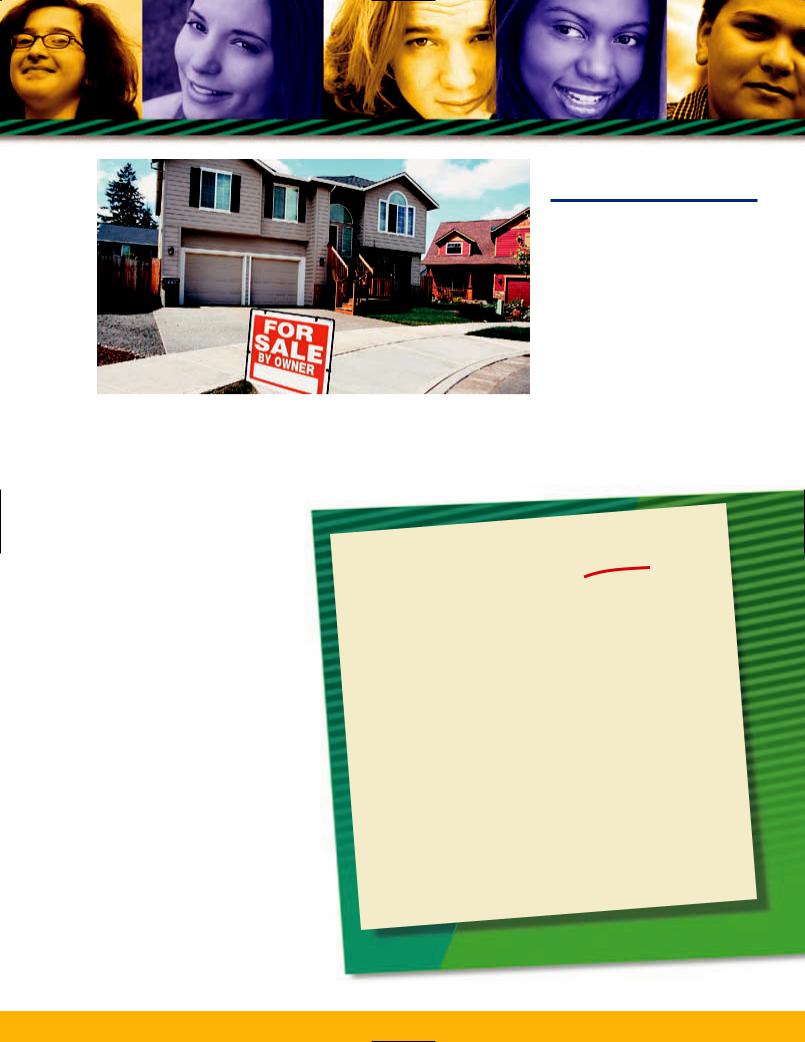
that houses near the coast are going to go down in price. After all, there’s only so much coast to go around.” At the time, many people were buying houses not to live in, but to speculate on. In other words, they bought a house in 2003 because they were “certain” they could sell the house in 2004 for a higher price.
Many of these people did just that. Of course, many of the people who bought Beanie Babies, tulips, and Internet stocks did the same thing: they bought low and sold high. Not everybody was so fortunate. In all three crazes—Beanie Babies, tulips, and Internet stocks—some people bought at high prices and ended up selling at low prices.
Will it be the same with houses? It very well could be. It’s happened before, and no economic law says it won’t happen again.
One Last Point
Consider George. George watches as the price of houses skyrockets. He also notices that house prices are rising much more rapidly than house rents. Based on the discrepancy between the rate of change in house rents and the rate
of change in house prices, he is quite sure that sometime in the future house prices will decline (perhaps very quickly).
Can economists predict when real estate prices will rise or fall?
What George doesn’t know is when house prices will start to decline. Will the price decline begin next week, next month, next year, or five years from now? It is much harder to predict the timing of an event than it is to predict the event. (The doctor can tell the pregant woman that she is going to have a baby, but be unsure of the day and time. The weather forecaster is fairly sure that it will rain in the next 24 hours, but he’s not sure if the rain will start at 7:08 a.m. or at 9:32 a.m.)
|
|
|
|
|
|
|
|
|
|
|
|
|
Economics |
Action |
Plan |
|
||||||||||||||||||||||||||
My Personal |
|
|
|
|
|
|
|
|||||||||||||||||||||||||||||||||||
|
|
|
|
|
|
|
|
and some |
|
|||||||||||||||||||||||||||||||||
|
|
|
|
you may want |
to consider |
|
||||||||||||||||||||||||||||||||||||
|
|
|
|
|
|
|
|
|
|
|
|
|
|
|
|
|
|
|||||||||||||||||||||||||
|
|
|
|
are some |
points |
|
|
|
|
|
|
|
|
|||||||||||||||||||||||||||||
Here |
|
|
|
|
|
|
|
|
|
|
|
|
|
|
|
|
|
|||||||||||||||||||||||||
|
|
to put into |
practice: |
|
|
|
|
|
|
|
|
|
|
|
|
|||||||||||||||||||||||||||
|
|
|
want |
|
|
|
|
|
|
|
|
|
|
|
|
|||||||||||||||||||||||||||
|
you might |
|
|
|
|
|
|
|
|
|
|
|
|
|||||||||||||||||||||||||||||
guidelines |
|
|
|
|
|
|
|
|
|
|
|
to go but |
|
|||||||||||||||||||||||||||||
|
|
|
|
|
|
|
has nowhere |
|
||||||||||||||||||||||||||||||||||
|
|
|
|
|
|
|
|
“price |
|
|||||||||||||||||||||||||||||||||
|
|
someone says |
that |
|
||||||||||||||||||||||||||||||||||||||
|
|
|
When |
to the |
|
|
||||||||||||||||||||||||||||||||||||
|
|
|
|
|
happened |
|
|
|||||||||||||||||||||||||||||||||||
|
|
|
|
|
|
what |
|
|
||||||||||||||||||||||||||||||||||
1. |
|
|
|
might |
|
want to recall |
|
|
|
|
|
|
|
|
. Many |
|||||||||||||||||||||||||||
|
|
|
|
|
|
|
|
|
|
|
|
|
|
|
|
|||||||||||||||||||||||||||
|
|
|
up,” you |
|
|
Babies, tulips, |
and Internet |
stocks |
. |
|
|
|||||||||||||||||||||||||||||||
|
|
|
|
|
|
|
of Beanie |
|
|
|
|
|
|
|
|
|
|
|
|
|
|
|
|
|
||||||||||||||||||
|
|
|
price |
|
|
|
too good |
to be true are |
just that |
|
|
|||||||||||||||||||||||||||||||
|
|
|
|
that sound |
|
|
|
|
|
|
|
|
|
|||||||||||||||||||||||||||||
|
|
|
|
things |
|
|
|
|
|
|
|
|
|
|
I will talk |
to some |
||||||||||||||||||||||||||
|
|
|
|
|
financial decision, |
|
||||||||||||||||||||||||||||||||||||
|
|
|
|
|
|
|
|
|
|
|
|
|
|
|
|
|
||||||||||||||||||||||||||
|
|
|
|
|
|
|
|
|
|
|
|
a major |
|
|
|
|
- |
|||||||||||||||||||||||||
|
|
|
|
|
|
|
|
|
|
|
|
|
|
|
|
|
|
|
|
|
|
|
||||||||||||||||||||
|
Before |
making |
|
|
|
to make sure |
that |
my deci |
||||||||||||||||||||||||||||||||||
|
|
|
|
|
|
|
|
research |
|
|
|
|
|
|
||||||||||||||||||||||||||||
|
|
and do some |
|
|
|
|
|
|
|
|
|
|||||||||||||||||||||||||||||||
|
experts |
|
|
.” |
|
|
|
|
|
|
|
|
|
|
|
|
|
|
|
|
|
|||||||||||||||||||||
|
|
|
|
|
|
|
|
|
|
|
|
|
|
|
|
|
|
|
|
|
|
|
|
|||||||||||||||||||
|
|
|
|
|
|
|
|
|
|
|
|
|
|
|
|
|
|
|
|
|
|
|
|
|
|
|
|
|
|
|
|
|
|
|
|
|||||||
|
sion is based |
on facts, |
not “hype |
|
|
|
|
|
|
|
|
|
|
|
|
|
|
|
|
|
||||||||||||||||||||||
|
|
|
|
|
|
|
|
|
|
|
|
|
|
|
|
|
|
|
|
|
you can |
|||||||||||||||||||||
|
|
|
|
|
|
|
|
|
|
|
|
|
|
|
|
|
that just because |
|||||||||||||||||||||||||
|
|
|
|
|
|
|
|
|
|
|
|
|
|
|
to the conclusion |
|||||||||||||||||||||||||||
|
|
|
|
|
Don’t jump |
|
when |
|||||||||||||||||||||||||||||||||||
|
|
2. |
|
|
|
you |
can predict |
|||||||||||||||||||||||||||||||||||
|
|
|
|
|
|
|
|
|
|
|
occur, |
|
|
|||||||||||||||||||||||||||||
|
|
|
predict |
that an event |
will |
|
|
|
|
|
|
|
|
not even |
||||||||||||||||||||||||||||
|
|
|
|
|
|
|
|
|
|
|
|
|
|
|
|
|
|
|
||||||||||||||||||||||||
|
|
|
|
|
|
|
|
|
|
|
|
|
|
. Remember that no one, |
|
|
|
|
with |
|||||||||||||||||||||||
|
|
|
|
|
the event will |
occur |
|
|
|
|
|
|
|
|
|
|
field, can know |
|||||||||||||||||||||||||
|
|
|
|
|
|
the leading |
experts in a particular |
|
|
|
|
|
|
|
|
. |
|
|
|
|||||||||||||||||||||||
|
|
|
|
|
|
|
|
|
|
an economic |
event |
|
will occur |
|
|
|
||||||||||||||||||||||||||
|
|
|
|
|
|
certainty |
when |
|
|
|
|
|
|
|
|
|
|
|
||||||||||||||||||||||||
|
|
|
|
|
|
|
|
|
|
|
|
|
|
|
|
|
|
|
|
|
||||||||||||||||||||||
|
|
|
|
|
|
|
|
|
|
|
|
|
|
|
|
|
|
|
|
|
|
|
|
|
|
|
|
|
||||||||||||||
|
|
|
|
|
|
|
|
|
|
|
|
|
|
|
|
|
|
|
|
|
|
|
|
|
|
|
|
|
|
|
|
|
|
|
||||||||
Chapter 4 Demand 101

Elasticity of
Demand
Focus Questions
What is elasticity of demand?
How do we compute elasticity of demand?
What does it mean to say that the demand for a good is elastic? Inelastic? Unit elastic?
What factors can change the elasticity of demand?
Does an increase in price for a good necessarily bring about a higher total revenue?
Key Terms
elasticity of demand elastic demand inelastic demand unit-elastic demand
elasticity of demand
The relationship between the percentage change in quantity demanded and the percentage change in price.
elastic demand
The type of demand that exists when the percentage change in quantity demanded is greater than the percentage change in price.
What Is Elasticity of
Demand?
Suppose Jimmy loves chewing gum, so much so that he buys as many as four or five packs a week. One day he notices that the price of his favorite gum has gone up a quarter. Jimmy will probably now buy less chewing gum. But how much less?
This question about Jimmy’s gum buying is the kind of question that you will learn how to answer as you study our next economic concept, elasticity of demand. Elasticity of demand deals with the relationship between price and quantity demanded. It is a way of measuring the impact that a price change has on the number of units of a good people buy. In some cases a small price change causes a major change in the number of units of a good people buy. In other cases, a small price change causes little change in how many units of a good people buy.
Elastic Demand
Economists have created a way to measure these relationships between price and
quantity demanded. They compare the percentage change in quantity demanded of a good to the percentage change in the price of that good. In mathematical terms, here is what elasticity of demand looks like:
|
Percentage change in |
Elasticity of |
quantity demanded |
|
|
demand |
Percentage change in price |
In the equation, the numerator is percentage change in quantity demanded, and the denominator is percentage change in price.
Elastic demand exists when the quantity demanded (the numerator) changes by a greater percentage than price (the denominator). For example, suppose the quantity demanded of lightbulbs falls by 15 percent as the price of lightbulbs increases by 10 percent. An economist would say that because the numerator (15%) is greater than the denominator (10%), the demand for lightbulbs is elastic. Another way that an economist might say it is that elasticity of demand is greater than 1, because if you divide 15 percent by 10 percent, you get 1.5, which is greater than 1.
102 Chapter 4 Demand

Inelastic Demand
Inelastic demand exists when the quantity demanded changes by a smaller percentage than price—that is, when the numerator changes by less than the denominator. Suppose the quantity demanded of salt falls by 5 percent as the price of salt rises by 10 percent. In this case the numerator (5%) is less than the denominator (10%), so the demand for salt is inelastic. An economist could say that elasticity of demand is less than 1 (if you divide 5% by 10% you get 0.5, which is less than 1).
Unit-Elastic Demand
Finally, unit-elastic demand exists when the quantity demanded changes by the same percentage as price—that is, when the numerator changes by the same percentage as the denominator. For example, suppose the quantity demanded of picture frames decreases by 10 percent as the price of picture frames rises by 10 percent. The numerator (10%) is equal to the denominator (10%), so the demand for picture frames is unit elastic. According to an economist, elasticity of demand would be equal to 1 (10% divided by 10% equals 1).
When elasticity of demand is greater than 1, we say that demand is elastic. When it is less than 1, we say that demand is inelastic. And finally, when it is equal to 1, we say that demand is unit-elastic. See Exhibit 4-5.
Elastic or Inelastic?
So, you’re probably wondering what products are elastic and which ones are inelastic? One economics study identified oysters, restaurant meals, and automobiles as goods with elastic demand. For these goods, price changes have a strong impact on how much customers will buy. In the same study, coffee, gasoline (for your car), physicians’ services, and legal services were identified as goods with inelastic demand. For these products a change in price had less impact on how much customers will buy.
 A university raises its tuition by 10 percent. As a result, the number of students applying to the university
|
|
E X H I B I T 4-5 |
Elasticity of Demand |
|
|
|
|
|
|
||
|
|
If demand is . |
. . That means . . . |
|
|
|
|
|
|
|
|
|
|
Elastic |
Quantity demanded changes by a larger percentage |
|
|
|
|
|
than price. For example, if price rises by 10 percent, |
|
|
|
|
|
quantity demanded falls by, say, 15 percent. |
|
|
|
|
|
|
|
|
|
|
Inelastic |
Quantity demanded changes by a smaller percentage |
|
|
|
|
|
than price. For example, if price rises by 10 percent, |
|
|
|
|
|
quantity demanded falls by, say, 5 percent. |
|
|
|
|
|
|
|
|
|
|
Unit-elastic |
Quantity demanded changes by the same percentage |
|
|
|
|
|
as price. For example, if price rises by 10 percent, |
|
|
|
|
|
quantity demanded falls by 10 percent. |
|
|
|
|
|
|
|
|
falls by 2 percent. In this situation, we would say that the demand for education at this particular university is inelastic. Why? Because the percentage change in quantity demanded (2%) is less than the percentage change in price (10%).
What Determines Elasticity
of Demand?
The demand for some goods (coffee, gasoline at the local gas station, physicians’ services) is inelastic, while the demand for other goods (oysters, restaurant meals, and cars) is elastic. Why is the demand for some goods inelastic, while the demand for other goods is elastic? Four factors affect the elasticity of demand: (1) the number of substitutes available, (2) whether something is a luxury or a necessity, (3) the percentage of income spent on the good, and (4) time.
Number of Substitutes
Let’s look at two goods: heart medicine and soft drinks. Heart medicine has relatively few substitutes; many people must have it to stay well. Even if the price of heart medicine went up by 50, 100, or 150 percent, the quantity that people demanded probably would not fall by much. Is the demand for heart medicine more likely to be elastic or inelastic? The answer is inelastic. Do you see the reasoning here? The fewer substitutes for a good, the less likely the quantity demanded will change much if the price rises.
inelastic demand
The type of demand that exists when the percentage change in quantity demanded is less than the percentage change in price.
unit-elastic demand
The type of demand that exists when the percentage change in quantity demanded is the same as the percentage change in price.
Section 3 Elasticity of Demand 103