

Economics_-_New_Ways_of_Thinking
.pdfWhyAllthe |
|
??? |
|
Reality |
TV |
Shows? |
|
In 1992, MTV launched a program called The Real World.
Seven young people from across the country came together in an apartment in New York City. In 2000, CBS launched a show called Survivor. The show placed people on an island and then watched as they tried to “outwit, outplay, and outlast” each other for a prize of $1 million.
Both The Real World and
Survivor were reality TV shows. After Survivor, it wasn’t long before television became deluged with reality shows. In other words, the supply of reality shows increased. We will learn in this chapter that one of the factors that can increase supply is the number of sellers. In other words, the greater the number of sellers of a good, the larger the supply of that good. The number of sellers does not increase for no reason; something acts as a catalyst, pushing upward the number of sellers. That thing is profit, which is closely tied to
success. The immense popularity of CBS’s Survivor—as evidenced in its high television ratings—meant that CBS could sell commercial time on the show for huge sums of money, in the process earning high profits.
“Of all seven shows that could be labeled phenomenal hits in the last four years, all but one . . . have been reality shows.”
—Bill Arter, New York Times,
May 19, 2003
Soon not only was CBS airing more reality shows, but NBC and ABC quickly came out with reality shows of their own. After all, everyone wanted to earn big profits. Over time, other reality shows hit the air waves: For Love of Money, Fear Factor, Meet My Folks, The Restaurant, Average Joe, Paradise Hotel, The Amazing Race, Big Brother, The Apprentice, The Bachelor, The Bachelorette, Tommy Lee Goes to College, and many more. In 2004, four years after the first Survivor, some reality shows were earning big profits for their networks. For example, a 30-second spot on Survivor was selling for $327,000 and earning CBS an annual profit of $73 million. A
30-second spot on American Idol, considered a reality show, was being sold for $414,700 and was earning its company, Fox, $260 million in profit (for the year).
When people wonder where all the reality TV shows are coming from, they are really asking, “What caused the increase in the supply of reality shows?” The answer is that supply increases as the number of sellers (of a good or service) increases. So, what increases the number of sellers of a good or service? The answer is the chance to earn big profits. In short, money.
One lesson to be learned from the his-
tory of reality shows appearing on television is that success is copied. Survivor was successful and so it was copied. What other successful products can you think of that have been copied?
supply schedule
A numerical chart illustrating the law of supply.
supply curve
A graph that shows the amount of a good sellers are willing and able to sell at various prices.
40. A numerical chart like this one that illustrates the law of supply is called a supply schedule.
We can also show the law of supply in picture form by plotting the data in the supply schedule, as in Exhibit 5-1(b). Point A is the first combination of price and quantity sup-
plied from the supply schedule, with a price of $1 and a quantity supplied of 10. Point B represents a price of $2 and a quantity supplied of 20; Point C, a price of $3 and a quantity supplied of 30; and Point D, a price of $4 and a quantity supplied of 40. Connecting points A through D creates a
114 Chapter 5 Supply
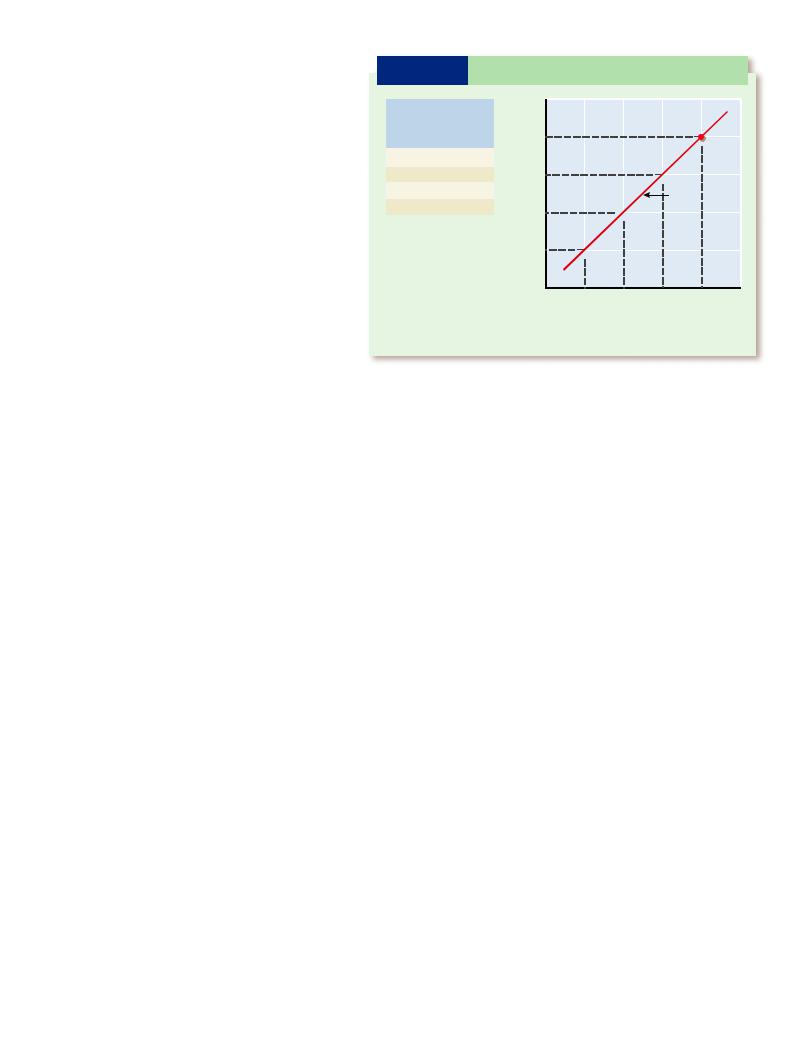
supply curve, a line that slopes upward (from left to right) and shows the amount of a good sellers are willing and able to sell at various prices. The upward-sloping supply curve in Exhibit 5-1(b) is the graphic representation of the law of supply.
A Vertical Supply Curve
The law of supply, which holds that as price rises, quantity supplied rises, does not hold true for all goods; nor does it hold true over all time periods. First, it does not hold for goods that cannot be produced any longer, such as Stradivarius violins. These violins were made by Antonio Stradivari more than 250 years ago. It is impossible for an additional Stradivarius violin to be produced today, because Stradivari died in 1737. No matter how high the price goes, the quantity supplied cannot increase to more than the total number of Stradivarius violins that currently exist. Thus, the supply curve of Stradivarius violins is not upward sloping but vertical, straight up and down, as shown in Exhibit 5-2(a).
In another example, a theater in St. Louis is sold out for tonight’s play. Increasing ticket prices from $40 to $50 would not create additional seats tonight, because time does not allow enlarging the theater to add more seats. For tonight’s performance, the supply curve of theater seats is vertical, as illustrated in Exhibit 5-2(b).
E X H I B I T 5-1 Supply Schedule and Supply Curve
Price |
Quantity |
|
|
|
|
|
|
supplied |
|
$4 |
|
|
|
D |
|
(dollars) |
(units) |
|
|
|
|
||
|
|
|
|
|
|||
$1 |
10 |
(dollars) |
|
|
|
C |
|
2 |
20 |
$3 |
|
|
|
||
|
|
|
|
||||
3 |
30 |
|
|
|
|
Supply |
|
4 |
40 |
Price |
$2 |
|
B |
|
curve |
|
|
|
|||||
|
|
|
|
|
|
||
(a) |
|
|
|
|
|
|
|
|
|
|
|
|
|
|
|
|
|
|
$1 |
A |
|
|
|
|
|
|
|
|
|
|
|
|
|
|
0 |
10 |
20 |
30 |
40 |
Quantity supplied (units)
(b)
A Firm’s Supply Curve and a
Market Supply Curve
Most of the goods supplied in the United States are supplied by business firms. For example, computers are supplied by Dell, Hewlett-Packard, and so on. A firm’s supply curve is different from a market supply curve. A firm’s supply curve is what it sounds like: it is the supply curve for a particular firm. A market supply curve is the sum of all firms’ supply curves.
(a) A supply schedule for a good. Notice that as price increases, quantity supplied increases.
(b) Plotting the four combinations of price and quantity supplied from part (a), and connecting the points, yields a supply curve.
E X H I B I T 5-2 Supply Curves When No More Can Ever Be Produced or There Is No Time to Produce More
Supply curve |
Supply curve |
of Stradivarius |
of theater |
violins |
seats for |
|
tonight s |
|
performance |
When additional units cannot be produced or there is no time to produce more, the supply curve is vertical.
Section 1 Understanding Supply 115

E X H I B I T 5-3 From Firms Supply Curves to Market Supply Curve
fans |
|
|
SFirm A |
|
|
SFirm B |
|
SFirm C |
|
Market |
|
|
|
|
|
|
|
|
|
||
$5 |
0 |
Firm A s |
$50 |
|
Firm B s |
$50 |
|
$50 |
supply cu rve |
|
|
|
|
||||||||
of |
|
|
|
|||||||
|
|
supply |
+ |
|
supply |
+ |
|
|
|
|
Price |
|
|
|
Firm C s |
|
|
||||
|
|
curve |
|
curve |
|
|
||||
|
|
|
|
|
supply |
|
SAll |
|||
|
|
|
|
|
|
|
|
|||
|
|
|
|
|
|
|
|
curve |
|
suppliers |
|
|
0 |
00 |
0 |
50 |
|
0 |
200 |
0 |
450 |
Quantity supplied of fans
(a) |
( b) |
(c) |
(d) |
In parts (a) through (c) we show the supply curve for firms A, B, and C, respectively. The market supply curve, shown in part (d), is simply the sum of the firms’ supply curves. Stated differently, we know that at a price of $50 per fan, firm A’s quantity supplied of fans is 100, firm B’s is 150, and firm C’s is 200. It follows that all three firms together will offer 450 fans at a price of $50 per fan. This point is identified on the market supply curve in part (d).
Suppose that only three suppliers of fans exist in the whole world: firm A, firm B, and firm C. At a price of $50 a fan, quantity supplied is 100 for firm A, 150 for firm B, and 200 for firm C. As a result, the market supply curve would have a point representing a price of $50 per fan
To see this concept graphically, look at Exhibit 5-3 above. In parts (a) through (c) you see the supply curves for firms A, B, and C, respectively. (To keep things simple, we identify only one point on the supply curve for each firm.) Now look at part (d). Here you can see the market supply curve, which is the combination of all the individual market supply curves.
Defining Terms
1.Define:
a.supply
b.law of supply
c.direct relationship
d.quantity supplied
e.supply curve
f.supply schedule
2.Use the term quantity supplied correctly in a sentence. Use the word supply correctly in a sentence.
Reviewing Facts and
Concepts
3.a. State the law of supply. b. Explain the direct
relationship between the price of a good
and the quantity supplied.
4.Do all supply curves graphically represent the law of supply? Explain your answer.
5.Identify a good that has an upward-sloping supply curve. Identify a good that has a vertical supply curve.
Critical Thinking
6.Three months ago the price of a good was $4, and the quantity supplied was 200 units.
Today the price is $6, and the quantity supplied is 400 units. Did the quan-
tity supplied rise because the price increased, or did the price rise because the quantity supplied increased?
Applying Economic
Concepts
7.Suppose three McDonald’s restaurants operate in your town, and each pays its employees $6 per hour. If McDonald’s started paying $9 per hour to its employees, would more, fewer, or the same number of people want to work for McDonald’s, according to the law of supply?
116 Chapter 5 Supply
The Supply
Curve Shifts
Focus Questions
What does it mean when a supply curve shifts to the right?
What does it mean when a supply curve shifts to the left?
What factors can change supply?
What factor can change quantity supplied?
Key Terms
technology |
quota |
advancement in |
elasticity of supply |
technology |
elastic supply |
per-unit cost |
inelastic supply |
subsidy |
|
|
|
When Supply Changes,
the Curve Shifts
Supply can go up, and it can go down. For example, the supply of computers can rise or fall. Every time the supply of a good changes, the supply curve for that good “shifts.” By shift we mean that it moves; it moves either to the right or to the left.
Change in supply →Shift in supply curve
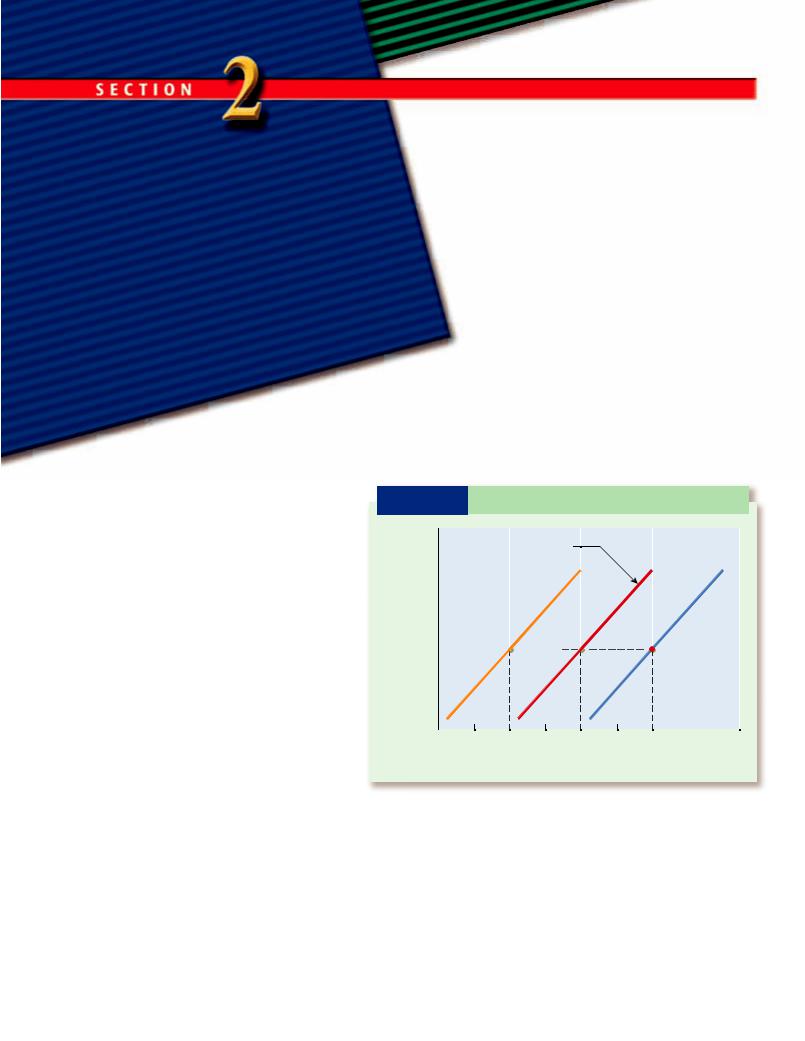
For example, if the supply of computers increases, the computer supply curve shifts to the right. If the supply of computers decreases, the supply curve shifts to the left. We can understand shifts in supply curves better with the help of Exhibit 5-4.
Look at the curve labeled S1 in Exhibit 5-4. Suppose this supply curve represents the original (and current) supply of computers. Notice that the quantity supplied at a price of $1,000 is 4,000 computers. Now suppose the supply of computers increases. For whatever reason, people want more computers. This increase in supply is shown by
E X H I B I T 5-4 Shifts in a Supply Curve
Original supply curve
S 3 |
S |
S2 |
(dollars) |
C |
A |
B |
Price |
$1,000 |
|
|
|
|
|
0 1,000 2,000 3,000 4,000 5,000 6,000
Quantity supplied of computers
Moving from S1 (the original supply curve) to S2 represents a rightward shift in the supply curve. Supply has increased. Moving from S1 to S3 represents a leftward shift in the supply curve. Supply has decreased.
the supply curve S1 shifting to the right and becoming S2.
What does it mean for a supply curve to shift rightward? The answer is easy if you
Section 2 The Supply Curve Shifts 117

Where Do TiVo,
Podcasts, and
Blogs Come From?
??????????????????
It is important to distinguish between increasing the supply
of a good that has existed for some time (increasing the supply of corn, paper, or shoes) and creating the supply of a good that has never existed before. Many goods that we have today—digital video recorders (first introduced by TiVo), podcasts, and blogs, for example—weren’t available to us in the past. Where did these goods and the ideas for them come from?
Two answers come to mind: new technology and entrepreneurship. To illustrate how these two factors sometimes work together, consider a blog. A blog, or weblog, is a personal Web site with a dated log (diary-like) format that contains commentary and links to other Web sites. Only about 30 blogs existed at the beginning of 1999. Today, you can find millions. The first blogs were hand-coded by Web developers who taught themselves HTML (a markup language designed to create
Web pages). Then, programmers created new software programs (a technological development), and entrepreneurs responded to the unfulfilled demand for posting items on the Web, leading to the vast supply of blogs today. Now anyone can go to Blogger at www.blogger.com/start and create a blog within minutes.
No digital video recorder (sometimes called a personal video recorder) could exist before the software had been developed to provide programming information and encode data streams. The DVR is a new product brought to us through an advancement in technology, and by the entrepreneurs who saw that the television public wanted more control over their personal television viewing.
Podcasting, which delivers recorded audio programs through the Internet to iPods or other portable music players, would not exist without the software that makes it easy to beam a podcast from a home computer to someone who has signed up to receive it. It would also not exist without the entrepreneurs who saw an unfulfilled demand on the part of consumers for more choices and greater control over their entertainment.
New technology and entrepre- neurship—the combination that today gives us many of our new products—are the catalysts behind the supply of new products.
Do you think the technology exists today to
develop new products that aren’t being developed because entrepreneurs think no one would buy them? What might these new products (that could be developed but aren’t being developed) do? Will they brush your teeth for you? Will they make your bed for you? If you were an entrepreneur, what new products would you supply?
again look at Exhibit 5-4 and focus on the horizontal axis and the numbers on it, along the bottom of the graph. What is the quantity supplied on curve S2 at the price of $1,000? The answer is 6,000 computers. In other words, an increase in supply (or a shift rightward in the supply curve) is the same thing as saying, “Sellers want to sell more of a good at each and every price.” In our
example, sellers want to sell more computers at $1,000.
How would we graphically represent a decrease in supply? In Exhibit 5-4, again let’s suppose that S1 is our original (and current) supply curve. A decrease in supply is represented as a shift leftward in the supply curve from S1 to S3. This decrease in supply means that sellers want to sell less of the good at
118 Chapter 5 Supply

each and every price. Specifically, if we look at the price $1,000, we see that sellers who once wanted to sell 4,000 computers now want to sell 2,000 computers.
Supply increases → Supply curve shifts rightward Supply decreases → Supply curve shifts leftward
What Factors Cause Supply Curves to Shift?
Supply curves do not shift to the right or left without cause. They shift because of changes in several factors. These factors include a change in resource prices, technology, taxes, subsidies, quotas, number of sellers, future price, and weather.
Resource Prices
Chapter 1 identified four resources, or factors of production: land, labor, capital, and entrepreneurship. For now, concentrate on land, labor, and capital. These resources are used to produce goods and services.
When resource prices fall, sellers are willing and able to produce and offer to sell more of the good (the supply curve shifts to the right). The reason is that it is cheaper to produce the good. When resource prices rise, in contrast, sellers are willing and able to produce and offer to sell less of the good (the supply curve shifts to the left); it is more expensive to produce the good.
 Suppose the cost of labor rises for employees working for a car manufacturer, while everything else remains the same. Wage rates rise from, say, $20 an hour to $22 an hour. As a result, the car manufacturer will produce and offer to sell fewer cars; the supply curve shifts leftward.
Technology
Technology is the skills and knowledge used in production. For example, the technology of farming today is much different from 200 years ago. Today, unlike 200 years ago, tractors, pesticides, and special fertilizers are used in farming.
An advancement in technology is the ability to produce more output with a fixed
In 1921, a seller sold something to a buyer for $100. In 2005, a seller sold something to a buyer for $100. Were the two sales, in 1921 and 2005, equivalent? Not at all, because a dollar was worth more in 1921 than in 2005. In fact, a $100 purchase in 1921 was the equivalent of a $1,079.89 purchase in 2005. In other words, buying something for $100 in 1921 was the same as buying something for $1,079.89 in 2005. To find out what any dollar purchase in the past is equivalent to today, go to the Bureau of Labor Statistics inflation calculator at www.emcp.net/inflation. Here we list the 2005 dollar equivalent of several purchases made in 1961. For example, a person who paid $15 for dinner when going out to eat in 1961 would pay
$96.22 for an equivalent dinner in 2005.
Good/service |
1961 price |
2005 equivalent |
Dinner |
$ 15 |
$ 96.22 |
Book |
4 |
25.66 |
|
|
|
Haircut |
3 |
19.24 |
Car |
3,000 |
19,244.15 |
|
|
|
Furniture |
500 |
3,207.36 |
Hammer |
2 |
12.83 |
|
|
|
Attorney services |
200 |
1,282.94 |
|
|
|
amount of resources. Again, consider farming. With the use of fertilizers and pesticides, farmers today can produce much more output on an acre of
land than they could many years ago. This advancement in technology, in turn, lowers the per-unit cost, or
average cost, of production for farmers. Farmers respond to lower per-unit costs by being willing and able to produce and offer to sell more output. In other words, the supply curve shifts to the right.
Taxes
Some taxes increase the per-unit costs. Suppose a shoe manufacturer must pay a $2 tax for each pair of shoes it produces. This “extra cost” of doing business causes the manufacturer to supply less output. (It is similar to the price of a resource rising and thus making it more expensive and less profitable for the producer to manufacture the good. As a result, the producer produces less output.) The supply curve shifts to the left. If the tax is eliminated, the supply curve will shift rightward to its original position.
technology
The body of skills and knowledge concerning the use of resources in production.
advancement in technology
The ability to produce more output with a fixed amount of resources.
per-unit cost
The average cost of a good. For example, if $400,000 is spent to produce 100 cars, the average, or per-unit, cost is $4,000.
Section 2 The Supply Curve Shifts 119

Subsidies
Subsidies have the opposite effect of taxes. A subsidy is a financial payment made by government for certain actions. Suppose the government subsidizes the production of corn by paying corn farmers $2 for every bushel of corn they produce. Farmers will then want to produce more corn at every price, which means the supply curve of corn shifts rightward. Removal of the subsidy causes the supply curve to shift to the left, back to its position prior to the subsidy.
A quota decreases supply, so the supply curve shifts to the left. The elimination of a quota causes the supply curve to shift rightward to its original position.
Number of Sellers
If more sellers begin producing a particular good, perhaps because of high profits, supply increases and the supply curve shifts to the right. If some sellers stop producing a particular good, perhaps because of losses, the supply curve shifts to the left.
Quotas
subsidy
A financial payment made by government for certain actions.
quota
A legal limit on the number of units of a foreignproduced good (import) that can enter a country.
Quotas are restrictions on the number of units of a foreign-produced good (import) that can enter a country. For example, suppose Japanese producers are currently sending, and want to continue to send, 100,000 cars to the United States each year. Now suppose the U.S. government imposes a quota on Japanese cars at 80,000 a year. This quota means that no more than 80,000 Japanese cars can be imported into the United States.
Suppose you are an oil producer and you want to know the price of oil today and the
expected (future) price of oil. Where would you look to find the current and future price of oil? To find the current price, you might go to www.emcp.net/ oil. Here you will see the current (or sometimes called spot) price for oil, such as Nymex Crude. On the day we checked, the price was $51.25 a barrel. If you want to check the future price of oil, go to www.emcp.net/oil_futures or simply click on “Commodity Futures” in the left margin of your first screen (the screen that shows the current price of crude oil). On the day we checked, the (expected) future price of crude oil was $51.35. Notice that the difference between the current price ($51.25) and the future price ($51.35) is only 10 cents, which means that oil producers don’t have much incentive (if any at all) to shift oil from current supply to future supply.
Future Price
Sellers who expect the price of a good to be higher in the future may hold back the good now and supply the good to the market in the future. Sellers who expect the price of a good to be lower in the future may want to supply the good now instead of later.
 Ricky is thinking of selling his house. He just heard that the price of houses is expected to rise three months from today. Instead of offering to sell his house today, he waits until three months later. Why did he wait? Ricky believed the future price of a house would be higher than the current price of a house. Notice that we are talking about a nonperishable good here (houses). In other words, waiting a few months, or even a year, to sell a house doesn’t lead to a change in the quality of a house.
A different type of a good is a perishable good, such as eggs. If the egg seller believes that the future price will be higher than the current price of eggs, he may want to hold his eggs off the market today and sell them later. He can’t really do that, though, because eggs spoil if kept too long.
Weather (in Some Cases)
Weather can affect the supply of a good. Bad weather reduces the supply of many agricultural goods, such as corn, wheat, and barley. Unusually good weather can increase the supply. Weather can also impact the supply of non-agricultural products, as happens when hurricanes damage fishing boats, shipping docks, and coastal oil refineries.
120 Chapter 5 Supply
What Factor Causes a
Change in Quantity
Supplied?
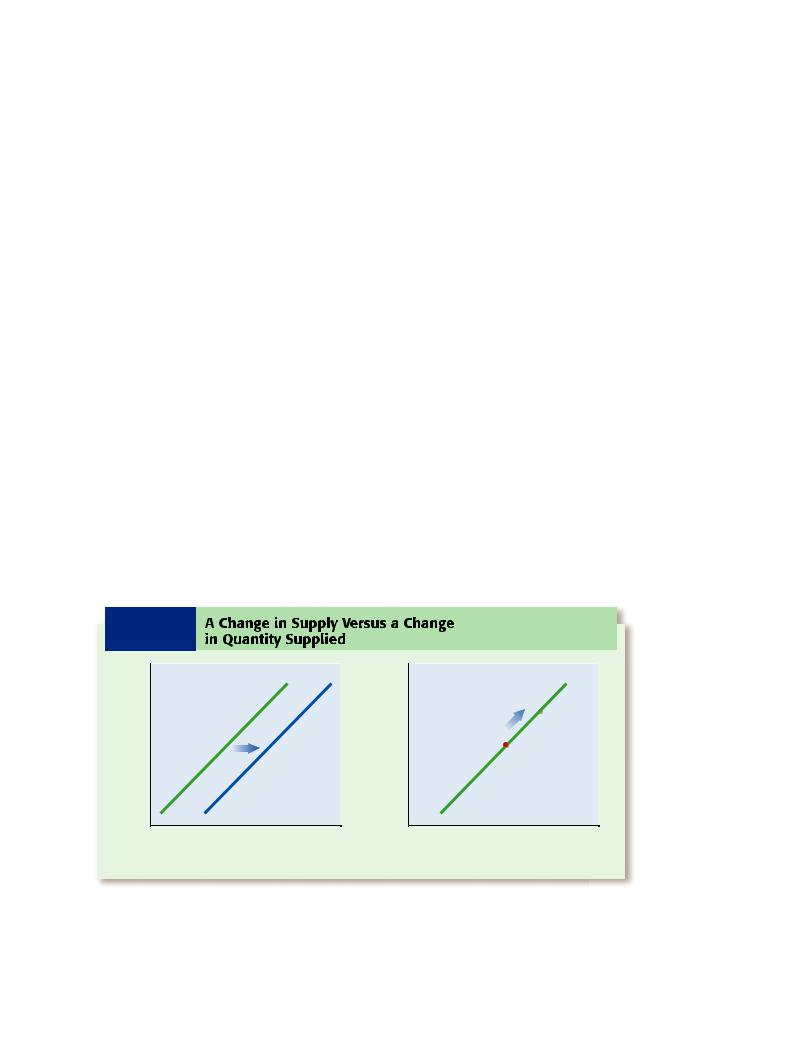
We identified the factors (resource prices, technology, etc.) that can cause supply to change. As we stated earlier, a change in supply is represented as a shift in the supply curve. The curve moves either right or left. See Exhibit 5-5(a).
But what factor(s) can cause a change in quantity supplied? Only one: price. For example, the only thing that can cause sellers to change their quantity supplied of computers is a change in the price of computers. A change in quantity supplied is shown as a movement along a given supply curve. See Exhibit 5-5(b).
Many people are, at first, confused about what leads to a change in quantity supplied and what leads to a change in supply. To many, it seems as if changes in quantity supplied and supply are the same thing.
To make sure you understand the difference, let’s look back at a couple of examples in this chapter. Turn back to Exhibit 5-1 on page 115 and look at point A. There you see a price of $1 and a quantity supplied of 10. Now ask yourself what must happen before you can move from quantity supplied of 10
Supply Goes Up, or Down?
On March 21, 2005, Dell Computers opened its third Call Center in India. (A Call Center is a
place where people who have purchased Dell computers call if they have
technical problems with their computers.) At the time, Dell employed 7,500 people in India and planned to hire about 1,500 more. Dell hires Indians to service U.S. customer calls because it is cheaper to hire Indians than Americans.
If Dell keeps its costs of building and servicing computers down, how might
this affect the supply of Dell computers for sale?
to 20, or from point A to B. Stated differently, what has to change before a move from A to B will happen? The answer is that the price (on the vertical axis) must increase from $1 to $2. In other words, the only factor that will change the quantity supplied of a good is a change in price: the factor that is on the vertical axis.
E X H I B I T 5-5 A Change in Supply Versus a Change
in Quantity Supplied
S1 |
S2 |
S1 |
B
Price |
Price |
A |
|
0 |
Quantity supplied |
0 |
Quantity supplied |
|
|
||
|
(a) |
|
(b) |
(a) A change in supply refers to a shift in the supply curve. A change in supply can be brought about by a number of factors. (b) A change in quantity supplied refers to a movement along a given supply curve. A change in quantity supplied is brought about only by a change in a good’s price.
Section 2 The Supply Curve Shifts 121

Will You ?
Live to
Be 100?
Usually, when we talk about supply, we mean the supply
of goods and services. But can an advancement in technology increase the supply of people? One way to increase the supply of people in the world is to increase the length of life. For example, if people start living an average of 100 years instead of 70 years, it means more people in the world.
Michael Rose, a biologist who studies the aging process, found a way to increase the average life span of a fruit fly. The average fruit fly lives for about 70 days, but Rose’s fruit flies live for 140 days. If Rose and other like-minded scientists can do for human beings what they have done for fruit flies, then people in the future may live longer lives. According to some scientists working in the area of aging, ages of 100 or 150 years are not unreasonable.
Now suppose that scientists did figure out how to slow the aging process in humans, and people began to live longer. Also suppose that as a result of slowing the aging process, an average 80-year-old in the future felt the same way an average 50-year-old feels today. What economic effects would this change have?
First, longer-living people would probably work for more years than we do today. People today often start full-time work when they are 22 years old and retire at about 65, a work life of 43 years. In the future, they may start work at 22 and retire at 85, a work life of 63
years.
People are resources, and resources are used to produce goods and services. More people working would mean more goods and services. In other words, the current research on aging, if successful, would lead to a greater supply of goods and services in the world.
Some people believe that the world has only
a finite number of jobs, and so with more people—and the same number of jobs—many more people will be unemployed in the future if people live to be 100. The problem with this way of thinking, though, is that in 2005, the population of the United States was greater than it was in 1982, but the unemployment rate in 1982 was higher than the unemployment rate in 2005. Do you think these numbers are evidence that there “are not a finite number of jobs in the world”?
elasticity of supply
The relationship between the percentage change in quantity supplied and the percentage change in price.
Now let’s move over to Exhibit 5-4 on page 117. Take a look at S1. Ask yourself what has to happen before S1 shifts to its right and becomes S2. Does price (on the vertical axis) have to change? No, as you can see in the exhibit, we never change price from $1,000. So, then, you know that a change in a good’s actual price isn’t what will shift a supply curve. What then does shift a
supply curve? The answer is a change in resource prices, technology, taxes, and so on.
Elasticity of Supply
Chapter 4 discussed elasticity of demand, which deals with the relationship between price and quantity demanded. Elasticity of supply is the relationship between the per-
122 Chapter 5 Supply

 Firm A currently produces 400 skateboards a day at $50 a skateboard. The price of skateboards increases to $55 a skateboard and the firm then starts producing 420 skateboards a day. Because the quantity supplied of skateboards goes up (5%) by a smaller percentage than the price of skate-