


www.ti.com
Setting Up Your Environment for Debug
The debugger allows you to enter a new memory range that overlaps existing ones. The new range is assumed to be valid, and the overlapped range’s attributes are changed accordingly.
After you have defined a memory map, you may wish to modify its read/write attributes. You can do this by defining a new memory map (with the same Starting Address and Length) and clicking the Add button. The debugger overwrites the existing attributes with the new ones.
5.1.3.3Defining Memory Map with GEL
The memory map can also be defined using the general extension language (GEL) built-in functions. GEL provides a complete set of memory-mapping functions. You can easily implement a memory map by putting the memory-mapping functions in a GEL text file and executing the GEL file at start up. (See Section 5.5.1 for an introduction to GEL).
When you first invoke the Code Composer Studio IDE, the memory map is turned off. You can access any memory location without interference from the memory map. If you invoke Code Composer Studio with an optional GEL filename specified as a parameter, the GEL file is automatically loaded. If the file contains the GEL function StartUp(), the GEL functions in the file are executed. You can specify GEL mapping functions in this file to automatically define the memory mapping requirements for your environment.
Use the following GEL functions to define your memory map:
|
Table 5-1. GEL Functions for Memory Maps |
Function |
Description |
GEL_MapAdd() |
Memory map add |
GEL_MapDelete() |
Memory map delete |
GEL_MapOn() |
Enable memory map |
GEL_MapOff() |
Disable memory map |
GEL_MapReset() |
Reset memory map |
The GEL_MapAdd() function defines a valid memory range and identifies the read/write characteristics of the memory range. The following is a sample of a GEL file that can be used to define two blocks of length 0xF000 that are both readable and writeable:
StartUp()
{
GEL_MapOn(); GEL_MapReset();
GEL_MapAdd(0, 0, 0xF000, 1, 1); GEL_MapAdd(0, 1, 0xF000, 1, 1);
}
When you have set up your memory map, choose Option→Memory Map to view the memory map.
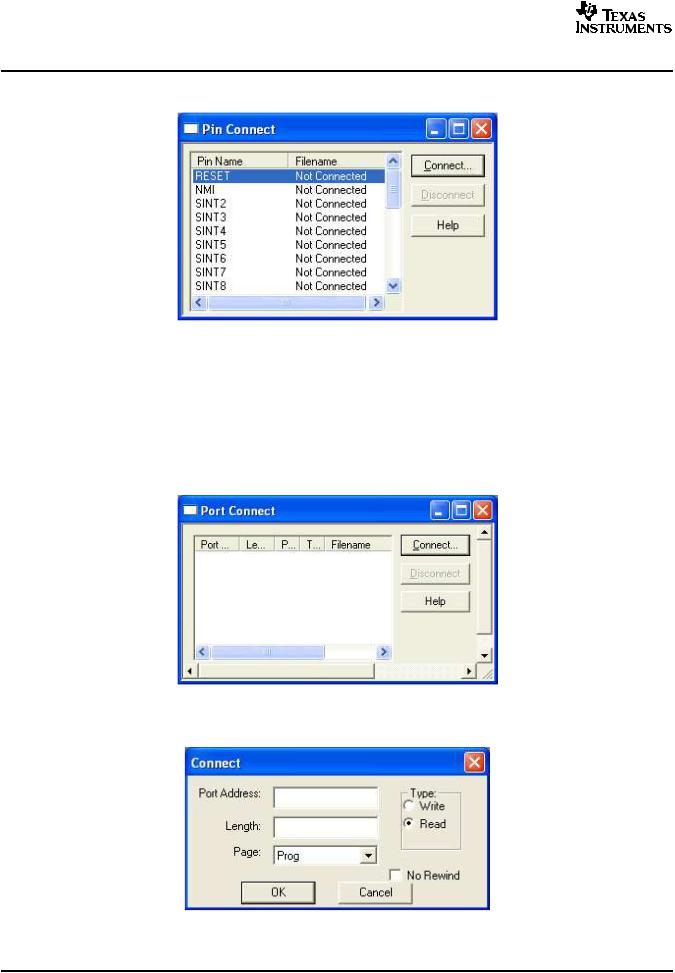
5.1.4Pin Connect
The Pin Connect tool enables you to specify the interval at which selected external interrupts occur.
To simulate external interrupts:
1.Create a data file that specifies interrupt intervals.
2.Start the Pin Connect tool by choosing Pin Connect from the Tools menu.
3.Select the Pin name and click Connect.
4.Load your program.
5.Run your program.
For detailed information on the Pin Connect tool, see the Pin Connect topics provided in the online help: Help→Contents→Debugging→Analysis Tools for Debugging→Pin Connect.
SPRU509F –May 2005 |
Debug |
53 |
www.ti.com
Setting Up Your Environment for Debug
Figure 5-3. Pin Connect Tool
5.1.5Port Connect
You can use the Port Connect tool to access a file through a memory address. Then, by connecting to the memory (port) address, you can read data in from a file, and/or write data out to a file.
To connect a memory (port) address to a data file, follow these steps:
1.From the Tools menu, select Port Connect to display the Port Connect window and start the Port Connect tool.
Figure 5-4. Port Connect Tool
2. Click the Connect button to open the Connect dialog box.
Figure 5-5. Port Address Connection
3.In the Port Address field, enter the memory address. This parameter can be an absolute address, any C expression, the name of a C function, or an assembly language label. If you want to specify a hex address, be sure to prefix the address number with 0x. Otherwise, it is treated as a decimal address.
54 |
Debug |
SPRU509F –May 2005 |

www.ti.com
Setting Up Your Environment for Debug
4.In the Length field, enter the length of the memory range. The length can be any C expression.
5.In the Page field (C5000 only), choose type of memory (program or I/O) that the address occupies. For program memory, choose Prog. For I/O space, choose I/O.
6.In the Type field, select the Write or Read radio button, depending on whether you want to read data from a file or write data to a file.
7.Click OK to display the Open Port File window.
8.Select the data file to which you want to connect and click Open.
9.Select the No Rewind feature to prohibit the file from being rewound when the end-of-file (EOF) is reached. For read accesses made after EOF, the value 0xFFFFFFFF is read and the file pointer is kept unchanged.
The file is accessed during an assembly language read or write of the associated memory address. Any memory address can be connected to a file. A maximum of one input and one output file can be connected to a single memory address. Multiple addresses can be connected to a single file.
For detailed information on the Port Connect tool, see the Port Connect topics provided in the online help: Help→Contents→Debugging→Analysis Tools for Debugging→Port Connect.
5.1.6Program Load
The COFF file (*.out) produced by building your program must be loaded onto the actual or simulated target board prior to execution.
Program code and data are downloaded onto the target at the addresses specified in the COFF file. Symbols are loaded into a symbol table maintained by the debugger on the host. The symbols are loaded at the code and data addresses specified in the COFF file.
A COFF file can be loaded by selecting File→Load Program and then using the Load Program dialog box to select the desired COFF file.
5.1.6.1Loading Symbols Only
It is useful to load only symbol information when working in a debugging environment where the debugger cannot or need not load the object code, such as when the code is in ROM.
Symbols can be loaded by selecting File→Load Symbols→Load Symbols Only from the main menu and then using the Load Symbols dialog box to select the desired COFF file.
The debugger deletes any previously loaded symbols from the symbol table maintained on the host. The symbols in the symbol file are then loaded into the symbol table. Symbols are loaded at the code and data addresses specified in the symbol file. This command does not modify memory or set the program entry point.
You can also specify a code offset and a data offset that the debugger will apply to every symbol in the specified symbol file. For example, if you have a symbol file for an executable that contains code addresses starting at 0x100 and data addresses starting at 0x1000. However, in the program loaded on the target, the corresponding code starts at 0x500100 and the data is located at 0x501000.
To specify the code and data offset, select File→Load Symbols→Load Symbols with Offsets from the main menu and then use the Load Symbols dialog box to select the desired COFF file. Once a COFF file is selected, an additional Load Symbols with Offsets dialog box will appear for you to enter the actual starting addresses for code and data.
SPRU509F –May 2005 |
Debug |
55 |