Сборник трудов конференции СПбГАСУ ч
.2.pdfРаздел 4. Лабораторные и полевые исследования грунтов и фундаментных конструкций…
References
[1]DEN HAAN E. J., EDIL T. B., 1994.Secondary and tertiary compression of peat. Advances in Understanding and Modelling the Mechanical Behaviour of Peat.
[2]HEAD K.H., 1998: Manual of soil laboratory testing: Volume 3 effective stress tests.
[3]MALINOWSKA E. The strain analysis of selected organic soils considering non-linear flow characteristics. PhD Thesis, Warsaw University of Life Sciences, 2005 [In Polish].
[4]MALINOWSKA E. 2011: Flow-pump technique as a constant velocity method of flow measurement in soft organic soils. Electronic Journal of Polish Agricultural Universities, Civil Engineering Vol. 14, Issue 4, #06.
[5]MALINOWSKA E., SZYMAŃSKI A., SAS W. Determination of water flow characteristics in organic soils by the flow-pump technique. Warsaw University of Life Sciences Press. Scientific Review Engineering and Environmental Sciences Vol. 31 (1), pp. 114-121, 2005 (In Polish).
[6]MALINOWSKA E., SAS W., SZYMAŃSKI A. Nonlinear water flow characteristics describing soil consolidation. Electronic Journal of Polish Agricultural Universities, Civil Engineering Vol. 10, nr 4 # 41, 2007.
[7]MALINOWSKA E., SZYMAŃSKI A., SAS W. 2011: Estimation of flow characteristics in peat. ASTM Inter. Geotechnical Testing Journal, Vol. 34, No. 3, pp. 250-254.
[8]ROWE P.W., BORDEN L., 1966: A new consolidation cell. Geotechnique
[9]SAS W., SZYMAŃSKI A., MALINOWSKA E., NIESIOŁOWSKA A., GABRYŚ K. 2011: Analysis of deformation course in problematic soils under embankment. Geotechnics of Hard Soils – Weak Rocks. Part 1 / ed. by Andreas Anagnostopoulos, Michael Pachakis, Christos Tsatsanifos. – IOS Press & Millpress pp. 1199-1204.
[10]MALINOWSKA E., SAS W., SZYMAŃSKI A. 2013: Analiza wpływu rodzaju obciążenia na odkształcalność podłoża słabonośnego. Budownictwo i Inżynieria Środowiska / Politechnika Białostocka 2013, Vol. 4, nr 1, s. 47-52.
УДК 624.151
В. Soldo (Faculty of Geotehnical Engineering, Varazdin, Croatia) A.A. Aniskin (Polytechnic in Varaždin, Croatia)
EXPERIMENT AND THEORY OF PILE BEARING
CAPACITY IN A COHERENT SOIL
ABSTRACT
An investigation of piles with compressive and tensile load on clay will be shown in this article. Beside the experimental testing of piles in clay and determined laboratory testing (that are adapted to the experiment), determined design procedures, their compare and the valuation of validity are also shown. In the design procedures some factors that are empirically in the literature are set theoretically. Many results of experimental researches on piles drilled in clay are also gathered.
KEY WORDS: drilled piles, clay, experiment, a-method, bearing factor, pile bearing capacity.
241

Современные геотехнологии в строительстве и их научно-техническое сопровождение
INTRODUCTION
In the literature, there are numerous bearing factor values of bearing capacity on the tip of pile, depending on the author. For example, in the case of undrained
cohesive soil, threw designing the bearing factor Nc is gained which is based on theory and empirically based on laboratoticall investigations. Some authors assume
that the Nc factor depends on numerous factors and it is mostly from 6 to 13. This work shows the theoretical investigation of the bearing factor of the tip of pile.
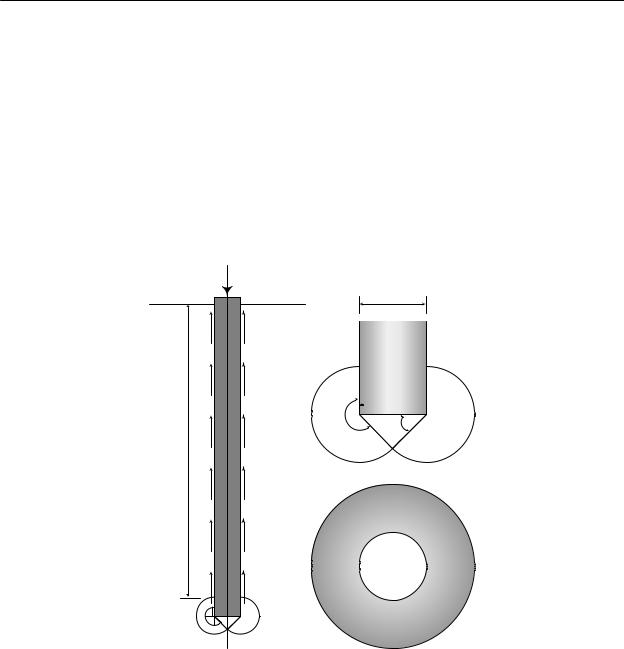
L =1,5 m p
2 |
2 |
Qf |
Qf |
1 |
1 |
|
|
Dp |
Dp |
D |
D |
|
|
|
|
|
FIG.2 Pile engaged in soil |
FIG. 3. Compressive pile test- |
|
Do=0,13 m |
|||||
FIG. 1 The scheme of pile |
|
ing, the load is a lorry |
||||
|
|
|
|
load |
|
|
|
|
|
|
|
|
|
Many experimental researches for the superficies, that will also be theoretically defined, have been gathered. Laboratory researches that are adapted to the experimental researches have been lead, so that the bearing design with strength parameters c, soil (cohesion and friction angle). The design results will be com-
pared with the experimental (measured).
Experimental researches
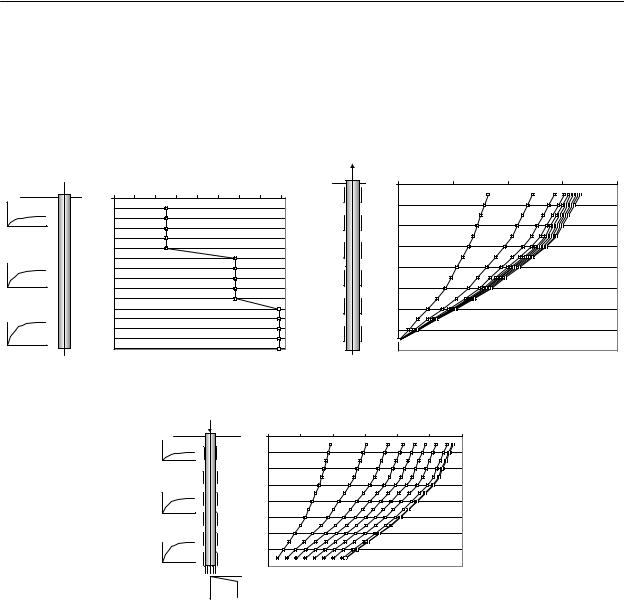
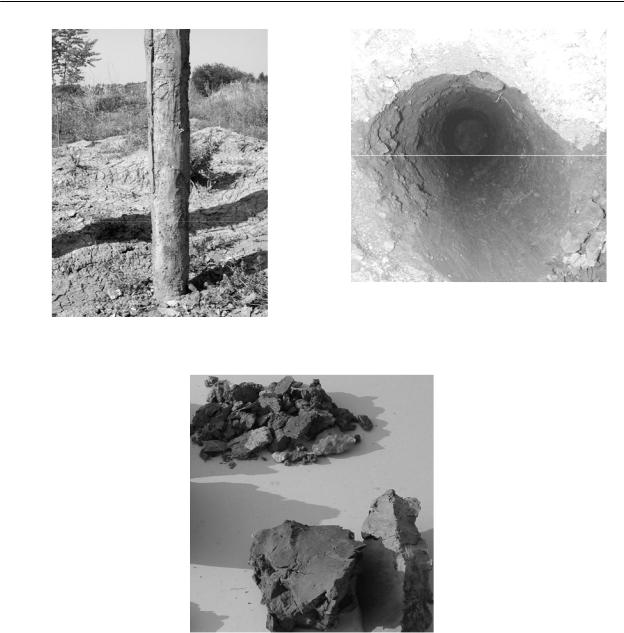
In order to establish the piles bearing capacity on the tip and superficies, their relationship and other visual occurrences, an experiment on piles has been lead. The experiment has been lead on two piles, one pile was loaded with compression load and the other one with tensile load. As shown on picture 1.
FIG. 4 Tensile pile testing ,with a press
FIG. 5 Piles pulled out of soil after testing
242
Раздел 4. Лабораторные и полевые исследования грунтов и фундаментных конструкций…
FIG. 6 Formed soil on pile after pulling it out |
FIG. 7 The drill hole after pulling out the |
pile |
FIG. 8 The soil condition after load
The picture 6 shows that the formed soil no the pile is thicker from the tip of the pile, while towards the top of the pile shear occurs on the pile (concrete) and soil contact. The soil has been reviewed after pulling out the pile and after excavation where it has been noticed that soil in the pile tip area with less disturbance transforms to tenuous (loose) soil as shown on picture 8, while the other sample has completely different characteristics along the superficies, its more compact and not loose due to the disturbance as the preceding, picture 8.
Laboratory researches
In purpose of pile investigation, laboratory tests that are shown in the continuation have been carried through:
– undrained clay strength test by the vane shear testing aparature (diameter
12.7mm and slope speed 6 o  min ), after numerous test samples was
cu 56 63 kN  m2 , therefore the average value cu 60 kN
  m2 is appropriated.
243
Современные геотехнологии в строительстве и их научно-техническое сопровождение
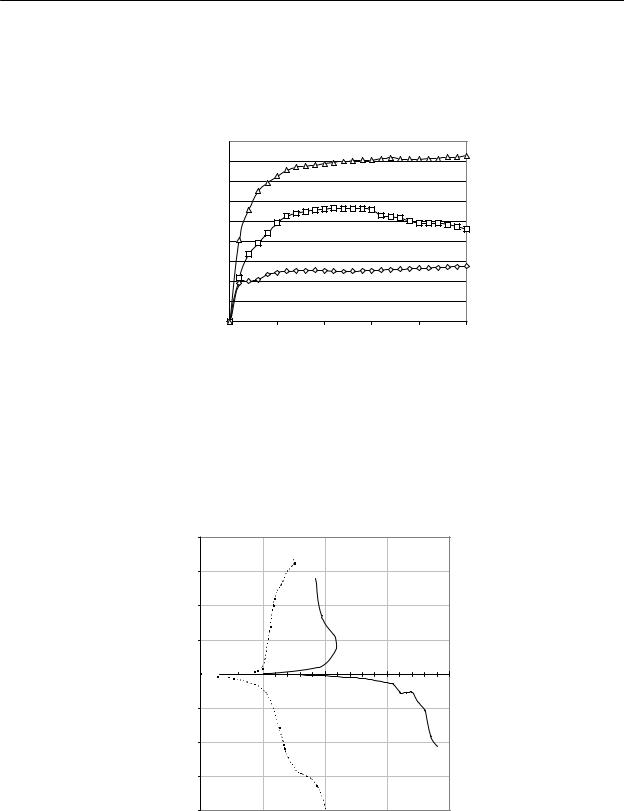
The movement – shear strength relation for the load transfer design method between concrete and clay is lead through (picture 9.). The slope speed by direct shear is approximately equal to the speed of tested piles, in order to lead a suitable design for comparing with the measured values. The slope speed of direct shear and of slope pile till bearing was ≈ 0,5 mm/min.
|
45 |
|
|
|
|
|
|
40 |
|
|
|
|
|
] |
35 |
|
|
|
|
|
2 |
|
|
|
|
|
|
t [kN/m |
|
|
|
|
|
|
30 |
|
|
|
|
|
|
25 |
|
|
|
|
|
|
strangth |
|
|
|
|
|
|
20 |
|
|
|
|
|
|
15 |
|
|
|
|
|
|
Shear |
|
|
|
|
|
|
10 |
|
|
|
|
|
|
|
|
|
|
|
|
|
|
5 |
|
|
|
|
|
|
0 |
|
|
|
|
|
|
0 |
0.002 |
0.004 |
0.006 |
0.008 |
0.01 |
|
|
|
Movement [m] |
|
|
|
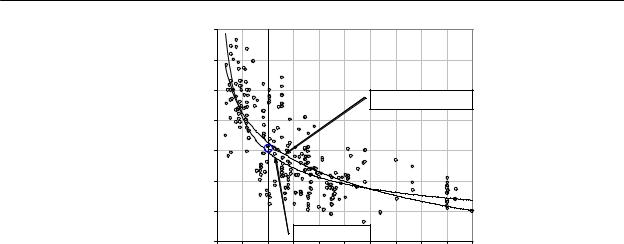
FIG. 9 Deformation diagram, concrete – clay
The experimental investigation results
The diagram on picture 10 shows the force and pile movement relation for all conducted examples of pile testing: piles tested for tensile strength, piles tested for compressive strength and piles tested for tensile strength that were preliminary tested for compressive strength, as piles tested for compressive strength that were preliminary tested for tensile strength.
Settlement s [mm]
-40
-30
-20
-10
Force on pile Q [kN]
0 |
10 |
20 |
30 |
40 |
0 


10
20
30
40
FIG. 10 The force – movement diagram for all conducted compressive and tensile pile tests
The lines in the upper part of diagram are the force to movement ratios for tensile load piles, and in the lower part of diagram are the force to movement ratios for compressive load piles. The solid lines indicate the force to movement ratios
244

 8 of full circle.

 2 ,
2 ,