

49
Figure 17: Program C results of chest X-ray
Program D is free-of-charge; it is an automated analysis system from a foreign developer. Based on the data of the developers, the system was trained with 43,292 chest X-rays: 34,067 images with no pathology against 9,225 chest images with pulmonary pathology. A deep convolutional neural network with 25 layers and 8 residual connections was developed; the output data of the 3 networks trained with various parameters were put to average values. As a processing result, the program offers a probability value for an X-ray from 0 to 1 for each chest X-ray and a localization map of detected changes layered over the initial chest X-ray. The system aims at detecting nodules and masses (classified as per X-rays) and their localization in the lungs (pathology localization). A chest X-ray in DICOM format is used as a source for input data; it is also possible to download an image with completed analysis results. The program has a web interface allowing users to view the results of image analysis, to change the brightness and contrast of images (Figure 18) [120].

50
Figure 18: Program D results of chest X-ray
The analytical validation method was used for the clinical assessment. Analytical validation is a type of validation, which assesses the ability to ensure the values necessary for diagnostic efficiency of the output data when the input data is given. During analytical validation, the software is tested with benchmark data sets prepared in accordance with a clinical task and registered in a proper manner [18].
By using the DICOM standard and JPEG and PNG formats, the diagnostics algorithm provides evaluation results of a downloaded image in the form of a heat map with pathology localization, if any, and the probability of its presence in percentage terms or by setting up the probability/necessity of additional examination [11].
When analyzing the X-rays interpretation results by the diagnostic algorithm from Database 2, the category of false-positive results included images with pathology localization in both pulmonary fields with the pathology of more than 10%, excluding cases indicating possible nodules and masses in the area of pulmonary hilum and behind the heart shadow due to the summation effect and shadows subtraction [11].
Three sampling packages with various pathology distribution were formed for the testing.
Рекомендовано к изучению разделом по лучевой диагностике сайта https://meduniver.com/
51
Sampling Package 1 – 5,150 X-rays: 5,000 digital chest X-rays with no pulmonary pathology and 150 digital X-rays with pulmonary nodules and masses (3% pathology distribution).
Sampling Package 2 – 100 X-rays, 94:6% norm/pathology ratio (6 persons with confirmed pulmonary nodules and masses and 94 persons without significant pathology) – 6% pathology distribution.
Sampling Package 3 – 300 X-rays: 150 digital chest X-rays without pulmonary pathology and 150 digital X-rays with pulmonary nodules and masses – 50% pathology distribution [44].
Availability of three different packages was driven by the academic data on the presence of differences in the sensitivity and specificity values of the same software products at different levels of pathology distribution [44, 115].
Sampling Packages 1 and 2 with dominating images with no pathology are more typical for the X-ray screening model, specifically Sampling Package 2 with 100 images. Sampling Package 3 reflects the nature of the norm/pathology distribution of a diagnostic pulmonary center, where patients often have a certain set of complaints and pulmonary pathologies.
Due to the limited number of uploaded images under the test access to two of the four systems (C, D), Sampling Package 1 was tested with only two software products (A, B).
Sampling Packages 2 and 3 were tested with all four systems due to the small number of images that fit into the volume provided for test access to the software products.
In our earlier research with one of the software products, a decrease in the sensitivity value was noted against the decrease in occurrence [9].
The evaluation of the efficiency values of detecting pulmonary nodules and masses on digital PA chest X-rays was carried out (sensitivity, specificity, likelihood ratio of a positive test, likelihood ratio of a negative test, positive predictive value, negative predictive value, accuracy). Additionally, we built graphs to evaluate the quality of binary classification, characteristic curves (ROC-curves) [4].
52
Also, a statistical data analysis was done using IBM SPSS Statistics v.19. The Shapiro-Wilk test was used for the assumption about the normality of distribution of the analyzed quantitative indicators. Since most quantitative features did not obey the law of normal distribution, they are presented in the form of a median, the first and third quartiles (Me [Q1; Q3]). Comparison of quantitative data between three or more independent groups was carried out using the Kruskal-Wallis test. Comparison of quantitative data between two independent groups was carried out using the MannWhitney test. In pairwise comparison of independent groups, the significance level was corrected against multiple comparisons using the Benjamini-Hochberg Procedure. The differences were considered significant with the significance level p <0.05.
The following model quality criteria were used in the analysis (ROC-curves): Area Under Curve (AUC) is evaluated as 0-1:
<0.6 – inapplicable;
0.61-0.8 – more work required;
> = 0.81 – can be used for clinical validation [18].
In fact, this approach allows us to quantify possible detection of pulmonary nodules and masses on PA chest X-rays and identify the correlation of the X-rays interpretation results with the work experience of a radiologist and their experience in thoracic radiology [6].
2.4 Joint Testing of Radiologists and Automated Analysis Systems
At the last stage, we have studied possible options for the introduction of automated analysis systems of digital X-rays as a method for detecting chest diseases in the clinical practice of radiologists.
A joint analysis of the test base previously used by us for online testing (94:6% norm/pathology ratio) of radiologists and automated analysis systems of digital X-rays simulating two different situations, have been completed:
1. Primary analysis of digital X-rays by a radiologist, followed by analysis of X-rays with suspected pulmonary pathologies and an automated analysis system of digital X-rays, followed by a final reply of a radiologist about the presence/absence of
Рекомендовано к изучению разделом по лучевой диагностике сайта https://meduniver.com/
53
pulmonary pathology, after learning about the interpretation results of an image from the automated analysis system.
2. Primary analysis of digital X-rays by the system of machine learning and digital X-rays analysis, followed by analysis of all X-rays carried out by a radiologist with the further provision of the results from the automated analysis system.
To hold down the systematic error and ensure the uniformity of the specialists selection in question, linked with the influence of work experience and years on the test results, the graduates of the radiology residency from three different institutions (Federal State Budgetary Institution St. Petersburg Research Institute of Phthisiopulmonology under the Ministry of Health of the Russian Federation, St. Petersburg State University, Federal State Budgetary Institution of Science St. Petersburg Bekhterev Psychoneurological Research Institute under the Russian Academy of Sciences), who had successfully passed the state certification, were included in both groups. Distribution of radiologists between Group 1 and Group 2 was carried out randomly (Table 5).
Table 5: Distribution of radiologists between groups
INSTITUTION |
FSBI SPb NIIF |
SPbSU |
BPRS RAS |
Group 1 |
2 |
6 |
2 |
Group 2 |
2 |
5 |
3 |
When analyzing X-rays, the specialists had to fill in a form with answers, by assigning the norm/pathology status to X-rays.
Statistical data analysis was done using IBM SPSS Statistics v.19. The ShapiroWilk test was used for the evaluation of the normality of distribution of the quantitative data. Since the distribution of most quantitative indicators did not obey the law of normal distribution, all quantitative indicators are presented in the form of a median, the first and third quartiles (Me [Q1; Q3]). When comparing more than two groups, the comparison of the data between such groups was done with Kruskal-Wallis test; the Mann-Whitney test was used when comparing two groups. The differences were considered statistically significant with the significance level p <0.05.
54
CHAPTER 3 INFORMATIVE VALUE OF DIGITAL X-RAYS IN DETECTING PULMONARY NODULES AND MASSES DEPENDING ON QUALIFICATIONS OF A RADIOLOGIST BASED THROUGH X-RAY SCREENING
While researching the diagnostic efficiency of radiologists, the first stage was an in-person testing attended by 75 specialists with work experience from 1 to 10 years or more, working in various medical institutions with various work scope.
The participants were divided into two groups: a group with up to ten years of work experience (N=55) and a group with more than ten years of work experience (N=20) [44]. Such division was based on the results of a study by Nakamura K., during which it was revealed that the most significant factor affecting the interpretation quality of X-ray data is having more than ten years of work experience with possible analysis of more than 20,000 X-rays per year [119].
As per the results, the rate of correct answers in the in-person testing varied from 50% to 95% (72.5% in average).
Table 6: Efficiency in detecting pulmonary nodules and masses depending on work experience
|
|
Less than 10 |
More than 10 years |
p |
|
|
General |
years of |
|
||
Parameters |
of experience |
|
|||
Data |
experience |
|
|||
|
(N=20) |
|
|||
|
|
(N=55) |
|
||
|
|
|
|
||
Sensitivity (%) |
83.3 |
83.3 |
83.3 |
0.950 |
|
[50.0; 83.3] |
[50.0; 87.5] |
[66.7; 83.3] |
|||
|
|
||||
Specificity (%) |
75.0 |
78.6 |
71.4 |
0.667 |
|
[57.1; 85.7] |
[57.1; 85.7] |
[51.8; 83.9] |
|||
|
|
||||
Likelihood Ratio of a |
2.3 |
2.3 |
2.2 |
0.812 |
|
Positive Test (un.) |
[1.4; 3.9] |
[1.2; 3.9] |
[1.7; 2.9] |
||
|
|||||
Likelihood Ratio of a |
0.3 |
0.3 |
0.3 |
0.755 |
|
Negative Test (un.) |
[0.2; 0.6] |
[0.1; 0.6] |
[0.2; 0.6] |
||
|
|||||
Positive Predictive Value |
54.5 |
55.6 |
50.0 |
0.719 |
|
(%) |
[41.7; 66.7] |
[39.6; 71.4] |
[42.4; 65.6] |
||
|
Рекомендовано к изучению разделом по лучевой диагностике сайта https://meduniver.com/

55
Negative Predictive Value |
87.5 |
88.9 |
87.5 |
0.663 |
|
(%) |
[78.6; 93.3] |
[78.6; 95.0] |
[79.4; 91.5] |
||
|
|||||
Accuracy (%) |
75.0 |
75.0 |
70.0 |
0.603 |
|
[60.0; 81.3] |
[60.0; 85.0] |
[61.3; 79.1] |
|||
|
|
As shown by the results from Table 6, the sensitivity values do not differ depending on the work experience of a radiologist [43].
Figure 19: Area under curve for radiologists (mean value)
The average AUC value (0.792) among radiologists approaches the threshold, but does not reach it, which more clearly shows the low diagnostic efficiency of PA chest X-rays as a method for detecting pulmonary nodules and masses (Figure 19) [43].
During this research, the percentage of correct answers was almost the same for the radiologists with less than 10 years of work experience (72.6%) and for the specialists with more than 10 years of work experience (71.3%), while the average percentage value of detected pathology was higher among doctors with less than 10 years of work experience and amounted to 72.6% [43]. Whereas the highest average percentage value of missed pathology was among doctors with more than 10 years of work experience (28.3%). Along with this, the norm was detected more often among radiologists with less work experience – the average percentage value of the detected norm was 73.2%, while for the doctors with more than 10 years of experience it was 71.1% [43].
56
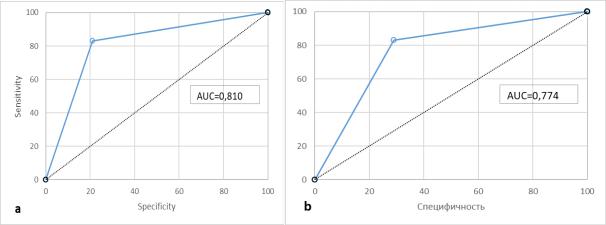
Figure 20: Area under curve for radiologists with experience of up to 10 years (a), with experience of more than 10 years (b)
The characterological curves clearly show a trend towards a decrease in diagnostic efficiency in detecting pulmonary nodules and masses on PA chest X-rays with an increase in the work experience of radiologists, which is due to a large percentage of missing pathology (Figure 20).
During the in-person testing of radiologists, the influence of experience in thoracic radiology on the quality of interpretation of digital chest X-ray was also studied. The specialists were divided into two groups: radiologists exposed to thoracic radiology (N=11) and radiologists with no such exposure (N=64) [43].
Table 7: Efficiency in detecting pulmonary nodules and masses depending on work experience in thoracic radiology
|
|
Results of doctors |
Results of doctors |
|
|
Parameters |
General |
with exposure to |
without exposure to |
p |
|
Data |
thoracic radiology |
thoracic radiology |
|||
|
|
||||
|
|
(N=11) |
(N=64) |
|
|
|
83.3 |
83.3 |
83.3 |
|
|
Sensitivity (%) |
[50.0; |
0.895 |
|||
[50.0; 100.0] |
[50.0; 83.3] |
||||
|
83.3] |
|
|||
|
|
|
|
||
|
75.0 |
78.6 |
71.4 |
|
|
Specificity (%) |
[57.1; |
0.216 |
|||
[71.4; 92.9] |
[57.1; 85.7] |
||||
|
85.7] |
|
|||
|
|
|
|
||
Likelihood Ratio of |
2.3 |
2.3 |
2.0 |
0.276 |
Рекомендовано к изучению разделом по лучевой диагностике сайта https://meduniver.com/

57
a Positive Test (un.) |
[1.4; |
[1.4; 7.0] |
[1.3; 3.9] |
|
|
|
3.9] |
|
|
|
|
Likelihood Ratio of |
0.3 |
0.2 |
0.3 |
|
|
a Negative Test |
[0.2; |
0.674 |
|||
[0.0; 0.6] |
[0.2; 0.6] |
||||
(un.) |
0.6] |
|
|||
|
|
|
|||
Positive Predictive |
54.5 |
55.6 |
54.5 |
|
|
[41.7; |
0.365 |
||||
Value (%) |
[50.0; 80.0] |
[41.7; 66.7] |
|||
66.7] |
|
||||
|
|
|
|
||
Negative Predictive |
87.5 |
90.9 |
87.5 |
|
|
[78.6; |
0.652 |
||||
Value (%) |
[78.6; 100.0] |
[78.6; 92.3] |
|||
93.3] |
|
||||
|
|
|
|
||
|
75.0 |
75.0 |
75.0 |
|
|
Accuracy (%) |
[60.0; |
0.351 |
|||
[70.0; 90.0] |
[60.0; 80.0] |
||||
|
81.3] |
|
|||
|
|
|
|
Figure 21: Area under curve for radiologists with experience in thoracic radiology (a), without said experience (b)
The sensitivity averaged at 83.3% (Table 7), while no difference in the values among the doctors with exposure to thoracic radiology or without it was obtained. The specificity averaged at 75.0%, the radiologists with experience received higher values compared to their colleagues without such experience – 78.6% versus 71.4% (Figure 21). Along with this, there is a higher positive predictive value (55.6%), which indicates more rare cases of over-diagnosis, compared with the specialists who do not work in diagnostic pulmonary centers. The negative predictive value averaged at 87.5%, accuracy at 75%.
58
According to the analysis results of how exposure to thoracic radiology influences work, it was revealed that doctors with exposure to thoracic radiology more often detected pathology correctly on X-rays – the average percentage value of detected pathology was 74.2%, while doctors without such exposure achieved 72%. A similar pattern can be traced in the value of the pathology omission rate – among doctors without exposure to thoracic radiology, it turned out to be higher and amounted to 27.4%, while doctors with similar experience missed pathologies less often, in 25.7% of cases.
It should be noted that the difference between the researched groups of radiologists in terms of exposure to thoracic radiology was not significant, as well as in comparison with the group of radiologists with different work experience.
Summarizing all of the above, it was revealed that the highest average percentage of detected pathology was among the doctors with exposure to thoracic radiology and with more than 10 years of work experience. At the same time, this category had the highest average value of over-diagnosis cases. Doctors had more cases with omitted pathology, and the percentage of over-diagnosis was smaller.
The influence of radiological features of pulmonary nodules and masses on the quality of their detection by radiologists was also analyzed.
Thus, regardless of work experience and exposure to thoracic radiology, the complexity of interpreting digital X-rays with pathology consisted of two factors due to the summation and planar nature of X-ray images and, therefore, presence of both the summation effect and subtraction of shadows of the researched structures: pathology localization behind the shadow of the first rib or collarbone and low intensity of the shadow of the existing changes on a digital X-ray.
Рекомендовано к изучению разделом по лучевой диагностике сайта https://meduniver.com/