

Mechanical Properties of Ceramics and Composites
.pdf170 |
|
|
|
|
|
|
Chapter 3 |
||
TABLE 3.1 Summary of Fracture Mechanics Evaluation of σ–G-1/2 Behavior of Ceramics |
|||||||||
|
|
|
|
|
|
||||
|
|
|
|
Larger Gb |
Larger–finer G branch intersection |
||||
|
|
K |
a |
|
|
|
|
|
|
|
|
Slope |
|
|
|
|
|
||
|
|
|
IC |
|
|
σ (MPa) |
|
c(µm)c |
|
Material (Fig. no.) |
(MPa·m1/2) (MPa·m1/2) |
|
G (µm) |
||||||
|
|
|
|
|
|
|
|
|
|
(A) Noncubic Ceramics |
|
|
|
|
|
|
|
|
|
Al2O3 (Fig. 3.13, survey) |
3.5 |
(1.5–2) |
3.2 (2.3) |
|
590 |
25 |
22 |
(7) |
|
Al2O3 (Fig. 3.13, survey) |
3.5 |
(1.5–2) |
4.0(2.8) |
|
290 |
120 |
92(30) |
||
Al2O3 (Fig. 3.13, Komaya |
|
|
|
|
|
|
|
|
|
et al.) |
3.5 |
(1.5–2) |
2.7 (1.9) |
|
440 |
23 |
40 |
(13) |
|
Al2O3 (Fig. 3.13, |
|
|
|
|
|
|
|
|
|
Tomaszewski) |
3.5 |
(1.5–2) |
2.0 (1.4) |
|
180 |
70 |
240 |
(78) |
|
Al2O3 (Fig. 3.14, Alford |
|
|
|
|
|
|
|
|
|
et al.) |
3.5 |
(1.5–2) |
3.2 (2.3) |
|
800 |
16 |
12 |
(4) |
|
Al2O3 (Fig. 3.14, Charles) |
3.5 |
(1.5–2) |
2.2 (1.5) |
|
290 |
60 |
92 |
(30) |
|
Al2O3-W (Figure 314, Hing |
3.5 |
|
|
|
|
|
|
|
|
et al.) |
|
|
2.3 (1.6) |
|
350 |
70 |
62 |
|
|
BeO (Fig. 3.16, survey) |
3.5 |
|
|
1.8 (1.3) |
|
250 |
25 |
123 |
|
TiO2 (Fig. 3.17, Alford |
|
|
|
|
|
|
|
|
|
et al.) |
2.5 |
(0.8) |
1.6 (1.1) |
|
680 |
6 |
11 |
(0.9) |
|
TiO2 (Fig. 3.17, Alford |
|
|
|
|
|
|
|
|
|
et al.) |
2.5 |
(0.8) |
1.6 (1.1) |
|
250 |
30 |
63 |
(6.5) |
|
β Al2O3 (Fig. 3.19, Virkar |
3 (0.16) |
|
|
|
|
|
|
||
and Gordon) |
1.9 (1.3) |
|
170 |
110 |
196 |
(0.6) |
|||
β Al2O3 (Fig. 3.19, Virkar |
3 (0.16) |
|
|
|
|
|
|
||
and Gordon) |
1.9 (1.3) |
|
120 |
190 |
394 |
(1.1) |
|||
B4C (Fig. 3.22, survey) |
3.3 |
|
|
1.4–2.3 (1–1.6) |
550 |
15 |
23 |
|
|
Si3N4 Fig. 3.23, Larson |
≥4 |
|
|
|
|
|
|
|
|
et al.) |
|
|
2–4 (1.4–2.8) |
450 |
18–110 |
50 |
|
||
(B) Cubic Ceramics |
|
|
|
|
|
|
|
|
|
ThO2 (Fig. 3.7, Knudsen) |
1.1(0.65) |
0.7 (0.5) |
|
230 |
15 |
19 |
(5) |
||
ZrO2 (+Y2O3, Fig. 3.9) |
|
|
|
|
|
|
15 |
|
|
MgAl2O4 (Fig. 3.11, survey) |
2 (1) |
|
1.8 (1.3) |
|
400 |
25 |
16 |
(4) |
|
MgAl2O4 (Fig. 3.10, Bailey |
|
|
|
|
|
|
|
|
|
and Russell) |
2 (1) |
|
2.1 (1.5) |
|
330 |
30 |
23 |
(6) |
|
SiC(Fig. 3.12, Cranmer |
|
|
|
|
|
|
|
|
|
et al.) |
3.5 |
(2) |
2.6–3.5 (1.8–2.5) |
400 |
50 |
48 |
(16) |
||
SiC(Fig. 3.12, CVD, Gulden) |
3.5 |
(2) |
2.6–3.5 (1.8–2.5) |
950 |
10 |
9 |
(3) |
||
C(CVD diamond, Fig. 3.14, |
|
|
|
|
|
|
|
|
|
Savage et al.) |
5 |
|
|
6+(4.3) |
|
500 |
100 |
100–250 |
|
a Polycrystalline and single crystal values per Table 2.1, the latter in ().
b Values in () are the slopes multiplied by 0.71 to convert them to comparable toughness values, since grain size (G) is measured as a diameter and flaw size(c) as a radius.
c Values shown are calculated for a surface half penny crack per Eq. (3.3) using either polycrystalline or (where known) single crystal fracture toughnesses, the latter results shown in ( ).
Grain Dependence of Ceramic Tensile Strengths at 22°C |
171 |
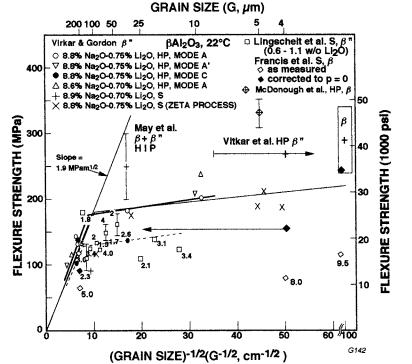
FIGURE 3.22 Strengths of various machined beta aluminas versus G-1/2 of Virkar and Gordon [195] (hot pressed or sintered, plotted vs. Gm) and various other studies [196–200] of hot pressed, HIPed, and sintered bodies plotted versus average G, Ga (horizontal bars for some bodies with a wider G range). (From Ref. 2, published with the permission of the Journal of Materials Science.)
fundamental difference between the G dependences of strength and toughness (Figure 2.18), i.e. the strength continuously decreasing as G increases, while toughness goes through a, commonly significant, maximum at certain G, e.g. 1–3 µm. Thus there is a need to integrate the σ – G-1/2 behavior with evaluation of mechanisms for transformation toughening. Some of this may involve increased G increasing the martinsitic start temperature, which reduces KIC [189–194] and hence generally σ, thus also impacting σ – G-1/2 trends, but such effects are not pertinent to fully stabilized ZrO2 and are of uncertain applicability to precipitate toughened PSZ. Thus the toughness maximum must reflect testing effects not pertinent to normal strength behavior, though the general increase in toughness from transformation does increase strength in two ways, as is discussed later.
172 |
Chapter 3 |
Data for (mostly hot pressed) β″-Al2O3 bodies of Virkar and Gordon [195] vs. Gm (Ga values and specifics of the Gm determination were not given) clearly showed the characteristic two-branch σ – G-1/2 behavior with the larger G slope < KIC (Table 3.1) and the finer G slope probably >0 (Fig. 3.22). The crystallographic orientation from hot pressing was a primary factor in a second probable finer G branch. More limited earlier data of other investigators [196–200] was generally consistent with this data, given effects of some porosity, composition differences, and larger grains from exaggerated grain growth [2]. However, again resultant larger tabular grains were large enough to be fracture origins in some cases and not others. McDonough et al.’s [196] fractography in their uniformly fine grain bodies showed clear fracture origins from typical machining flaws substantially larger than the fine ( 5 µm) grains.
Chu et al.’s data for Li4SiO4 (G 3–50 µm, P 2–32%, increasing as G decreased) indicated a possible finer–larger G intersection at G 3 – 10 µm using their porosity correction of e-3.8P [201]. The limited data on highly anisotropic
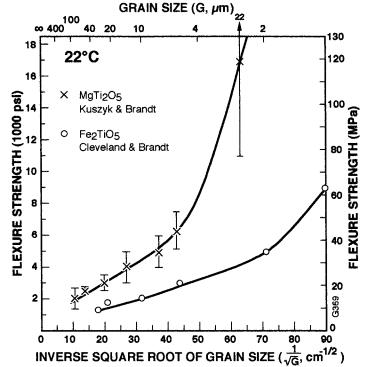
FIGURE 3.23 Strengths of MgTi2O5 [202] and Fe2TiO5 [203] as a function of G-1/2.

Grain Dependence of Ceramic Tensile Strengths at 22°C |
173 |
materials such as MgTi2O5 [202] and Al2TiO4 [203] with extensive microcracking showed a significant change in σ – G-1/2 behavior, i.e. a much faster decrease in strengths at fine G, then saturating as G increases (Fig. 3.23). Data for these two materials also show nominally identical G dependence of their Young’s moduli.
C.Noncubic Nonoxide Ceramics
Data for dense sintered and hot pressed bodies MgF2 [204 and 205] shows strengths of bodies with average G ≥ 1 µm substantially decreasing within normal bounds as G increases (Fig. 3.24), with some difference in strengths at a
FIGURE 3.24 Strength versus G-1/2 for hot pressed and sintered MgF2 test bars with polished surfaces [204–207], and for three basic orientations of single crystals (error bars are shown for the standard deviations where greater than the symbol height), with no evidence of plasticity observed [204]. Note the decrease in strength with increasing G at G > 1 µm and decreasing G < 1 µm. Vertical arrows indicate probable corrections for limited porosity.
174 |
Chapter 3 |
given G between the different investigators, data of Lin et al. [205] being higher than the others. This probably reflects typical flaw differences due to differences in machining, residual processing defects, and specimen size and other testing effects, which are particularly pertinent to this probably being the finer G branch. This data is consistent with an intersection with the larger G branch being at ≥ G = 10 µm, which in turn is consistent with typical polishing flaws in dense (transparent) MgF2 being of the order of 10–20 µm [18]. Note that polycrystalline strengths are below single crystal strengths. Also note the clear decreases in strength as G decreased below 1 µm, attributed to retention of (primarily anion, e.g. OH) impurities [204] from higher pressure hot pressing at lower temperatures, e.g. 210 MPa at 650°C [205] and 240 MPa at 568–713°C [207], both for powders of 0.1 µm particles.
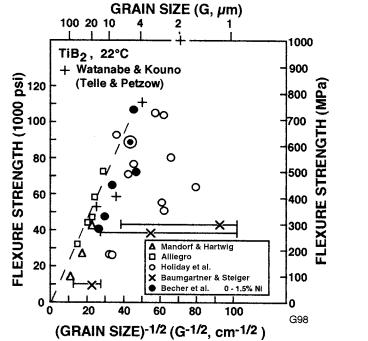
Earlier TiB2 [11, 208–210] agrees with more recent data of Baumgartner and Steiger [211] as well as that of Becher et al. [212], and Telle and Petzow’s [213] evaluation of Watanabe and Kouno’s [214] data indicate a clear larger G branch and possible finer G branches at various strength levels (Fig. 3.25). Other limited data is generally consistent with these trends [215–218].
B4C data from mostly hot pressed bodies in a previous survey [13] showed two branches, with finer G branches showing more effect of grinding parallel or perpendicular to the tensile axis than the larger G branch (i.e. each forming a finer G branch [17]. A further survey [2] (Fig. 3.26) of substantially more data [219–234] corroborated these trends, i.e. generally showing positive finer G slopes, but greater G dependence of the larger G branch, which may or may not extrapolate to σ = 0 at G = ∞. These data cover a considerable composition range, showing no clear, substantial effect of this on σ, other than via G, except for the hot pressed B4C data of Rybalchenko et al. [225] ( 2–5% porosity), which generally falls well below the other data. This may be in part due to lower quality (unspecified) surface finish but appears to reflect processing effects. Thus σ increased at a given G with both hot-pressing temperature and pressure, and for a given pressing pressure σ often even increased with increasing G for G ≤ 5 µm (for all but one of their bodies). The trend for limited effects of composition in most cases is consistent with evaluations of B4C hardness data showing that most of the composition effects were via G [231], in contrast to claims of Niihara and colleagues [232, 233].
Fractography has played an important role in better defining the G dependence of B4C strength, for example some failure from substantially isolated or clustered larger (exaggerated) grains [2, 13]. While this is similar to Al2O3, it is also different, since the large grains in B4C are typically equiaxed, occur less frequently than in Al2O3, and have almost, if not universal transgranular fracture. Frequent twins in B4C, at least in larger grains, may be a factor in these differences, but correction for observed and expected failure from isolated or clustered larger grains (e.g. Figs. 1.20, 1.30) shifts some data points to the larger G branch,
Grain Dependence of Ceramic Tensile Strengths at 22°C |
175 |
FIGURE 3.25 TiB2 σ–G-1/2 data of Mandorf and Hartwig [208], Alliegro [209], and Holiday et al. [210] from an earlier survey [11] along with more recent data for similar materials by Baumgartner and Steiger [211] as well as data of Becher et al. [212] (for specimens with 0–1.5% Ni additions) and from Telle and Petzow’s [213] evaluation of data for nearly dense bodies of TiB2 with three different additives from Watanabe and Kouno [214]. (From Ref. Rice [2], published with the permission of the British Ceramic Society.)
increasing its slope a limited amount, and removing some more extreme lower strengths from the finer G branch. However, again fractography has also shown that some data points are (incorrectly) moved further to the left than most of the data, and some not far enough by using Gm, indicating respectively that they (1) are not pertinent to σ–G behavior, i.e. reflect a more serious defect and (2) are not large enough to be the flaws by themselves. Further, fractography clearly showed cases of failure initiation not occurring from large grains (Fig. 3.27), again showing that the arbitrary use of Gm even in the vicinity of the fracture origin can lead to serious errors. Both the σ – G-1/2 data and fractography again show intersection of the finer and larger G branches when c G. Fractography also showed (via extensive transgranular fracture) mist and hackle, arguing

176 |
Chapter 3 |
FIGURE 3.26 B4C σ–G-1/2 data (mostly hot pressed) from an earlier survey [13] as well as subsequent studies of Rice [17] of two different bodies ground parallel or perpendicular to the tensile axis are shown along with data of Osipov et al. [219], de With [220] (all hot pressed), Champagne and Angers [221] (with varying excess B) Beauvy [222], Seaton and Dutta [223], Vasilos and Dutta [224], Rybal’chenko et al. [225], Bougoin et al. [226] (sintered), Schwetz and Grellner [227], and Schwetz et al. [228] (sintered-HIPed with varying excess C). Numbers next to points are % porosity where > 1%. Vertical lines are standard deviation, and associated numbers are the number of tests. (From Ref. 2 published with the permission of the Journal of Materials Science.)
Grain Dependence of Ceramic Tensile Strengths at 22°C |
177 |
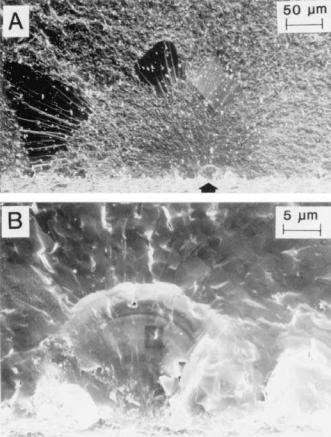
FIGURE 3.27 Fractographic demonstration of failure not occurring from much larger grains in dense B4C. (A) Lower magnification SEM showing a nearly half penny origin (arrow) from a machining flaw in the fine grain structure and a higher magnification of it in (B). Note in (A) the two large grains to the left of the origin, the largest one touching the tensile surface, are clearly not the origin (From Ref. [2], published with the permission of the Journal of Materials Science.)
against significant subcritical crack growth and bridging, which typically is via mostly intergranular fracture. Finally, note (1) that Rice [234] showed evidence of TEA stresses contributing to tensile failure (Fig. 3.35), and (2) that σ trends with G are clearly inconsistnt with toughness results, typically having significant maxima at G 10 µm [2] (Chap. 2, Sec. III.F).
As is shown in Fig. 3.13, the limited α-SiC data is generally consistent

178 |
Chapter 3 |
with that for cubic, β-SiC, as is expected from the limited anisotropy of noncubic α-SiC. However, exaggerated growth of α-SiC grains in β-SiC give frequent fracture origins, e.g. as first shown by Prochazka and Charles [96]. A previous survey [11] of more limited data of Cr3C2 and WC shows large G behavior like that of other ceramics, as well as some evidence of finer G branches. Most WCCo data appears to form fine G branches, e.g. for pure (larger G) WC data. However, Roebuck’s [236] WC-Co data from a novel flexure test concentrating stress in a small test volume showed strengths increasing from 1 to 3 GPa as the origin (pore) size decreased from 100 to 20 µm, which then was constant for failure from larger grains of 6 – 30 µm. This may reflect fracture initiation due to Co deformation, WC-Co miss match strains, or both, again indicating possible changes in mechanisms at small crack sizes.
AIN data of Rafaniello [237] for machined bars from bodies sintered with a few percent of different oxide additions (typically leaving 0.3–2% porosity) clearly showed strengths increasing as G-12 increased (Fig. 3.28). More limited data of Rice [15] for a finer G sintered AIN (+ Y2O3) and a hot pressed body (with CaO addition) is in excellent agreement for machining both parallel and perpendicular to the bar/stress axis, consistent with such machining direction effects. Substantial data of Hiruta el al. [238], for AIN bodies
FIGURE 3.28 Flexure strength of dense (< 3% porosity) AIN processed with different additives versus the inverse square root of grain size (G-1/2). (From Refs. 15, 237.)
Grain Dependence of Ceramic Tensile Strengths at 22°C |
179 |
made with various additions (and < 2% porosity) over a similar G range, though somewhat (e.g. 10 – 15%) higher in strength (probably reflecting moderate test-specimen conditions), are also generally consistent with the other data and the G-12 dependence.
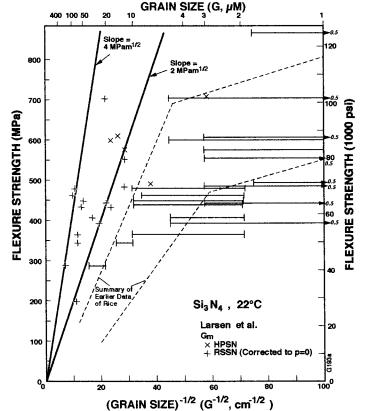
Though limited in its extent (mainly at intermediate and larger G), a previous compilation of Si3N4 data [2] indicates typical large and fine G branches. Plotting of Larsen et al.’s [100] hot pressed and reaction sintered Si3N4 (corrected to zero porosity, Fig. 3.29) shows the same trends, i.e. (1) at finer G, higher σ’s being from machining flaws rather than microstructural heterogeneities, and lower σ’s being from microstructural heterogeneities such as large tabular grains, and (2) the larger G slope (using Gm) is < KIC (≥ 4 MPa·m1/2, for P
FIGURE 3.29 Strength versus G-1/2 for various, mainly sintered or hot pressed, Si3N4 bodies. (From Refs. 2, 11, 67, 100.)